

Water-based pressure sensitive adhesives (PSAs) are viscoelastic materials commonly utilized for labels and tapes, among other applications. Basic PSA performance attributes such as tack, peel and shear depend on the polymer’s bulk linear viscoelastic properties.1,2 Moreover, correlations exist between adhesion test time scales and polymer deformation frequencies, with tack, peel and shear test time scales spanning the frequency range 10-2 to 102 rad/s.1,2 Chang used this frequency range coupled with PSA storage (G’) and loss (G”) moduli to define so-called viscoelastic windows, wherein a given PSA’s window provides insight into its performance properties and the type of PSA (e.g., removable, general purpose, etc.).1,2
This relationship between PSA viscoelastic behavior at given frequencies and performance is useful as a means to target PSA performance attributes and application fit. Standard adhesive application tests like tack, peel and shear can be time consuming and highly dependent on film thickness and quality, which can lead to high variability in the test results (particularly with shear resistance testing). However, using rheology to probe PSA viscoelastic behavior is much less time consuming, more repeatable and more representative of in-use performance. Rheology enables one to screen samples quickly and accurately identify trends for synthetic parameters to achieve targeted PSA properties.
In this article, a Box-Behnken response surface experimental design was performed to investigate effects of PSA monomer type, chain transfer agent concentration and addition method on performance properties. Trends in PSA performance and rheology were determined through analysis of variance (ANOVA) and response surface regression analysis using Minitab®statistical software and used to develop empirical models for predicting PSA properties. Attempts were made to develop regression models to predict PSA performance from rheology data to eliminate the need for conventional, time-consuming PSA application tests.
Experimental Procedures
All PSA latex samples were produced via seeded semicontinuous emulsion polymerization. Target latex particle size and solid content were 400 nm and 60%, respectively. PSA glass transition temperature (Tg) was determined by DSC (10 °C/min. heating ramp). FINAT test methods were followed for measuring PSA sample loop tack, 180° peel adhesion and shear resistance. Viscoelastic properties of different PSA samples were measured on a TA Instruments AR-G2 rheometer at 23 °C over a frequency range of 10-2 to 102 rad/s using 20 mm parallel plate geometry (at 1% strain)
Results and Discussion
Experimental Design
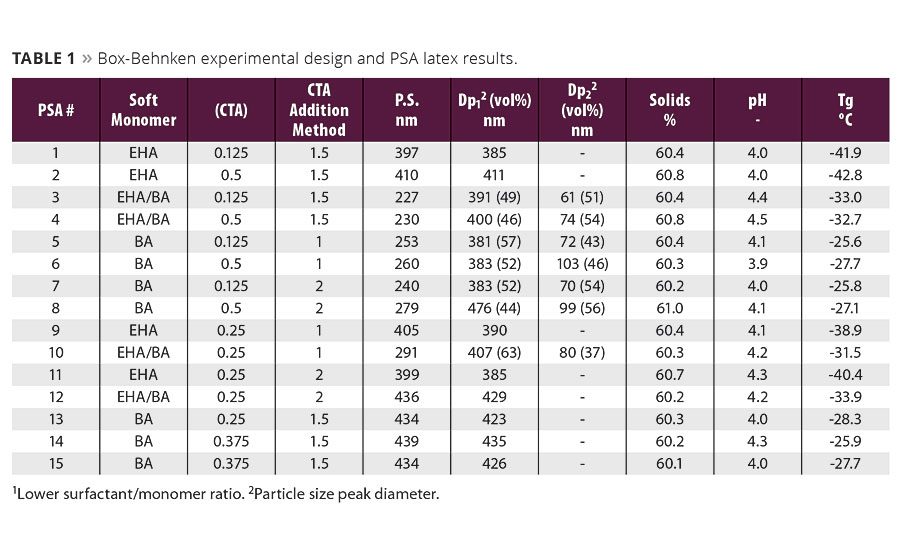
A Box-Behnken response surface design was used to explore three variables known to impact waterborne PSA performance. Table 1 summarizes DOE variables, which were soft monomer type (2-ethylhexyl acrylate, EHA, butyl acrylate, BA and a mixture of the two, EHA/BA), chain transfer agent (CTA) concentration and CTA addition method. CTA concentration levels were 0.125, 0.25 and 0.5 parts per hundred monomer. Three different methods of CTA addition were investigated and are denoted as 1, 1.5 and 2. DOE outputs included three FINAT test methods: loop tack (FTM9), 180° peel adhesion (FTM1), shear resistance (FTM8) and rheology.
PSA Performance Evaluation and Rheology
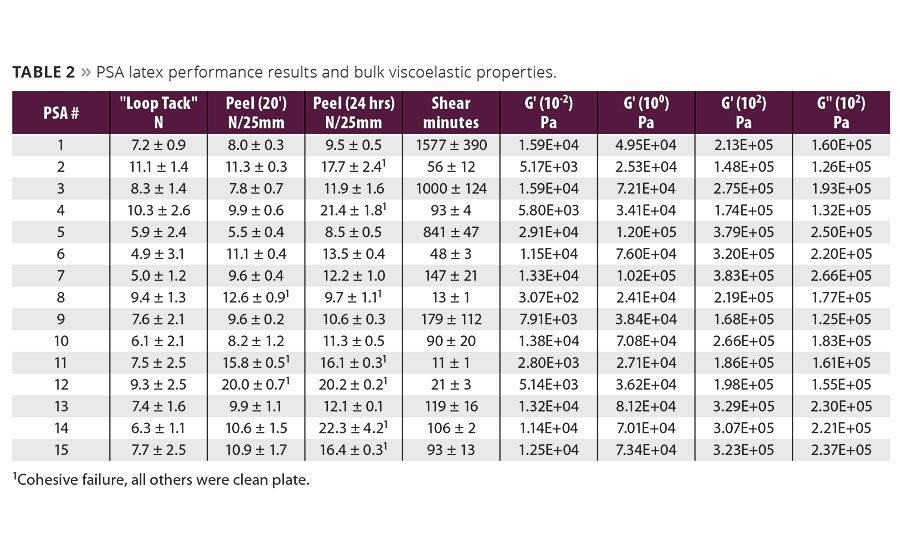
Table 2 summarizes both FINAT test method results and storage (G’) and loss (G”) moduli at specific frequencies based on Chang’s viscoelastic window concept.1,2 G’ at w=10-2 rad/s (hereafter denoted as G’(10-2)) was used for shear resistance, and moduli at frequencies corresponding to both bonding and debonding processes were used for peel and tack.1,2 In peel tests bonding corresponds to G’(10-2) and debonding, comprising both cohesive strength and energy of dissipation terms, corresponds to G’(102) and G” (102).1,2 Tack tests have the same debonding frequency dependence as peel; however the bonding frequency is higher at 100 rad/s. Therefore G’(100) and G’(102) and G” (102) were used to correspond to loop tack results.
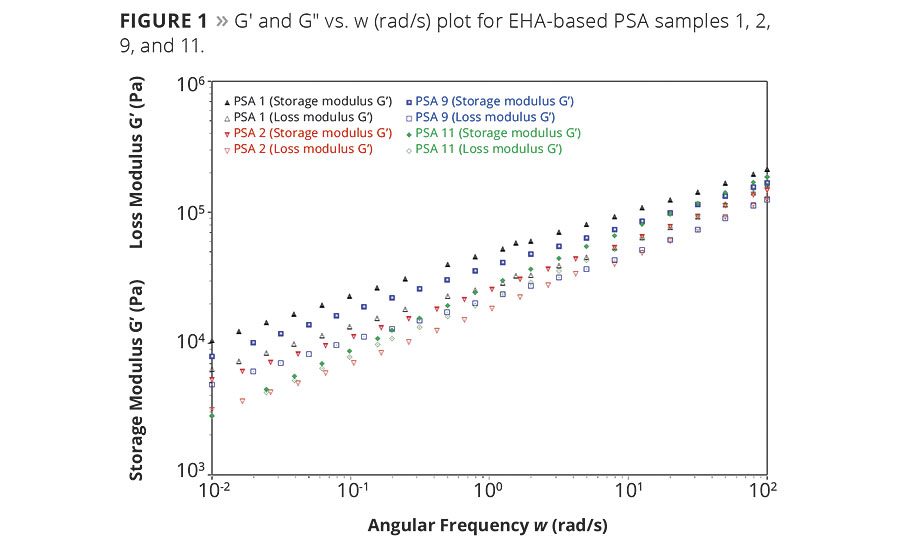
A representative plot of G’ and G” vs. angular frequency, w(rad/s), for the EHA-based PSAs (PSAs 1, 2, 9, and 11) is shown in Figure 1. Differences in the viscoelastic behavior for this group are clearly evident. Further comparison of these curves shows that the rheological differences at the above-mentioned frequencies correspond with performance test results shown in Table 2. For example, in Figure 1, PSA 1 has the highest value at G’(10-2), which corresponds to shear resistance, while PSA 11 has the lowest. Comparing the measured shear resistance and G’(10-2) values in Table 2 confirms that shear resistance was the highest (1577¢± 390¢) in PSA 1 and the lowest (11¢± 1¢) in PSA 11. This same trend between shear resistance and G’(10-2) data also holds true for the other PSA samples (when grouped by soft monomer type) and is clearly evident in their respective moduli vs. wplots (not shown).
Loop tack and 180° peel adhesion, however, are more complicated because they involve bonding and debonding processes, making rheological trends more difficult to discern. For example, of the four PSAs in Figure 1, PSA 2 had the highest measured loop tack (11.1 ± 1.4N) and the lowest G’(100) value (2.53 x 10⁴ Pa), and the latter supports the former in that the lower bonding frequency modulus, the higher the expected tack. However, PSA 2’s G’and G” (102) values were also the lowest and next-to-lowest, respectively, suggesting it had a lower debonding resistance than the others in Figure 1. This conflicting combination of moduli makes it difficult to visually infer tack and peel trends directly from the linear viscoelastic behavior. Consequently, a more straightforward correlation between performance metrics and rheology results was made via Minitab 16 statistical software and regression analysis.
PSA Design of Experiments
PSA performance trends were determined using Minitab 16 statistical software. Response surface regression analysis was used to analyze outputs as a function of independent variables. Box-Cox plots were used to determine the appropriate transformation to apply to response output data. Outputs included FINAT test results and rheology values at specific frequencies.
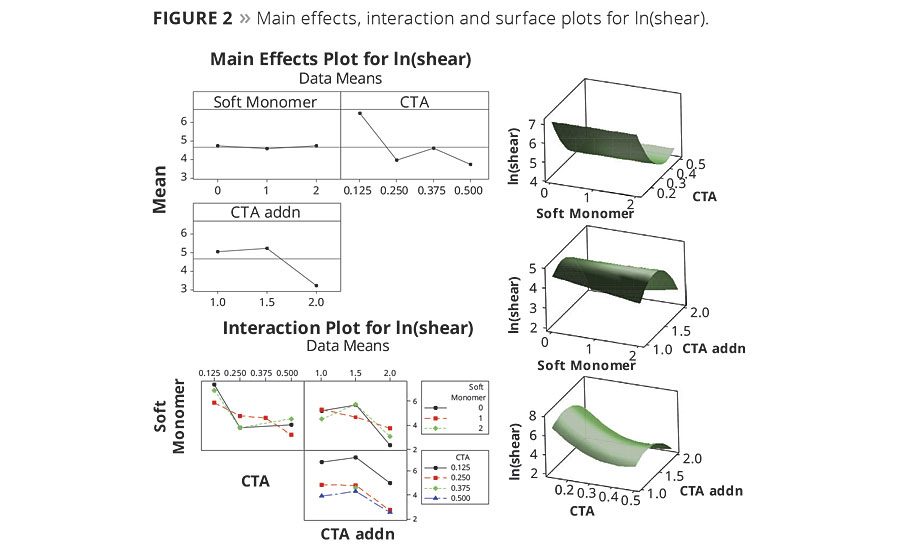
The data was analyzed to determine first- and second-order effects, i.e., main effects and interactions. Figure 2 illustrates main effects, interaction and surface plots for ln(shear). The main effects plot shows the output means at all levels of each variable with the center line across the plot representing the mean for all ln(shear) data.
In the main effects soft monomer plot in Figure 2, the trend line connecting the means at each variable is flat, indicating ln(shear) was not affected by the range of soft monomers explored in this study. Trend lines for the other two variables, however, are not flat, indicating these variables affect ln(shear). This is not unexpected, as CTA concentration and addition method were specifically chosen as variables due to their well-known effect on shear. The slope of the trend lines between variable levels gives an indication of strength and direction of an effect. In the CTA concentration main effects plot in Figure 2, the slope of the trend line moving from 0.125 to 0.250 phm is steep and negative, indicating CTA concentration has a strong negative (inverse) effect on ln(shear). This trend indicates the highest shear is expected to be found using the lowest CTA level, which is valid as CTA moderates polymer molecular weight and crosslinking (gel fraction). However, the strength of this effect is considerably reduced at CTA concentrations >0.250 phm, indicated by the lower slope of the trend line across these higher CTA levels. Likewise, the CTA addition method main effects plot shows a strong negative effect on ln(shear) when changing from addition method 1.5 to 2, but little difference in ln(shear) observed between addition methods 1 and 1.5.
Interaction plots in Figure 2, which plot means for each variable level with a fixed level of a second variable, provide further insight into the variables whose interaction affects the output response. Parallel trend lines indicate no interaction, and interaction strength is indicated by the extent to which the lines deviate from parallel. In the soft monomer vs. CTA concentration interaction plot, the red line (BA-based PSAs) is not parallel with the other two, indicating an interaction. Applying the same analysis to the other two interaction plots reveals another interaction between soft monomer and CTA addition method, and little interaction between CTA concentration and CTA addition method in the range studied.
Figure 2 (right-hand side) also shows three response surface plots generated for ln(shear). Examining the top surface plot, we see shear increases with decreasing CTA concentration and remains constant moving across the soft monomer axis; again indicating shear is independent of soft monomer type studied. The middle surface plot shows a saddle-like surface, clearly indicating a region of maximum ln(shear) with CTA addition method at 1.5, regardless of soft monomer type. Finally, the bottom surface plot shows highest ln(shear) at the lowest CTA concentration and a region near CTA addition method 1.5.
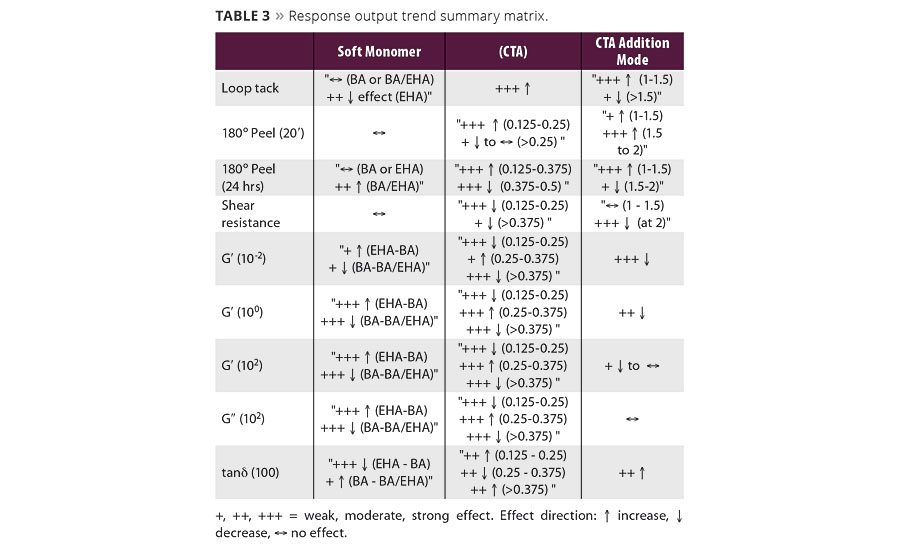
The same trend analyses were performed for all the other response outputs (including results from rheological analysis), and a matrix summarizing main effects trends is shown in Table 3. This summary matrix lists a given variable’s effect (positive or negative) as well as the strength of that effect (weak, moderate or strong) on a given output as the variable moves from its lowest to highest level.
PSA Response Surfaces
Table 4 shows the empirical models developed for all response outputs, except 180° peel adhesion (24 hr dwell) and their respective R2, R2-pred. and R2-adj. p-values for lack of fit and residuals. All models showed no lack of fit at a= 0.05, and residuals were normal and showed no trends.
Performance models with the highest R2-pred. values were ln(shear) (89.5%) and loop tack (72.7%), indicating an adequate ability to predict responses for new formulation levels. Furthermore, the R2-adj. values for these two models were high, with ln(shear)’s model adequately describing 94.8% of data variation and similarly 83.5% of data variation for loop tack. Peel adhesion was more difficult to model with 20-min dwell peel adhesion having an R2-adj. of 65%. The R2-pred. value for this model was much lower than the previous two at 37.5%.
Rheology models were better than performance models in terms of correlation R2, R2-pred. and R2-adj. values; the R2-adj. values describing at least 85% of data variation. Additionally, G” (102) and G’ (102) models had the highest R2-pred. values of any model, both being greater than 92%. The other two rheological terms, G’ (100) and G’ (10-2), had lower correlation with R2-pred. values of 73.1% and 68.9%, respectively.
In Table 4, the model coefficients have been rendered nonspecific (B0, B1, B2, etc.,) for obvious reasons; however their direction of influence (negative or positive) is reported. The most important variable affecting ln(shear) was CTA concentration, both as a first-order and quadratic term, with the former having a negative influence and the latter a positive. The second most influential variable was CTA addition method, which had a moderately positive influence. These results are not unexpected considering that CTA level has a large impact on polymer molecular weight and gel fraction, traits directly effecting PSA cohesive strength (i.e., creep resistance). The negative (or inverse) influence stems from higher CTA concentrations producing lower molecular weight and gel fraction, and therefore lower shear resistance. Soft monomer type was not found to be influential, i.e., shear resistance was independent of soft monomer; however a very minor synergistic effect (interaction) between soft monomer and CTA addition method was present. Not unexpectedly, the terms CTA and CTA2 were also the most influential in the G’ (10-2) model and followed the same direction, indicating good correlation between G’ (10-2) and the time-scale for the onset of creep.
CTA concentration was the most influential variable for loop tack, with a strong negative influence, followed by a significant positive effect from the interaction of CTA concentration and CTA addition method. Similarly, CTA concentration was also the most influential variable in the G’ (100) model, which corresponds to the bonding process in tack tests, and was again negative. The soft monomer was the second most influential factor for G’ (100). When considered alone, this inverse relationship of CTA concentration on both loop tack and G’ (100) is counter-intuitive. Tack might be expected to increase with CTA concentration, as (all else being equal) higher CTA concentration leads to lower molecular weight that can more easily wet out the substrate. However, the CTA concentration and CTA addition method interaction term, with its positive impact on loop tack, indicates that variables in addition to the CTA concentration play an influence. In addition, loop tack is also dependent on debonding frequency moduli, further complicating drawing conclusions based on a sole parameter.
The 20-min dwell peel adhesion model’s correlation was poor (R2-pred. <50%) and therefore this model is not recommended. Further studies are needed to develop a better predictive approach for peel adhesion performance at 20-min dwell.
Correlation of PSA Performance and Rheology
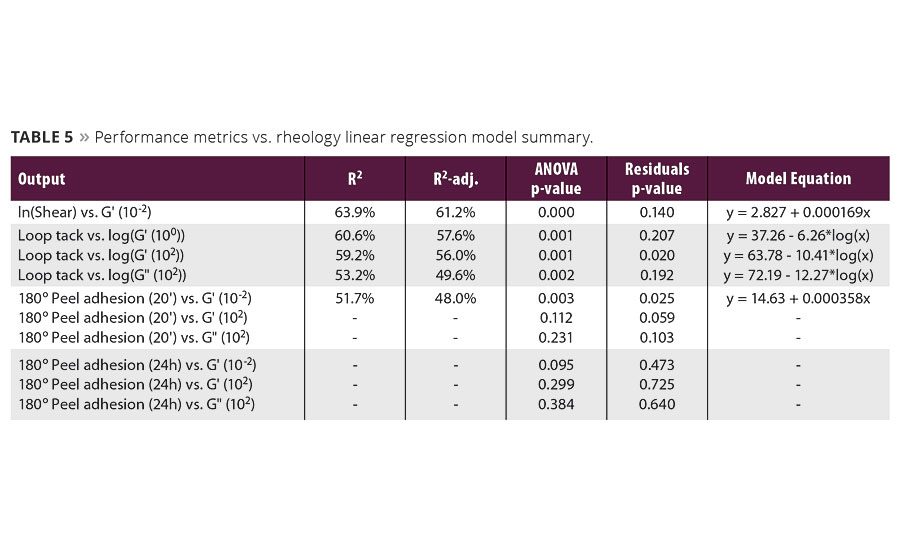
In order to develop models to predict shear resistance, loop tack and 180° peel adhesion from the linear viscoelastic behavior, Minitab 16 was used to plot performance metrics as response variables and frequency sweep data as predictor variables. Models were then based on fitted line regressions. For all plots, a linear regression model was found to be adequate for reflecting trends in the rheology data. Data normality and residual plots were examined for specific patterns and none were observed. Table 5 summarizes model regression equations, R2, and R2-adj. values as well as p-values for ANOVA and residuals (a= 0.05).
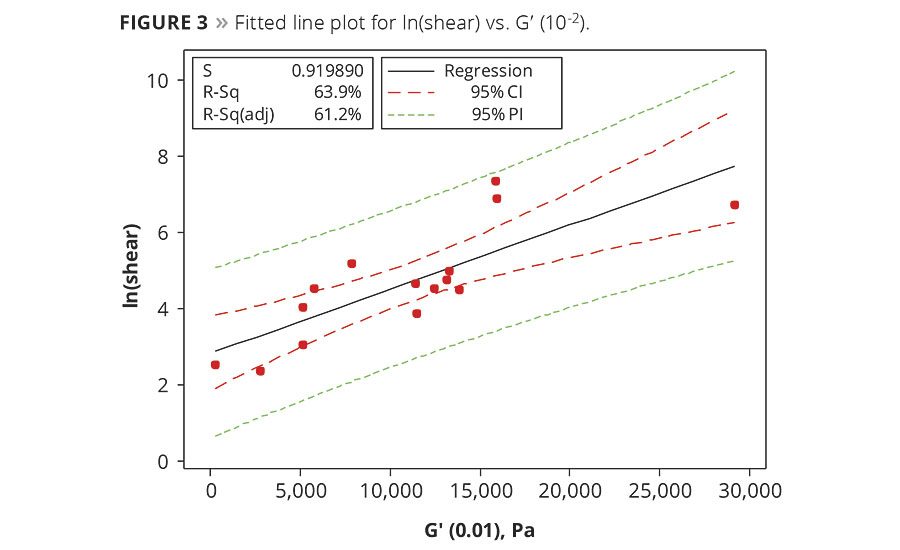
The fitted line plot of ln(shear) vs. G’(10-2) shown in Figure 3 clearly shows a positive correlation between shear resistance and storage modulus at low frequencies. The correlation values of R2 and R2-adj. are 63.9% and 61.2%, representing an adequate model describing 61% of the variation. Alternatively, an inverse correlation exists between loop tack and log(G’(100)) (figure not shown, R2 and R2-adj. of 61% and 58%, respectively). The increasing storage modulus indicates the PSA’s higher resistance to flow, leading to low substrate wet-out, lower bonding efficiency and consequently lower loop tack. Plots for loop tack vs. log(G’(102)) and log(G” (102)) are also inversely related, suggesting that lower moduli at the debonding frequency gives higher tack (R2-adj. approximately 50%). However, the data for loop tack vs. log(G’(102)) was found to be not normal, requiring additional model refinement.
Peel adhesion models were inadequate (R2 and R2-adj. well below 50%). Recall that the response surface model for 20-min dwell peel adhesion (Table 4) was not nearly as well correlated as those for ln(shear) or loop tack, having R2-adj. and R2-pred. values of only 65% and 38%, respectively. The difficulty in developing satisfactory models for peel adhesion may lie in the high variability in the peel adhesion performance data itself, i.e., an inadequate measurement system. However, Chang2 demonstrated a good correlation between peel strength and rheological behavior. Consequently, it is expected rheology data is a better predictor of PSA performance than peel adhesion models.
Conclusions
The effect of soft monomer type, CTA concentration and CTA addition method on a basic PSA’s viscoelastic properties was studied. Both DOE analysis and empirical models indicate CTA concentration was the most influential variable for all response outputs. It had a strong positive effect on loop tack and a strong negative effect on shear resistance, indicating tack and shear cannot be simultaneously increased, at least under the studied conditions. In addition, mid-level CTA concentrations provided the highest peel adhesion.
A Box-Behnken experimental design was used to relate viscoelastic properties to conventional PSA test protocols. The best correlation was found between ln(shear) and loop tack, indicating an adequate ability to predict adhesive performance as measured by standard test protocols (R2-pred. of 90% and 73%, respectively). Peel adhesion (20-min dwell) proved more difficult to model (R2-pred. 38%), likely due to the variability in the peel adhesion test method itself. As a whole, the adhesive’s linear viscoelastic behavior as measured by G” (102) and G’ (102) proved the best correlation with the adhesive’s performance (R2-pred. of >92%).
Fitted line regression plots were used to correlate performance metrics with rheological data, and linear regression models were appropriate for all cases. Adequate models were only found for correlating ln(shear) with G’(10-2) and loop tack with log(G’(100)). The former model showed a positive correlation between shear and G’(10-2). The latter model showed an inverse correlation between loop tack and log(G’(100)) and described 58% of data variation. Models for loop tack and G’and G” at debonding frequency were inadequate (R2-adj. approximately 50%). No adequate model was found for peel adhesion, likely due to the high variability in peel adhesion performance data, i.e., poor measurement systems.
Acknowledgements
The authors wish to gratefully acknowledge Laura Ham for performing PSA performance testing.
References
1 Chang, E.P. J. Adhesion 1991, 34, 189-200.
2 Chang, E.P. J. Adhesion 1997, 60, 233-248.


Report Abusive Comment