


The TiO2 market has been making history in many ways since the pre-recession years ending in 2008. Prices climbed to two-decade highs by early 2012, only to fall to all-time lows by early 2016. TZMI believes the market has bottomed as of Q1 2016. From a demand perspective, early results are indicating an increase in demand in Q1 2016, with early estimates from Q2 2016 showing a continuing trend in the same direction. The relief could not come soon enough given historically low inflation-adjusted prices and negative margins for several producers.
Supply and Demand Balance – a Historical View
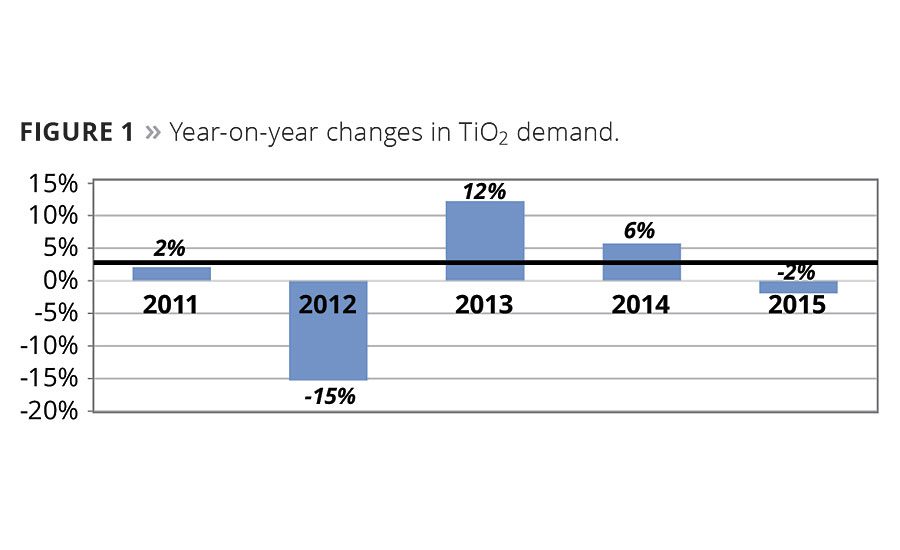
For the last several years, demand has been a roller coaster ride for the TiO2 market, with re-stocking and de-stocking cycles throughout the value chain leading to huge swings in sales volume during each cycle. So, while it is true that during a long period of time that TiO2 tends to grow in line with global GDP, in a given year, the two may not appear correlated in any way. As noted in Figure 1, the average demand growth from 2010-2015 was 2.8%, which is generally in line with GDP; however, the average volatility is approximately 7% versus that average.
Demand volatility is partially a structural factor and partially a result of speculative behavior of some customers. TiO2 products are easy to ship, have essentially an infinite shelf life and have a reasonably low cost to serve international customers. All of these factors lead to a vibrant global trade for the product – as much as two-thirds of demand crosses a national border.
The situation has been made all the worse by persistent oversupply, which has plagued the market since the significant capacity expansions in China starting in 2008. From 2008 to 2014, the Chinese added nearly 1.3 million tonnes per annum of capacity, despite demand growth of 0.5 million tonnes or only 40% of the capacity added. Similar to many other chemical industries, much of the oversupply reported to increased exports; however, much of the capacity was not utilized, as Figure 2 illustrates.
Before the Chinese producers could push greater export volumes into the market, they had to improve quality or their customers had to adapt to a lower-quality product. Given the supply constraints from 2010 to 2012, most customers were more than willing to adapt – where possible – to lower-quality products. Additionally, some of the leading Chinese producers improved quality to open new addressable markets.
At this point, however, it is important to note that all TiO2 products are not pure commodities as some associated with the industry may believe. For many products there are at least 10 different specifications measured for each lot of product sold. Most notably, TiO2 products used in coatings formulations must adequately disperse in a formulation, have high opacity, good brightness and whiteness, and the right level of gloss for the application. Depending on the application, some products may need to have other functional properties. Many producers have products specifically designed for specific end uses.
Producing higher-quality TiO2 products requires high operational excellence, technical and commercial co-ordination between the producer and the customer, and intellectual property and know-how in finishing the product properly. Small mistakes can lead to unsellable products.
Chinese producers have improved, and trade statistics reflect this. Imports have declined from 2008-2015 by nearly 20%, while demand has increased nearly 50% and exports have increased by more than 500% (Figure 3). It is important to note, however, that imports have not disappeared; there are several durable and specialty products that Chinese producers are not capable of producing that still must be imported. The expansion in exports is partially a result of market share gains in low- to medium-quality applications where the Chinese products are fit for use.
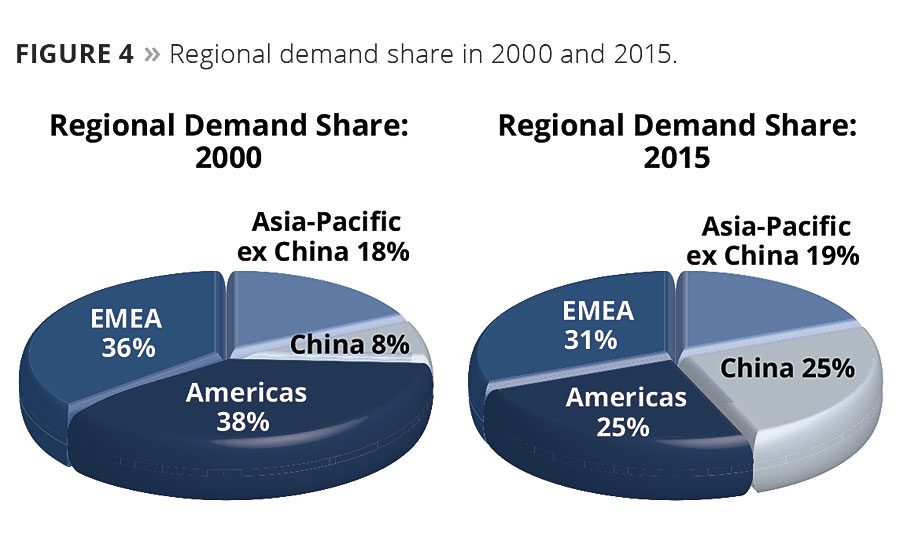
Big shifts in end-use applications have not occurred in the TiO2 industry – coatings remain responsible for 56-57% of demand in a given year, plastics applications consume another 25% of TiO2, while paper, laminates, inks and other applications consume the balance. However, there have been significant shifts in regional demand. A comparison of demand by region can be seen in Figure 4.
As China has become the world’s factory, a demand shift has occurred from Europe, Japan and North America to regions with lower labor rates. Most often this involves China, but also other emerging economies in Southeast Asia. The change in manufacturing base leads to emerging economies’ demand growth in excess of GDP, while demand growth in mature economies is at or below GDP in most cases – and negative in some instances.
Global and regional producers outside of China were mostly caught flat footed by the shifts in demand and the resulting surge in exports. The initial reaction was to build up inventory, expecting the market growth to resolve issues. More recently, action has come in the form of permanent idling of capacity.
Several plants have been shut down in the United States since 2005, as well as several shutdowns in Europe. In the United States during 2015 Chemours shut down its chloride plant in Edge Moor, DE, (120,000 tpa chloride) and a smaller production line in New Johnsonville, TN (60,000 tpa chloride). Huntsman also shut down the ‘black end’ of its Calais, France, site (87,000 tpa sulfate) in 2015, although the company has kept the finishing plant open, which allows the firm the option to finish pigment from other sites. Chemours will effectively offset its U.S. asset rationalization in 2015 with the expansion of its Altamira, Mexico, site in 2016.
Additionally, some permanent shutdowns occurred in China in 2015, although these were partially offset by expansions. TZMI has a similar outlook for China in 2016. Many smaller producers are cash negative; in the west, usually rationalization would follow, but this is not always the case in China.
2016 Outlook
TZMI believes that inventory levels have declined for many global producers, leading to a tighter supply/demand balance. For the first time since 2012, global inventory levels appear to be moving towards normal levels, and in fact may drop below normal levels by the end of the 2016 northern hemisphere paint season when inventory levels are at their lowest.
The demand surge is likely a result of underlying, pent-up demand as well as inventory re-stocking. For the buyers that are timing market turns (agents, distributors), some speculative buying patterns are also evident. This market behavior is typical of a cycle bottom – customers ‘feel’ that the market is turning and buy ahead of underlying demand to take advantage of a price nadir. The cycle turns are difficult to predict with accuracy from a volume perspective. TZMI believes that the volume surge is unlikely to last for all of 2016; slower underlying growth will more likely begin to dominate sales volume figures by mid to late 2016.
Structural oversupply remains a part of the overall landscape for the industry, but it is important to assess where this capacity resides. Most, but not all, of the overcapacity is in China, where not all products are addressable to the global market. Given the slower pace of quality innovation recently, TZMI has slightly lowered its export forecast for China in 2016.
Given the increased sales volumes so far in 2016, the market has begun to feel tighter than it has in years, which is providing confidence to some producers that the worst is behind the industry for the near term. Macro-economic conditions can always stop a recovery in its tracks, and there are warning signs that could spill over to weaker economic fundamentals globally. But given the current trend line, TZMI believes that better margins are more likely than not for the remainder of 2016
For further information, contact marketing@tzmi.com or visit www.tzmi.com.


Report Abusive Comment