


Color abounds in today’s marketplace. Modern automobiles are a veritable palette on which the spectral rainbow is displayed in full glory. Color is applied to every conceivable substrate including metal, upholstery, carpet and plastic; extending even to the subtle hues captured in glass windows.
Color is one of the first attributes to which a person’s attention is drawn and it usually precedes shape and form. Color has aesthetic appeal and can enhance car styling. It can also invoke specific emotions that car buyers relate to. Most importantly, color can form a brand’s identity more profoundly than any other design characteristic.
Due to color’s strong appeal and the customer’s expectation of color uniformity, the specification and control of color is imperative. Variation in color is illustrative of poor workmanship and quality, and to minimize this problem requires the application of color science to promote color communication as well as standardized color measurement methods to ensure product quality.
Color control can be costly and presents an on-going challenge for paint formulators, stylists and auto manufacturers as new car introductions occur annually and consumers expect unique new colors with special-effect paint offerings. In terms of controlling color and appearance, some of these new color effects require more attention to do it right. The paint must also be repairable by the collision repair body shops, as color matching is essential to ensure a seamless color appearance.
Measuring Color
The purpose of color measurement is twofold. First, it is used for process control to ensure the color and concentration of each component (colorants, dyes, pigments) that goes into the color formulation. At this stage of the process, the color measurement does not necessarily have to correlate with visual perception. Often the components that make up the formulation are prepared in a drawdown product form.
The second purpose is to predict whether a color difference from a known color standard is acceptable by a human observer. This information is used to set meaningful color tolerances. At this stage, the correlation with visual acceptance is imperative. This is usually done on the finished product (i.e., spray-out).
In the second application, to justify or validate the specification tolerance, it is first necessary to establish a correlation between the visual observer’s and the numerical color difference assessment (between the standard and batch). The correlation contains two variables for color difference: subjective visual assessment vs. objective instrumental readings. To be valid, a good correlation between these two variables is essential.
While individual observers can exhibit some disagreement in evaluating color difference pairs, a group of observers can improve the precision of the determination. In the end, the human observer is the final arbiter of whether a visual color difference is acceptable, regardless of what the instrument reports. This requirement is often misunderstood, with the observer’s belief that unconditional objective color measurements are more reliable than subjective visual assessments. The root cause of this misunderstanding is that while numerical measurements are objective and precise, the measurement can oversimplify the way the observers see color. There are other factors that affect an observer’s perception of color that is not color related but appearance related (i.e., sample gloss and surface texture). It is important to note that the instrument “averages” the stimulus in the measurement field while the visual system sees color of the reflected or transmitted light in an object mode (located mode by which tangible objects are perceived). For example, if you measure a sample that is spatially half black and half white, a spectrophotometer will measure the color as gray.
Spectrophotometers
Before the introduction of color measuring instruments, most color control was done visually by a human observer (or group of observers). The person in a light booth would hold up a sample of the approved color standard next to the trial batch sample to determine whether or not an objectionable color difference could be seen between samples. This method was not very reliable because of observer subjectivity making it difficult to create contractual specifications. Usually physical limit samples were required to determine how far off the color was from the standard. Since variations in color occur in three dimensions, in principle, a total of six samples are required (for upper and lower limits). These standards can degrade with time and sometimes fade.
It was not until the middle of the 1970s that the first spectrophotometers became commercially affordable, which allowed an objective measurement of color to be made in the automotive industry.
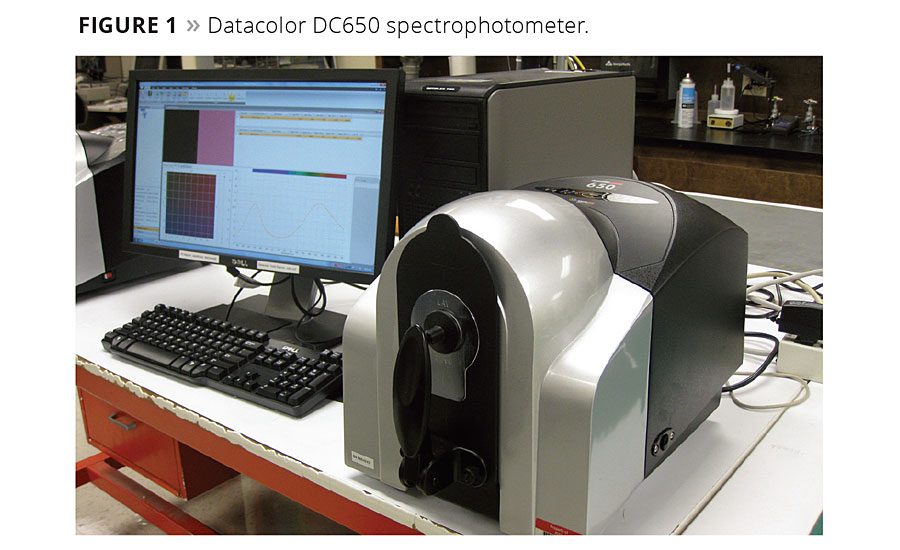
The instruments that measure color are called spectrocolorimeters but are based on a spectrophotometer (Figure 1). A spectrophotometer is an instrument that measures how visible light interacts with a material by analyzing how much light is absorbed, reflected or transmitted. The software takes this spectral (i.e., intensity versus wavelength) data (Figure 2) and converts it into three color coordinates that locate the color in three-dimensional color space (Figure 3). The three coordinates define the object’s lightness, chroma and hue. Lightness is a measure of how light or dark a color is. Chroma is a measure of the difference from a gray of equal lightness, or ‘color purity’, and hue is the dominant spectral color -similar to the colors seen in a rainbow. Nonspectral colors include a mixture of red and blue to make purple or magenta.
Once a color standard is established, the next step is to determine how much color variation is allowed around the color standard before the difference becomes objectionable. Once the magnitude of this difference is known a spherical tolerance can be applied, which specifies the amount of difference allowed in 3D color space as a measure of the radius of acceptance around the color standard. When future batches of the standard color are formulated, the resulting mixture is measured to determine whether or not the new batch falls within the predefined sphere of color acceptance. This is a simplified overview of how the automotive industry defines and controls color.
The Role of Geometry in Seeing Color
Seeing involves three elements: light, object and vision. If all three are not present, there is no vision. These three elements are situated geometrically in 3D space. The spatial relationship and properties of all three elements determine how objects appear. The color measurement geometry defines the geometric conditions under which the object is illuminated and viewed.
The geometry of the light source relative to the object is defined by the angular size of the light source, which varies with the distance between the light source and the object. To properly specify the viewing geometry of the light, object and observer, it is necessary to assemble these elements into an optical system by specifying the directional planes and relative angles of these elements to the observer (or detector).
The color we see (or measure) under these conditions is specific to this measurement geometry. For most diffuse objects (i.e., colored paper, cloth and nonmetallic plastics, etc.) instrument geometry does not play a large role in altering the measured color. However, for gonioapparent colors (pertaining to a change in appearance with illumination angle or viewing angle), change any of these elements and the color will appear altered.
To describe how color is viewed in geometric terms, we start with a human observer. The observer is holding a sample that is illuminated from above by a light source. From the plane of the sample it is illuminated at 0 degrees and viewed at 45 degrees. This describes the color measurement geometry in simple terms and is specified as 0 degree illumination, with a 45 degree view. The abbreviation for this configuration is 0°: 45°. It turns out that for most solid colors, which do not contain metallic flakes and other gonioapparent pigments, this is the way human observers view colors.
There are many color measuring instruments in industry with this “direct” measurement geometry. Some systems feature a reciprocal or the reverse geometry, i.e. 45°:0°. The optical principle known as Helmholtz reciprocity states that you can swap the sensor and light source without affecting the measurement flux. By this principle, 45°:0° and 0°:45° are equivalent.
What criteria are used for determining the best measurement geometry? The answer has to do with how we, as observers, see objects in the world around us. While there is some debate about what is the best measurement geometry to use, the existing instrument geometries are somewhat extreme; for example, a direct geometry such as 0°:45° emulates a real-world viewing environment where the object is viewed with a black or dark surround with an overhead light at 0 degrees, and is viewed at 45 degrees by an observer. This type of illumination and viewing is rarely experienced in the real world, where, in most rooms, offices or retail environments the illumination usually comes from multiple directions, either directly or indirectly (diffuse). Even in daylight, where most cars are viewed, you have a combination of sunlight and indirect light.
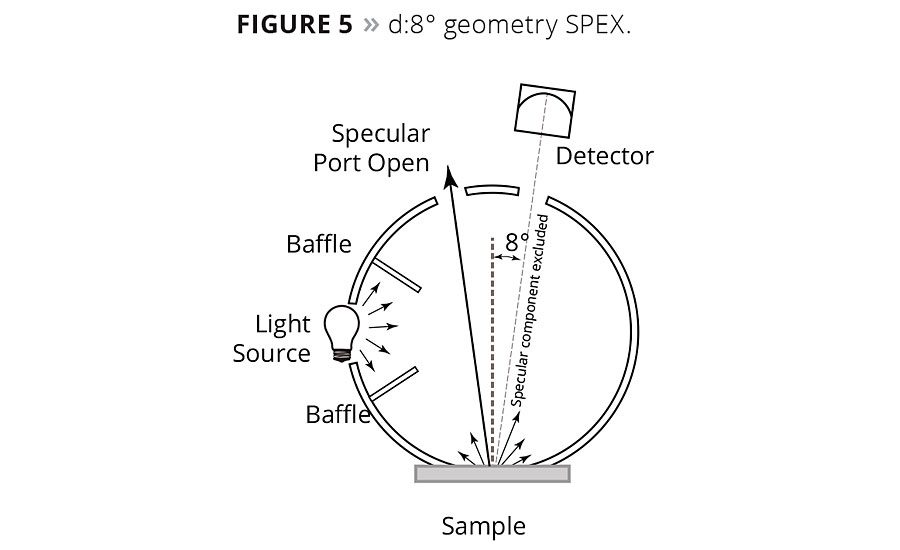
Besides the 0°:45° geometry, what are some other types of geometry? There is a viewing condition where we observe the appearance of objects where light is coming nearly equally from all directions. This occurs when we are in a daytime fog, or when the sky is completely overcast. Some colors can appear different in this environment. Instead of light coming from a particular direction, light comes from all directions. Using the same designation for illumination and view as we did earlier we would designate this geometry as d:0°, where our object is illuminated (diffusely) at all angles and viewed at normal or 0 degrees. A spectrophotometer with this geometry is designated as d:8°. It uses an integrating sphere, which is typically a hollow ball 4 to 6 inches in diameter with a powdery white coating inside that reflects nearly 100% of the light energy. A light (often a pulsed xenon flash lamp) illuminates the inside of the sphere, which diffusely illuminates the sample (placed on the outside port of the sphere) from all directions, and the detector views the sample from a near normal angle of 8 degrees. This geometry correlates best with colors seen in diffuse viewing environments, such as viewing cabinets with gray walls, and it has advantages over the direct geometry in that it is less sensitive to variations in the sample surface. It is also much less sensitive to other appearance attributes such as visual texture, directionality of surface and nonuniformity in surface color, which, depending on what you want to measure, can be either an advantage or disadvantage. There will always be some level of interaction between the surface morphology of a specimen and the efflux optics of an instrument. For maximum color difference sensitivity, this method does not correlate as well with direct color measurement geometry, such as the 0°:45°.
Most sphere instruments have provisions for including or excluding the specular component of a sample. This is referred to as specular included (SPIN) and specular excluded (SPEX) (Figures 4 and 5). SPIN is simple since all the reflected energy from the sample is captured by the integrating sphere. It measures mixed reflection, which is a combination of both regular and diffuse reflection. In SPEX the specular component of reflectance may be excluded by allowing most of the specular component or gloss to escape to the outside of the integrating sphere (via light trap). In this case, only the diffuse reflectance component is measured.
The third measurement geometry is used to characterize the color and appearance of gonioapparent materials. These are colorants that change color and appearance with changes in the angles of illumination and view, relative to the observer. Examples of a gonioapparent pigment are metallic flake pigments, pearlescent pigments or light interference pigments (including diffractive pigments). This measurement geometry is more complicated and requires a sophisticated spectrophotometer with usually one angle of illumination (45 degrees) and multiple aspecular angles of view, (anywhere from three to six unique aspecular angles) (Figure 6). This multiangle geometry is classified as a direct (or uniplanar) geometry similar to the single angle 45°:0° geometry, which, incidentally, is included in one of the multiple angles (45°:As. 45°). This angle is included to measure the nongonioapparent color of paint. The multiangle aspecular measurement geometry is particularly sensitive to changes in the orientation of metallic flakes in the paint vehicle and is required to characterize a property known as “flop effect” where the lightness of the color falls off with surfaces that curve away from the observer (Figure 7).
Gonioapparent paints are very sensitive to changes in the viewing environment. Situations can occur where a color difference evaluation of a sample pair matches under a uniplanar geometry but mismatches under the sphere geometry. This is often incorrectly referred to as geometric metamerism. This mismatch can occur when a formulation is done using a particular geometry and then viewed or measured using a different geometry. For this reason, it is recommended that gonioapparent materials should be visually evaluated with a simulation of the same geometry they were measured with. To ensure a proper match under different viewing conditions, it is recommended that color difference pairs be measured under both a direct (multiangle) and sphere geometry.
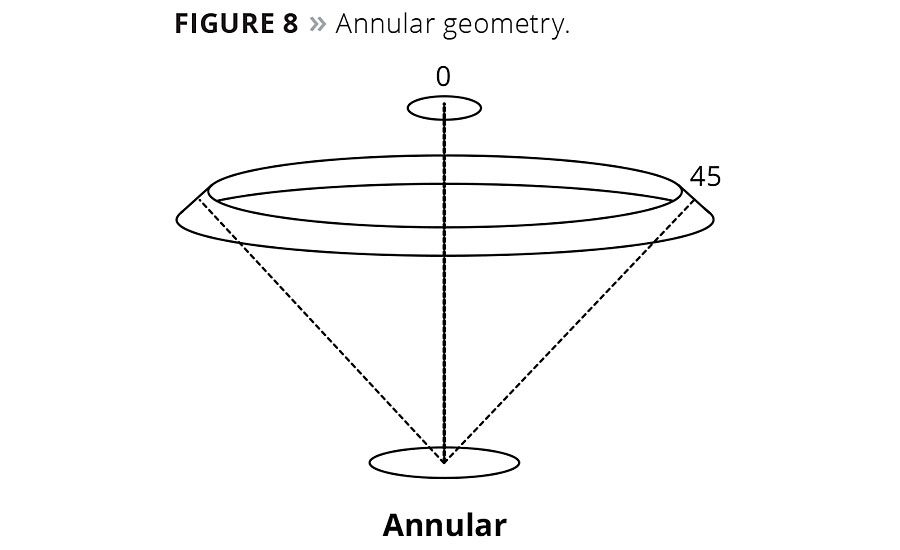
It is important to note that all uniplanar geometries measure color in a single bi-directional plane. This plane is defined by connecting a line between the light source, the sample and the detector defining the measurement plane. The plane is bi-directional in the sense that the light source and detector come from two different directions along the same plane. Relative to the orientation of the sample all of the reflected or transmitted energy is measured collinearly in a single direction only. As long as the sample surface/color is the same in all directions the sample is said to be homogeneous. If the sample has a different color or structure that is directional (i.e., corduroy fabric, striated metal finishes, skeins of thread, etc.) then the sample is said to exhibit “directionality of surface”. In this case, depending on the direction of the orientation, it may be necessary to rotate the sample 90 degrees to make a second measurement, and either presents the data as directional or as an average of both directions. There are other geometries that eliminate the directional aspects of a surface by averaging out the variations. This is done by modifying the 45°:0° geometry by illuminating the sample circumferentially with multiple light sources at 45 degrees, and viewing or detecting the light at 0 degrees. Another iteration of this geometry features an annular or ring illumination that illuminates the sample continuously in all directions. (Figures 8-10).
To varying degrees each of the different measurement geometries measures a different aspect of the sample. The choice depends on what property of the sample you wish to measure.
Table 1 summarizes, for each measurement geometry, the advantage and disadvantage of each configuration.
There are other geometries for characterizing specialized color effect pigments that are not commonly used in the industry. A new geometry was developed by Viavi Solutions specifically for a family of gonioapparent pigments called opaque thin-film optically variable pigments (OVP). To characterize the color shift of these pigments requires multiple color angles of illumination, typically three angles with corresponding detection or viewing angles that are +15 degrees off-gloss from the opposed angles of illumination. A goniospectrophotometer is required to make these measurements. These specialized instruments can be configured to make hundreds of measurement geometries.
Out-of-plane geometries are also used where the sample is illuminated from one direction and viewed at 90 degrees from the bi-directional plane. This type of viewing geometry may be necessary for materials that have gonio-dependent asymmetrical reflected light distributions. These measurements are usually relegated for pigment R&D and are not commonly used in the industry.
Table 2 shows the recommended measurement geometries for different products used in the auto industry.
Conclusion
In summary, having a sound understanding of color measurement geometry is essential to get the most out of your color measurement system. The improper application of measurement geometry can lead to large discrepancies between color assessments of visual color differences compared to measured differences. When improper selections are made, problems will occur that can greatly undermine the producer’s confidence in their ability to control color, and, more importantly, can lead to a loss of customer confidence in the ability to meet their requirements. For color conformance, the visual acceptance of color difference will always override numerical assessment. Identifying the optimum color geometry at the beginning of the color measurement process sets the stage for proper color assessments, ensuring the best correlation between visual and numeric color measurement.
For more information, visit www.viavisolutions.com/en-us.

Report Abusive Comment