
Chlorinated polyolefins (CPOs) have been used as adhesion promoters for polyolefin substrates for several years. There have been many interesting and enlightening studies conducted on the use and mechanism of CPO adhesion promotion for PP and TPO.1-5 In order for CPO to do its job in promoting coating adhesion to a substrate, namely PP and TPO, it must first wet and adhere to that substrate. Factors affecting the ability of CPOs to bond to PP and TPO substrates have been examined and are dependant on substrate and CPO compositional variations as well as many other factors.1,6-8 An adhesion promoter must also have good interaction with the topcoat in order to provide adequate adhesion of the coating to the substrate, which can be affected by compositional variations in both the adhesion promoter and topcoat system.4,5,9
Non-chlorinated polyolefin (N-CPO) adhesion promoters have been developed to promote adhesion of coatings applied to PP and TPO substrates, but studies are limited on their use and mechanism for promoting adhesion. The performance properties of a solventborne, non-chlorinated adhesion promoter applied under both melamine-cured and two-part urethane coatings are described in a study conducted by Templeton et.al.5 Results from this study showed that a non-chlorinated adhesion promoter provided excellent adhesion and gasoline resistance performance under two-part urethane coatings, but showed poor humidity resistance properties under the melamine-cured coating system. The use of low-viscosity functionalized olefinic polymers in color coats has also been examined.10 Results from this study suggest that low-viscosity functionalized olefinic polymers can be formulated into basecoats that can be directly applied to TPOs with good adhesion and performance properties. Waterborne, non-chlorinated adhesion promoters for PP and TPO substrates have also been reported.11 These materials provide good adhesion of coatings to both PP and TPO. Similar materials were also investigated by Jackson et al., although these materials were utilized in thermoset adhesion promoter systems.12 Polyacrylic-grafted polyolefin dispersions have also been investigated by Hintze-Bruning and Borgholte.13 These materials provided good adhesion of a commercial basecoat/two-part urethane clearcoat system applied over TPO. In this study, adhesion was found to be highly dependant on the nature of the grafted polyolefin and the type of substrate coated.
CPOs provide excellent adhesion to a wide variety of coating types applied over both PP and TPO substrates. These materials have been tested and used in commercial adhesion-promoter systems for several years. With recent advancements in N-CPOs that provide good adhesion and superior resistance properties, one becomes interested in developing a better understanding of how N-CPOs promote adhesion to PP and TPO. Of particular interest is the performance properties of blends of CPOs with N-CPOs, since each of these materials have certain superior performance properties. In this study, the adhesion and gasoline resistance performance properties of CPOs, N-CPOs, and various blends of a CPO/N-CPO are investigated using standard automotive test methods and other analytical techniques. Adhesion properties were quantified by measuring 90o and 180o peel strength of adhesion promoters through the use of a universal tensile testing machine. Surface characteristics of the adhesion promoters applied over a TPO substrate were examined, as a function of curing temperature, using AFM (atomic force microscopy).
Experimental Adhesion Promoters Investigated
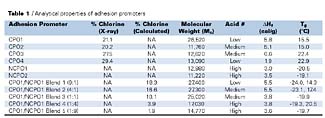
Performance properties of four chlorinated polyolefin adhesion promoters (CPO1-CPO4), two non-chlorinated adhesion promoters (NCPO1, NCPO2), and five blends of CPO1/NCPO1 at various solid ratios were evaluated. The ratios of CPO1:NCPO1 investigated were approximately 9:1, 4:1, 1:1, 1:4 and 1:9 on a solids basis. The analytical properties of the adhesion promoters are shown in Table 1. The CPOs that were investigated varied in chlorine content, molecular weight, acid number, crystallinity and glass transition temperature (Tg). The N-CPO adhesion promoters varied only in functionality. The CPO1/NCPO1 blends varied in chlorine content, molecular weight, functionality, crystallinity and Tg.
Percent chlorine for the CPOs was measured by X-Ray fluorescence (Spectro-Asoma Model 200T Instrument). The percent chlorine for the CPO1/NCPO1 blends was calculated by taking the weight percent of CPO1 in the blend and multiplying it by the chlorine level of CPO1 (21.1%). The molecular weights of the adhesion promoters were determined using GPC (gel permeation chromatography, Perkin-Elmer LC 600 Autosampler, Perkin-Elmer Series 200 LC pump and Refractive Index Detector.) Acid number was determined by potentiometric titration using a Metrohm autotitrator. The titration was monitored using a glass pH-indicating electrode and a reference electrode. The titrant was 0.1N ethanolic KOH. The acid number results are reported as a range (low, medium or high). The heat of fusion (DHf) and glass transition temperature(s) were determined through the use of differential scanning calorimetry (TA Instruments Dual Sample 2920 Auto DSC with a liquid nitrogen-cooling accessory). Two heating scans were used. The DHf was measured as the area under the melting peak (Tm) from the first heating scan, while the Tg was measured from the second heating scan. The first heating scan defines the intrinsic properties of the sample as supplied, while the second heating scan defines inherent properties of the sample.
Adhesion and Gasoline Resistance Testing
The adhesion and gasoline resistance performance properties of the adhesion promoters, shown in Table 1, were determined when applied over two TPO substrates (Solvay Sequel 1440 and Amoco Amtuff 3110) and topcoated with two commercial OEM topcoat systems. The topcoat systems used in this study were a 1-part (1K) melamine-cured basecoat/1K melamine-cured clearcoat baked at 250 oF for 40 minutes and a two-part (2K) urethane basecoat/2K urethane clearcoat baked at 176 oF for 40 minutes. The adhesion properties of the coated panels were determined in accordance with ASTM D 3359B and ASTM D 4585; blistering of the coating system upon exposure to high temperature and humidity conditions was determined as per ASTM D 714. The gasoline resistance properties of the coated panels were determined using a modified Ford gasoline soak method (Ford Modified Juntunen Method).1. Preparation of the Substrates
Substrates used:- Solvay Sequel 1440 TPO (lot # 1618321; 4"X12"X0.125" cut into 2"X6" panels)
- Amoco Amtuff 3110 TPO (lot # SA1501; 4"X12"X0.125" cut into 2"X6" panels)
2. Application of the Adhesion Promoters
- Each of the adhesion promoters was diluted, as supplied, to 5% adhesion promoter solids in toluene for spray application.
- The adhesion promoters were spray applied onto the TPO substrates using a Devilbiss Model JCV-570 spray gun (35-40 lbs of air pressure at the gun).
- Two coats of adhesion promoter were applied to each panel, giving an approximate film thickness of 0.1-0.3 mils (2.5-7.6m). The adhesion promoters were air-dried before application of the topcoats.
3. Application of the Topcoats
Topcoats used:- OEM 1K white melamine-cured basecoat (1.4-1.6 mils; 35-41m)/1K melamine-cured clearcoat (1.4-1.8 mils; 35-46m). Coating system baked at 250 oF for 40 minutes in an electric oven.
- OEM 2K urethane basecoat (1.4-1.6 mils; 35-41m)/2K urethane clearcoat (1.4-1.8 mils; 35-46m). Coating system baked at 176 oF for 40 minutes in an electric oven.
- Spray applied using a Devilbiss Model JCV-570 spray gun (45-55 lbs of air pressure at the gun).
4. Initial Adhesion and Adhesion After Exposure to Cleveland Humidity
- Samples were tested in triplicate for each substrate/adhesion promoter/topcoat system.
- Initial adhesion was conducted in accordance with ASTM D 3359B (results are reported as percent-retained adhesion of the coating to the substrate).
- Adhesion after exposure to Cleveland humidity was conducted in accordance with ASTM D 4585 (120 oF) and blistering of the coating system was determined in accordance with ASTM D 714.
- The percent-retained adhesion of each coating system was determined after 24, 96, 264, and 720 hours of exposure. Results reported are an average of triplicate samples.
- The tape used for determining adhesion in this study was Permacel 99 (supplied by Permacel).
5. Gasoline Resistance Testing (Ford Modified Juntunen Test Method)
- Samples were tested in triplicate for each substrate/adhesion promoter/topcoat system.
- Each of the panels were scribed with a sharp knife to give 100 squares, each square being approximately 3 mm in width and height.
- The scribed panels were immersed in a synthetic gasoline mixture and were checked for percent retained adhesion and lifting of the coating every 15 minutes for up to 120 minutes, if necessary. The results are reported as percent retained adhesion of the coating to the substrate and percent lifting of the squares around the crosshatch edges.
- The synthetic gasoline mixture consisted of 45% by weight of toluene, 45% by weight of isooctane, and 10% by weight of pure ethanol.
90-deg and 180-deg Peel Strength Studies
Peel strength performance properties of the adhesion promoters listed in Table 1 were determined through the use of a universal tensile tester, which is an instrument often used to determine tensile strength of various materials. In this study, Sequel 1440 TPO was coated with each of the adhesion promoters shown in Table 1. The adhesion promoters were then topcoated with a 1K white melamine-cured basecoat/1K melamine-cured clearcoat system. Duplicate panels were prepared and tested for each substrate/adhesion promoter/topcoat system and for each method (90o and 180o). Upon application of the clearcoat, a clear mesh polyester fabric14 was embedded into the clearcoat upon preparation of the panels. The coated panels were baked and aged for approximately one week before testing. The fabric was then connected to a universal tensile tester, and 90o and 180o peel strengths of the substrate/adhesion promoter/topcoat systems were then determined.1. Preparation of Test Specimens
- Sequel 1440 TPO substrates were used in this study (4" X 12" X 0.125"). The substrates were wiped with isopropyl alcohol soaked cloths and air-dried before application of the adhesion promoters.
- The adhesion promoters were spray-applied to the substrate as described earlier and were air-dried before application of the topcoat system.
- The topcoat used in this study was the same 1K basecoat/1K clearcoat system used in the initial adhesion and gasoline resistance studies. The basecoat was applied as described earlier. One coat of the clearcoat was then applied over the basecoat using 45 lbs. of air pressure at the gun. Upon application of the first coat of clearcoat, a clear mesh fabric14 1" X approximately 18-20" was applied on top of the first layer of clearcoat and in the center of the panel lengthwise. The mesh fabric was applied such that approximately 6-8" of fabric overlapped the end of the panel. The second coat of clearcoat was then applied to the substrate and on top of the mesh fabric.
- The coated specimens were baked in an electric oven for 40 minutes at 250 oF.
- The test specimens were left standing at room temperature for 1 week before testing. Before determining the peel strengths, the panels were scribed with a sharp knife along both edges of the mesh fabric running the length of the panel.
2. Test Equipment and Conditions
A universal tensile tester was used to measure both 90o and 180o peel strengths of the adhesion promoters. The overlapped mesh tape, attached to the coated panels, was attached to the universal tensile tester grip device (90o method).
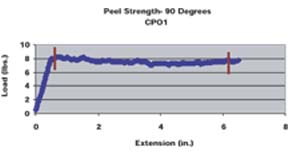
A pull rate of 2 inches per minute was used for both the 90o and 180o methods. A similar method for determining 90o peel strengths of various adhesion promoters was employed by Kondos and Mayo.15 For the 180o peel strength method, the panel holder was rotated 90o such that the angle between the substrate and the mesh tape at the point of separation was 180o. The average peel strength was determined for each substrate/adhesion promoter/topcoat system by taking numerous data points over a given distance through the use of a computer software program. The average peel strength determined by the computer program is the average load required to pull the mesh tape from the substrate as a function of extension divided by the width of tape pulled (1 inch). The peel strength data points used to determine the average peel strengths were taken after the load applied appeared to equilibrate (Figure 1). The reported average peel strength was calculated from duplicate panels, along with standard deviations.
Microscopy Studies
To gain a better understanding of the role of surface topography and nanoscale surface roughness on the CPO1, NCPO1 and CPO1/NCPO1-blend peel strengths, AMF-based phase imaging was employed. The CPO1, NCPO1, CPO1/NCPO 9:1, CPO1/NCPO1 1:1, and CPO1/NCPO1 1:9 blends were analyzed directly on panels after application and after baking at 80 and 120 oC.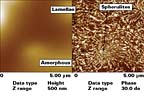
1. Preparation of Substrates
- Each of the adhesion promoters described above were spray applied at 5% solids in toluene, over three 2"X6" Sequel 1440 TPO panels.
- One panel was baked at 176 oF for 40 minutes and cooled to room temperature. A second panel was baked at 250 oF for 40 minutes and then cooled to room temperature, while the third panel from the triplicate set was air-dried at room temperature.
- An AFM was used to examine the surfaces of each of the adhesion promoter-coated substrates.
2. Surface Imaging and Surface Roughness Measurements
All surface imaging and surface roughness measurements were obtained using an AFM, Dimension series D3000 AFM (Digital Instruments, Santa Barbara, CA). Probes used for analysis are from Nanodevices, Multi 75, with spring constants 5 N/m, resonant frequencies of 75 kHz and tip radius < 10 nm. AFM-based tapping mode phase imaging was employed in order to provide morphological information and crystalline morphologies. Contrast variations and phase images have been shown to differentiate crystalline from amorphous regions in growing spherulites.16 Darker regions in phase images correspond to amorphous polymer domains, while lighter areas are indicative of crystalline chain fold spherulitic structures. The results are displayed in figures as height and phase images. In each of the figures, the left-hand image indicates the height profile, where lighter regions are indicative of peaks and darker areas represent low-lying valleys. The right-hand images in figures are phase images whose contrast relates to surface viscoelasticity and microhardness. Lighter regions are therefore relatively hard, while darker regions are softer. Image data were recorded as both height and phase modes. Height and force modulation images were recorded simultaneously during scanning. Surface roughness analysis was also performed on panel surfaces by measuring root-mean-square surface roughness (RMS). The RMS measure is based on the following equation: RMS = [ y12 + y22 + y32 ... yN2]1/2N
Where y is the z, or height value, of each image point and N is the total number of points within a given image.
Results and Discussion
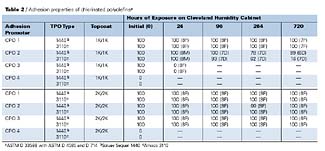
Adhesion Properties of CPOs CPO adhesion, as determined by ASTM D 3359B, D 4585, and D 714, is shown in Table 2. The results show that all of the adhesion promoters provide excellent initial adhesion of both coating types on both TPO substrates, with the exception of CPO4. Complete adhesion failure of the coating occurs when this CPO is used as an adhesion-promoting primer for the TPO substrates. The best overall adhesion performance was obtained with CPO1. CPO1 is higher in molecular weight than the other CPOs tested, and it is believed this allows for its improved performance, especially under high temperature and humidity conditions. CPO1 also appeared (visually) to flow better over the substrate when compared to the other CPOs, which may be a result of its combined physical and chemical properties. CPO3 shows some interesting performance properties. It provides excellent adhesion properties (before and after humidity) when applied under the 2K/2K topcoat system, but shows extensive adhesion failure under the 1K/1K system. The reasons for this phenomenon are not completely understood, but if the poor adhesion results under the 1K/1K topcoat system with CPO3 were a solubility phenomenon, then one would expect poor performance with the 2K/2K topcoat system, since the basecoats are likely to contain similar solvents (esters, ketones, aromatic hydrocarbons). Analysis of the failure mode of CPO3 with the 1K/1K system would help shed light on this subject.
Adhesion Properties of NCPOs
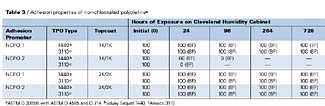
The adhesion performance properties of the NCPOs, as determined by ASTM D 3359B, D 4585, and D 714, are shown in Table 3. Both of the NCPOs provide excellent initial adhesion of both coating systems applied over both substrates. The best overall adhesion performance was obtained with NCPO1. NCPO2 provided excellent adhesion performance, before and after humidity testing, when applied under the 2K/2K topcoat system, but showed extensive adhesion failure after exposure to high temperature and humidity conditions with the 1K/1K topcoat system. NCPO2 shows similar adhesion performance properties as that shown by CPO3 with both topcoat systems (both fail with the 1K/1K topcoat systems after humidity testing). The only difference between NCPO1 and NCPO2 is functionality.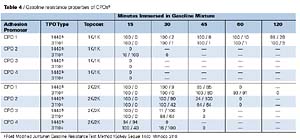
Gasoline Resistance Properties of CPOs
The gasoline resistance performance properties of the CPOs, as determined by a modified Ford test (Modified Juntunen), are shown in Table 4. CPO1 provides the best gasoline resistance properties of all the CPOs tested. Since CPO1 is higher in molecular weight than the other CPOs tested and its chlorine content is similar to CPO2, it is reasonable to assume that the increased molecular weight allows for the improved gasoline resistance properties. Chlorine levels of CPO have a major effect on their solubility properties. Generally, as the chlorine level increases, solubility in common coating solvents and gasoline increases. CPOs 2 and 3 show a good correlation of this solubility effect when applied under the 2K/2K topcoat system. CPO4 shows the worst gasoline resistance performance of the CPOs tested.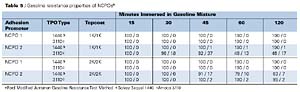
Gasoline Resistance Properties of NCPOs
The gasoline resistance performance properties of the NCPOs, as determined by a modified Ford test (Modified Juntunen), are shown in Table 5. Both NCPOs provide good gasoline resistance properties, especially in comparison to the CPOs. NCPOs generally provide better gasoline resistance properties due to their lack of chlorine content and perhaps structural differences. NCPO1 provides the best overall gasoline resistance properties of both the CPOs and NCPOs tested.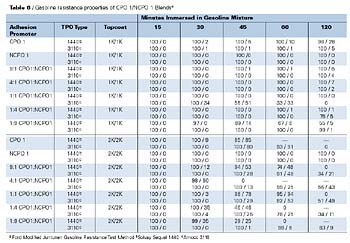
Adhesion Properties of CPO1/NCPO1 Blends
As shown previously, CPO1 and NCPO1 show the best overall performance properties of the CPOs and NCPOs tested. Several blends of CPO1/NCPO1 were evaluated for adhesion performance properties (9:1, 4:1, 1:1, 1:4, and 1:9 on a solids basis). The samples were measured for percent-retained adhesion and blistering initially and at 24, 96, 264 and 720 hours of high temperature and humidity exposure. After 720 hours, most samples, regardless of the CPO/NCPO ratio, topcoat type or TPO type, had 100% retained adhesion with an 8F blister rating. The only exceptions to this were CPO 1 control, NCPO 1 control, 9:1 CPO1/NCPO1 blend under 1K/1K topcoat on Solvay Sequel 1440 TPO and the CPO1 control and 4:1 CPO1/NCPO1 blend under 1K/1K topcoat on Amoco 3110 TPO. These five substrate/adhesion promoter/topcoat systems had 100% retained adhesion but a blister rating of 7F. Overall, the blends showed very good adhesion performance properties, before and after humidity exposure.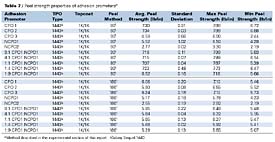
Gasoline Resistance Properties of CPO1/NCPO1 Blends
The gasoline resistance performance properties of the CPO1/NCPO1 blends, as determined by a modified Ford test method (Modified Juntunen), are shown in Table 6. NCPO1 gave the best overall gasoline resistance properties of the adhesion promoters tested (100% retained adhesion and no lifting of the coating systems after two hours). The gasoline resistance performance of CPO1/NCPO1 blends varied depending upon substrate and topcoat system. With the 1K/1K topcoat system, the blends that showed the best gasoline resistance performance were the 9:1, 4:1 and 1:4 blends. Each of these systems showed excellent adhesion of the coatings to the substrate with minor lifting of the coating at the edges of the crosshatch after 120 minutes of immersion. With the 2K/2K topcoat system, the blends that showed the best gasoline resistance performance were the 9:1 and 1:1 blends. Each of these systems showed 100% retained adhesion of the coating to the substrate with minor lifting of the coating at the edges of the crosshatch after 30 minutes of immersion. These blends also showed slightly better performance than CPO1 after 45 minutes of immersion. These results suggest that blends of CPO1/NCPO1 may be used to optimize gasoline resistance properties of CPO-based systems showing worse gasoline resistance properties. Results may be dependant upon several factors, including substrate, adhesion promoter resin system and topcoat system.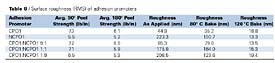
90o and 180o Peel Strength Studies
The 90o and 180o peel strength properties of the adhesion promoters, listed in Table 1, are shown in Table 7. Of the CPOs tested, CPO1 and CPO2 had the highest average 90o peel strengths. For the 90o method, CPO3 showed the lowest peel strength of the CPOs tested (approximately 2.7 lb/in less than CPO1 and CPO2). CPO3 also had low minimum peel strength in the 90o method, which suggests that the average peel strength reported may not be a representative number due to the irregularities in the peel strength curve (load vs. extension). For the 180o method, there were slight differences in the peel strengths of the CPOs tested. Interestingly, CPO3 showed better performance in the 180o method vs. the 90o method. The reasons for this phenomenon are not completely understood, although it is expected that the different forces applied to the substrate/adhesion promoter/topcoat systems in the different peel methods are likely to contribute to the differences. The composition of adhesion promoters may also play a role in these differences. For the NCPOs studied, NCPO1 showed the highest peel strength, which was approximately two times the peel strength of NCPO2 in both the 90o and 180o methods. Unlike the CPOs tested, NCPOs displayed very small differences in 90o and 180o peel strengths. When comparing CPOs with NCPOs, CPOs 1 and 2 have higher peel strengths than the best NCPO (NCPO1), but CPO3 has a lower 90o peel strength than NCPO1. The CPO1/NCPO1 blends show peel strengths approaching the peel strengths of CPOs 1 and 2 in both the 90o and 180o methods. Interestingly, even blends containing high levels of NCPO1 show peel strengths similar to CPOs 1 and 2. Overall, these results correlate well with adhesion and humidity testing, with the exception of CPO2 and NCPO1. CPO2 shows higher peel strengths, when compared to NCPO1, but NCPO1 outperforms CPO2 in adhesion testing after exposure to high temperature and humidity. These results suggest that the peel strength method is a good tool for screening adhesion promoters, but may not be indicative of overall adhesion performance as determined by ASTM D 3359B in conjunction with ASTM D 4585 (adhesion after high temperature and humidity exposure).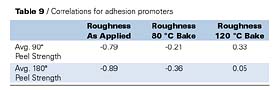
Microscopy Studies (CPO1, NCPO1, and CPO1/NCPO1 Blends)
Effect of Surface Roughness on Peel Strength Table 8 summarizes RMS surface roughness averages for adhesion promoters applied to Solvay Sequel 1440 TPO panels. Each roughness value represents the average of three randomly selected images, 25mm X 25mm.
For the adhesion promoters listed in Table 8, correlation analysis was used to explore relationships between peel strength and surface roughness of the adhesion promoter surfaces, as applied and after exposing the adhesion promoters to elevated temperatures (Table 9).
Table 9 shows a significant correlation between peel strength (for both 90o and 180o peel) and roughness as applied (air-dry). Peel strength and surface roughness, after the adhesion promoters were exposed to elevated temperatures, did not correlate very well. One possible reason for this observation may be due to the fact that the topcoat system is applied to the adhesion promoters before exposure to elevated temperatures, and this surface (i.e., the as applied surface) is expected to exert the greatest influence on the wetting and adhesion of the topcoat to the adhesion promoter surface, since this is the interfacial surface. Upon application of the topcoat, subsequent heating and curing may promote improved interaction between the adhesion promoter and the topcoat.
The high negative correlation between surface roughness as applied and peel strength indicates that peel strength decreases with increasing surface roughness as applied. Fuller and Tabor17 also demonstrated surface roughness effects on adhesion for rigid poly(methyl methacrylate) (PMMA) in contact with rubber surfaces.
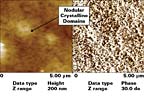
AFM-based height and phase images for CPO1 are shown in Figure 2. Such images indicate a high degree of crystallinity, as evidenced by the high brightness displayed by phase images. The left-side image in Figure 2 is a top view or height image that contains topographic information for CPO1 adhesion promoter, as applied on a TPO panel, while the right-side image is a phase image which shows the crystalline domains, (white features), in the form of nanometer-sized nodular domains on surfaces. This chlorinated polyolefin (CPO1) provides very good adhesion properties and had the highest peel strength of the adhesion promoters listed in Table 8. In comparison, AFM characterization of NCPO1, with the lowest peel strength of the adhesion promoters listed in Table 8, is shown in Figure 3. NCPO1 displays some spherulitic structures and remnants of lamellae, but mostly amorphous domains distributed over the surface.
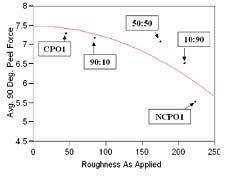
A plot of peel strength (90o peel force) vs. surface roughness is shown in Figure 4. Samples are identified according to the scheme shown in Table 8, and provide a graphical representation of the surface roughness effect, as applied, on peel strength. The equation shown in Figure 4 describes the observed relationship between peel strength (90o peel) and surface roughness, as applied, for the adhesion promoters listed in Table 8 (Rsquare = 0.72).
Effect of RMS Phase Imaging on Peel Strength
In order to explore possible roles played by surface crystallinity and/or surface amorphous content on peel strength, phase imaging was employed. Correlation analysis was used in order to explore possible relationships among peel strength, surface roughness and phase image contrast (crystallinity). Differential scanning calorimetry (DSC) based crystalline heat of fusion (DHf) measurements on adhesion promoter resins was also included in this analysis in order to provide an alternate measure of degree of crystallinity.
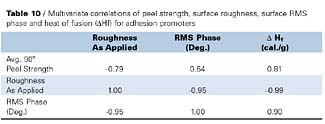
Table 10 provides further evidence for the importance of surface crystallinity, as measured by RMS phase, on peel strength by the positive correlation coefficient (0.64), however, crystalline heats of fusion provide the best correlation with peel strength (0.81). The importance of surface crystallinity on peel strength is further supported by the high correlation (0.90) that results between RMS phase and heat of fusion, as measured by DSC. Furthermore, the very high negative correlation (-0.99) between surface roughness and DHf, and high positive correlation (0.81) between DHf and peel strength, support the necessity for surface crystallinity for improved peel strength properties for this set of adhesion promoters (Table 8). Crystallinity effects on peel strength were also discussed by Aoki7, who studied epitaxial effects on bonding strengths between chlorinated isotactic polypropylene and isotactic polypropylene.
Conclusions
Results from this study show that, for the CPOs evaluated, CPO1 provided the best overall adhesion properties. CPOs 2 and 3 displayed good initial adhesion properties, but showed adhesion failure after exposure to high temperature and humidity conditions with the 1K/1K topcoat system. CPO4 showed poor (initial) adhesion performance with both topcoat systems and over both substrates. Results from gasoline resistance testing showed that CPO1 outperformed the other CPOs in all instances, most especially under the 1K/1K topcoat system. Since CPO1 is higher in molecular weight than all other CPOs tested and its chlorine content is similar to CPO2, it is reasonable to assume that the increased molecular weight allows for its improved performance. In general, increased chlorine content in CPOs improves their solubility in common coating solvents and gasoline. CPOs 2 and 3 show a good correlation of this effect when applied under the 2K/2K topcoat system. CPO4 displayed the worst gasoline resistance performance for the CPOs tested.For the NCPOs evaluated, NCPO 1 and NCPO2 provided good initial adhesion properties. The best overall adhesion performance was obtained with NCPO1. NCPO1 provided excellent adhesion of both coating systems, applied over both substrates, before and after exposure to high temperature and humidity conditions. NCPO2 displayed excellent adhesion performance, before and after humidity, with the 2K/2K topcoat system, but showed extensive adhesion failure under the 1K/1K topcoat system, after humidity (similar to the performance properties of CPO3). Results from gasoline resistance testing showed that NCPOs, in general, display better gasoline resistance properties than CPOs. The reason for this improved gasoline resistance property is most likely due to their lack of chlorine and perhaps structural differences. NCPO1 provided the best gasoline resistance properties of all adhesion promoters tested.
For the CPO1/NCPO1 blends evaluated, good adhesion properties were obtained with both topcoat systems applied to both TPO substrates, and at all ratios of CPO1 to NCPO1 tested. Since both CPO1 and NCPO1 show excellent adhesion results when used alone, this result was not unexpected. Gasoline resistance testing of blends showed that, in some instances, blends of CPO1 and NCPO1 improve results over those obtained with CPO1 alone. Results obtained with blends might be dependent upon several factors, including substrate composition, adhesion promoter resin system used, and topcoat system employed.
Peel strength studies showed that CPOs 1 and 2 provided the best 90o peel strengths. CPO3 exhibited the lowest 90o peel strength of the CPOs tested. Interestingly, CPO3 revealed better performance in the 180o method vs. the 90o method. The reasons for this phenomenon are not completely understood, but may be due to different applied forces between the 90o and 180o testing methods. The composition of the adhesion promoter may also play a role in the observed differences in performance. For the NCPOs tested, NCPO1 showed the highest peel strength, which was approximately two times the peel strength obtained for NCPO2. When comparing CPOs to NCPOs, CPOs 1 and 2 have higher peel strengths, both 90o and 180o, than NCPO1. However, CPO3 displays lower 90o peel strength than NCPO1. Interestingly, the CPO1/NCPO1 blends have peel strengths approaching those obtained with CPOs 1 and 2. Interestingly, blends containing higher levels of NCPO1 show similar peel strengths as CPOs 1 and 2. Overall, peel strength results correlate well with adhesion and humidity data, with exception to CPO2 and NCPO1. CPO2 shows higher peel strengths when compared to NCPO1, but NCPO1 outperforms CPO2 in adhesion and humidity testing. These results suggest that the peel strength method is a good screening tool for adhesion promoters, but may not be indicative of overall adhesion performance, especially after exposure to high temperature and humidity conditions.
Surface analysis of TPO coated with CPO1, NCPO1, and their blends (9:1, 1:1, and 1:9), after curing at various temperatures, by AFM, show a significant correlation between peel strength and surface roughness of the as applied adhesion promoters. Peel strength and surface roughness of the adhesion promoter surfaces, after exposed to elevated temperatures, did not correlate very well. One possible reason for this behavior may be due to the fact that the topcoat system is applied to the adhesion promoters before they are exposed to elevated temperatures. The adhesion promoter surface, as applied, is therefore expected to exert the greatest influence on wetting and adhesion of the topcoat to the adhesion promoter surface. Heating and curing the system after application of the topcoat system to the adhesion promoter may improve interaction between the adhesion promoter and the topcoat system (bonding, entanglement, interpenetration, etc.), which should improve peel strength. The high negative correlation between surface roughness, as applied, and peel strength indicates that peel strength decreases with increasing surface roughness.
Phase imaging and correlation analysis showed significant relationships between peel strength, surface roughness and crystallinity, as determined by both phase image contrast and DSC, for CPO1, NCPO1 and their blends. A significant positive correlation was observed between surface crystallinity and crystallinity, as determined by DSC, with peel strength for the adhesion promoters tested. The importance of crystallinity on peel strength is supported by the high correlation between surface crystallinity (RMS phase) and crystallinity determined by DSC (DHf). A high negative correlation was also observed between surface roughness and DHf, while a high positive correlation was observed between DHf and peel strength. These results suggest that surface crystallinity has a major influence on peel strength properties for the blends tested.
Acknowledgements
The author would like to acknowledge Kevin McCreight, Jamie Vaughn, Leslie Taylor, Jerry Mitchell, Chuck Freeman, Lisa Templeton, Jon Lawniczak, and Gary Robe for their contributions to this paper.For more information, contact Eastman Chemical Co., Lincoln Street, P.O. Box 1974, Kingsport, TN 37662; call 800/EASTMAN; or visit www.eastmancoatings.net.
This paper was presented at the International Coatings for Plastics Symposium, June 9-11, 2003, Troy, MI
References
1 Clemens, R.J.; Batts, G.N.; Lawniczak, J.E.; Middleton, K.P.; and Sass, C. "How do chlorinated poly(olefins) promote adhesion of coatings to poly(propylene)," Progress in Organic Coatings, 24, 43-54, (1994).2 Ryntz, R.A. "Chlorinated Polyolefin Adhesion Promotion: Effects Of Compositional Variations On Adhesion To TPO." 7th Annual ESD Advanced Coatings Conference (1997), pp. 135-144.
3 Ryntz, R.A.; Britz, D.; Mihora, D.M.; Pierce, R. "Measuring Adhesion to Poly(olefins): The Role of Adhesion Promoter and Substrate," Journal of Coatings Technology, Vol. 73, No. 921, October 2001.
4 Templeton, L.; Williams, K.A.; Lawniczak, J.E.; Callahan, M. Fifth International TPOs in Automotive 1998 Conference, Novi, MI, 1998.
5 Templeton, L. and Eagan, R. Proc. Sixth International TPOs in Automotive 1999 Conference, Novi, MI, 1999.
6 Ryntz, R.A. Adhesion To Plastics, Global Press, 1998.
7 Aoki, Y. "The Role of Crystallinity of Polymer in the Adhesion between Chlorinated Isotactic Polypropylene and Isotactic Polypropylene," Journal of Polymer Science, Part C, No. 23, pp. 855-864, (1968).
8 Ryntz, R.A. "The Effects Of Solvent and Thermal History On The Adhesion Of Coatings To Thermoplastic Olefins," Proc. of Waterborne, High-Solids, and Powder Coatings Symposium, pp. 514-534, February, 1995.
9 Land, J.M.; Arjona, M.C.; Dechent, W.L.; Stoffer, J.O. "Water-Based Polyester Coatings For Chlorinated Polyolefin Primed Polypropylene," Proc. of Waterborne, High-Solids, and Powder Coatings Symposium, pp. 397-407, February, 1996.
10 Mikulec, M. "Are the Low Viscosity Functional Olefinic Polymers Feasible as Components in Coatings to Adhere to Untreated TPO Substrates?" TPOs in Automotive 1996 Conference Proceedings, October 28-30, 1996.
11 Witzeman, J.S.; Scott, Q.L.; Greene, P.J.; Williams, K.A.; Poteat, S.L. "Aqueous Coating Composition", U.S. Patent 5,373,048, December, 1994.
12 Jackson, M.; Stubbs, F.; Mecozzi, J.; Miklos, D. "Chlorine-Free, Zero-VOC, Thermoset, Waterborne Adhesion Promoter For Thermoplastic Polyolefins (TPOs)," Third International TPOs in Automotive 1996 Conference, Novi, MI, 1996.
13 Hintze-Bruning, H.; Borgholte, H.; "Coating of Untreated Polypropylene With Halogen Free Aqueous Material," Progress in Organic Coatings, 40, (2000), pp.49-54.
14 Supplied by Buckmann GmBH, Monchengladbach, D-41238, Germany.
15 Kondos, D.; Mayo, M. "Quantitative Adhesion Testing of Reactor and Compounded TPOs II," Coatings for Plastic Conference, June, 2001.
16 McMaster, T.J.; Hobbs, J.K.; Barham, P.J.; Mileas, M.J. AFM Study of In Situ Real Time Polymer Crystallization and Spherulitic Structure, Probe Microscopy (1997), 1(1), 43-56.
Fuller, K.N.G. and Tabor, F.R.S. Proc. R. Soc. London, A: 345, 327-342 (1975).
Report Abusive Comment