
Coatings manufacturers use various methods for quality assurance/quality control or QA/QC. The devices are simple and low-cost. Data usually consists of one point, giving what essentially is a “go/no-go” test. However, greater competition in the markets, stricter customer demands for product tolerances and wider adherence to ISO (or other) standards, are driving the adoption of tests that provide more meaningful data at reasonable cost. Furthermore, the “one-point” tests are inherently limited, in that they cannot describe the material behavior over arangeof shear rates that may be essential for proper product performance. Many coatings, for example, are sprayed onto substrates – requiring very low viscosity at very high shear rates – but then must stay on the substrates without further dripping – requiring fast structural recovery and, therefore, high viscosity at essentially zero shear rate. Thus, an automated, multi-speed, rheological or viscometric test is appropriate. These concepts are discussed and a solution presented within this article.
Viscosity is the resistance to flow. A practical definition of rheology is the study of flow. Coatings’ viscosity and rheology are important in ensuring acceptable products. In this article, we present data from the analysis of three commercially available, white interior house paints. Shear rate is the rate at which a material is sheared, that is, a force is transmitted perpendicular to the direction of flow, because of friction transmitted between infinitesimally-thin layers of fluid. Shear rate is determined by a combination of (1) geometry and (2) testing or application speed.
Paint sitting undisturbed in a can, on a shelf, seems to be unsheared. That is, there seems to be no motion imposed upon that paint. Therefore, the shear rate is essentially zero, and the corresponding viscosity is the “zero-shear-rate” viscosity. Solids settling, due to gravity, may occur over time, however. It is desired to have a viscosity high enough, under these conditions, so that either settling does not occur or at least occurs extremely slowly. QA/QC measurements would take a very long time to obtain if they ran at nearly zero shear rates, so they are run at somewhat faster rates, instead.
House paint, applied to a vertical wall, for example, must:
- easily flow while being brushed onto the surface;
- level within seconds after being brushed on, to give a nice, smooth appearance; and
- stay on the surface without flowing off or dripping.
Rotational Viscometers
The data presented in this article were acquired withrotationalviscometers – that is, instruments using rotatingspindlescontacting the test liquids. Three different paints were tested and are referred to as #1, #3 and #5, respectively. Different instruments may have different geometries. A cone-and-plate or cone-plate viscometer is shown in Figure 1.This geometry allows convenient access to and cleaning of the sample, and requires a small volume of material, depending upon the cone spindle diameter and angle. Larger cones with lower angles provide more surface area in contact with the sample and, therefore, provide more sensitivity for lower viscosities. Smaller cones with larger angles allow more viscous – that is, higher-viscosity – liquids to be tested.
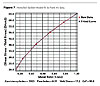
High-Shear-Rate Testing
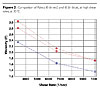
Data fromhigh-shear-ratetesting, usingcone-plategeometry, are presented in Figure 2. Each paint was tested with a Brookfield CAP 2000+L Viscometer, first by increasing and then by decreasing the shear rate. Paint #5 is significantly more viscous than Paint #3, over the speed range tested. Furthermore, there is morehysteresisin #5’s data. That is, the viscosities in the increasing-speed ramp lie higher than those in the decreasing-speed ramp. This indicatesthixotropy– the fluid’s structure takestimeto rebuild after being sheared. The data in Figure 2 are plotted as Poise (1 P is equal to 100 centipoises, or 100 cP) and, therefore, range from about 120 to 310 cP. Also, S.I. units users may note that 1 cP equals 1 mPa·s or milliPascal-second.
Moderate-Shear-Rate Testing
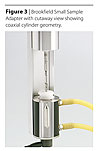
Another commonly used geometry iscoaxial- or concentric-cylinder. This is sometimes referred to as Couette or Searle geometry. Strictly speaking, Couette’s viscometer had a rotating outer cylinder with a stationary inner cylinder, and Searle’s instrument had a rotating inner cylinder with a stationary outer cylinder. This geometry is also convenient to use because it requires relatively low sample volumes, depending upon the spindle and sample chamber combination selected, and allows fairly easy sample access, as well. The Brookfield Small Sample Adapter system (Searle geometry), on a typical viscometer, is shown in Figure 3.Representative data for paints #5 and #1 are shown in Figure 4, at low to moderate shear rates, at 25 ºC, using the Brookfield Small Sample Adapter. The SC4-21 spindle was used with the SC4-13RPY chamber on a Brookfield RDVII+Pro Viscometer.
Low-Shear-Rate Testing
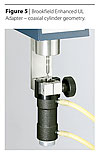
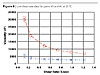
Larger-sized coaxial cylinder geometries are suitable for measuring low-viscosity materials, particularly at low to moderate speeds or shear rates. The Brookfield Enhanced UL Adapter (Searle geometry) is shown in Figure 5.Although not used as often, low shear rate data, such as those shown in Figure 6, may provide insights into behavior that may be similar to settling or leveling.
Paint #5 is not only more viscous than paint #1 at all shear rates, but it is several times more viscous at shear rates below 0.5 s-1, when tested with the Brookfield Enhanced UL Adapter on a Brookfield RVDV-III+ Rheometer. This may suggest possibly greater long-term stability and resistance to settling, while the canned product sits on the shelf.
This also suggests that another property may be worth investigating: the yield stress – that is, the stress required to make a solid material flow like a liquid. This solid-like behavior would provide even greater resistance to settling of suspended solids in a coating during storage. A number of mathematical models were developed over the years, to try to better fit data observed in various materials. Figure 7 shows the fit of the Herschel-Bulkley model to the data for Paint #5.
This equation is used to estimate the yield stress, based upon the flow curve; it is as follows:
(1)
where τ = shear stress, dyne/cm2,
η
= consistency index, cP,
g
· = shear rate, s-1; strictly
speaking, in this equation, (s-1)(1/n),
n = consistency index
τ0 = yield stress, dyne/cm2.
Readers probably noticed that Figure 2 data were taken at 20 °C, while other figures present data at 25 °C. This was done on purpose – so that we could remind our audience to always try to keep their temperatures consistent when comparing various coatings, because even a 5 °C increase in temperature may significantly reduce the viscosity of a given material under given shear rates.
In conclusion, testing your products over a range of shear rates (multiple speeds), rather than at one rate, will allow you to gain a better understanding of your material’s performance, whether it’s settling or being rapidly applied.
Acknowledgement
The author thanks George H. Aronson (Technician) and Ross Zinkowski (Summer Student – Engineering Intern) for performing the experiments and graphing the data.For more information, contact David J. Moonay, Ph.D., Sales Engineer – Rheology Laboratory Supervisor, at Brookfield Engineering Labs., Inc., 11 Commerce Blvd., Middleboro, MA, 02346; phone 508/946.6200, ext. 144; or visit www.brookfieldengineering.com.
Report Abusive Comment