
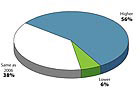
Figure 1. Projected operating level in 2007.
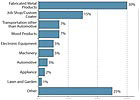
Figure 2. Primary product or service.
Cautious Optimism
Both the global and U.S. coatings industries are experiencing a reasonable level of growth. Datamonitor, a business information company specializing in industry analysis, reports that from 2001 to 2005 the value of the global paint and coatings market recorded a compound annual growth rate (CAGR) of 5.4%, going from a meager 2% growth rate in 2002 to 7.7% in 2005.1 Datamonitor also says that the current rate of growth in the global industry is expected to continue with a projected CAGR of 5.7%. In comparison, Datamonitor reported that the U.S. market experienced a CAGR of 4.5% over the same period but is projected to experience only a CAGR of 1.8% during the 2005 to 2010 period. It is also interesting to note that the Asia-Pacific countries now constitute the largest paint and coatings market in the world, with a 34.9% share of the global market. In comparison, the value of the U.S. paint and coatings market now constitutes only 26.8% of global market value, barely ahead of Europe, at 26.1%.2 Clearly, the U.S. has lost the lead in the global paint and coatings market.Still, 2006 was a year when respondents appeared to be feeling a cautious optimism. Among respondents in the coatings market, 56% feel that their operating levels in 2007 will be higher than in 2006 and 38% felt that 2007 levels will be the same, with only 6% expecting a decrease (see Figure 1). This is a somewhat rosier view than in last year’s survey, when only 47% of respondents were expecting higher levels in 2006, while 10% were forecasting lower operating levels.
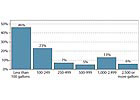
Figure 3. Monthly liquid paint use.
Don Mihalik, executive vice president of sales for Kalcor Coatings, said that he believes the coatings markets served by his company are currently solid. “There’s some good potential out there. The customers that we’re dealing with are very active, and they’re saying that they are having a hard time keeping up with their production.”
Burton Windeknecht, technical vice president for Becker Powder Coatings, expressed a mixture of optimism and pessimism. “I think most powder coating manufacturers have gotten themselves into the position where they can survive in the environment that we’re in now. That’s depending on raw material stability, and that is a big, big concern these days,” he said.
Lou Floyd, an industry expert and consultant said, “U.S. companies are being progressively taken over by foreign companies, so the prospects for U.S.-owned companies are getting slimmer and slimmer.”
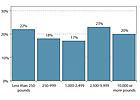
Figure 4. Monthly powder use.
Company Size and Focus
The “typical” finishing operation in 2006 remained relatively small, with just under a quarter of the respondents reporting that their company employs 19 people or less, and over half of the respondents (54%) reporting that their company employs fewer than 100.Forty percent of the respondents also described their coatings operations as occupying less than 5000 ft2 (approximately 70 x 70 ft), and just over two-thirds (67%) of the respondents said that their finishing operations directly involved 10 or less operations and supervisory personnel. As far as the primary product or service provided by the respondents’ companies is concerned, fabricated metal products once again topped the list, with 30% of respondents (versus 31% for 2005) (see Figure 2).
Twenty-five percent of respondents described their company’s product or service as “other,” a category that comprised an interesting range of coated products, including aerospace hardware, agricultural, cellophane, football/baseball helmets, newspapers and survey equipment. Just under half (46%) of the respondents reported that their companies used less than 100 gal per month of liquid coatings, while 41% said they used less than 1000 lbs of powder coatings per month (see Figures 3 and 4). The average monthly usage of liquid coatings seems to be increasing slightly, from 751 gal in 2005 to 926 gal in 2006, and the average monthly usage of powder coatings increased from 4697 lbs in 2005 to 5132 lbs in 2006.
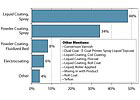
Figure 5. Primary coating used.
Of this group, 83% said they purchased solvents for addition to the coatings (probably to adjust characteristics such as viscosity, drying time or appearance), while 61% said they purchased additives (probably to adjust performance characteristics such as flow, adhesion, lubricity and abrasion resistance). Fifty percent said that they purchased pigments, possibly for color adjustment or for the addition of special effects, such as sparkle, matting or holographic color shifts.
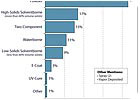
Figure 6. All coating types used.
Coating Types and Technologies
When respondents were asked what the primary coating used in their facility was, the results were surprising. The number of respondents reporting liquid coatings as their facility’s primary coating rose, from 43% to 48%, while the number of respondents reporting powder coatings dropped from 49% to 42% (see Figure 5). This trend was also seen when respondents were asked about all the coatings types used in their facilities: 51% percent reported using powder coatings in 2005 as opposed to only 43% in 2006 (see Figure 6).Could these data mean that the usage of powder coatings has peaked? When asked if one technology is gaining over the others, Mike Tonn, technical sales representative for Hentzen Coatings, said, “During the ’90s, there was a lot of conversion from liquid to powder. Now, I am seeing somewhat of a reversal of that trend in some cases, where companies are going back to liquids because of things that the powder coatings aren’t able to accomplish.”
Vince Genova, technical director for Kalcor Coatings, noted that the choice of one coating over another is primarily being driven by economics, particularly in the automotive/transporation industry. “We’re not seeing as much technical growth in some markets as we have seen in the past,” he said. “The transportation industry isn't looking to spend money, so they’re not looking at any new innovations. They’re trying to save money, going the other way, if anything.”

Figure 7. Substrates currently being coated.
Finally 62% of respondents reported poor performance as the primary obstacle to the use of waterborne technologies, indicating that waterborne technologies, while environmentally friendly, may still have a ways to go in matching the performance of other coatings technologies.
When asked what the main technological issue was for water-based coatings, Lou Floyd replied “Probably appearance. It’s very, very difficult to get the kind of incredibly high gloss that a lot of industrial marketers want out of a water-based coating. You can get reasonably glossy finishes but not showroom mirror finishes. That still requires other technologies, and other technologies dominate as a result.” When asked, however, about other performance issues, such as the protection of the substrate, Floyd replied, “I think water-based technologies have done a tremendous job in catching up on that particular score. Today, unlike even 10 or 15 years ago, a water-based coating can be every bit as protective of the substrate as any other kind of coating.”
The trends concerning the substrates being coated showed a mixed bag, with losses in ferrous metals (67% to 61%) and plastics (6% to 3%) being balanced by gains in nonferrous metals (22% to 25%), wood (4% to 9%), and “other” (1% to 2%) (see Figure 7).
When Mike Tonn was asked what he felt the “growth” substrates would be for liquid and powder coatings over the next 10 years, he replied, “For both of them, but especially for powder, [applications on] plastics, woods, and non-conductive materials are certainly going to grow. In the field of metals, you’ll see the non-ferrous metals grow quite a bit.”
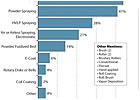
Figure 8. Application method used at a given location.
Application Methods and Equipment
When survey respondents were asked which coatings application methods they were using, air or airless spraying topped the list at 44%, followed by powder spraying at 41%, high-volume low-pressure (HVLP) spraying at 28%, and air or airless spraying, electrostatic at 21% (see Figure 8).Some surprises were seen in that the percent of locations using powder spraying dropped from 54% in 2005 to 41% this year, and the percent of locations using e-coating also dropped significantly, from 9 to 6%. Conversely, HVLP coating registered a modest increase, from 24% of the locations to 28%. Automation of coatings operations has perhaps reached a saturation point, as the percent of locations using manual only (hand-held), automatic only, and a combination of manual and handheld stayed almost exactly the same as last year, as seen in Figure 9.
The average liquid application equipment setup may be aging slightly, as the majority of respondents reported their equipment to be 6 to 10 years old (see Figure 10), as opposed to 3 to 5 years old last year. At the same time, respondents appeared to be replacing some of their oldest equipment, as the percent of coaters with liquid application equipment less than 3 years old increased by 2% while the percent with equipment greater than 10 years old decreased by the same amount. This could imply an average liquid application setup lifetime of around 10 years. The trend in the average age of powder coating equipment was a little less clear-cut, but a 4% increase in equipment less than 3 years old was balanced by an equal decrease in equipment 3 to 5 years old, which may, again, be indicative of funds being spent to purchase new powder coating equipment.
When asked about next year’s purchases of finishing equipment, over half the survey respondents said that their company’s expenditures would remain the same, while 34% of the respondents expected their company’s expenditures to increase. Only 9% expected them to decrease.
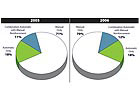
Figure 9. Equipment type.
Finally, respondents were asked how they expected to justify their expenditures on equipment - i.e., by spending money on new equipment, what costs did they expect to reduce? The top answer at 58% was to reduce the amount of scrap and rework. The second-place answer was to reduce the amount of direct labor used (55%), the third-place answer at 41% was to reduce indirect labor costs, and the fourth-place answer at 40% was to reduce material costs.
Interestingly, more than 50% of the respondents said they planned to begin using, increase their use of, or maintain their use of custom coaters, which would indicate that the overall usage of custom coaters is increasing. This increase in the usage of custom coaters perhaps again shows the trend for manufacturers to concentrate on their core competencies, such as product design and marketing, while outsourcing non-core operations like finishing to outside vendors.
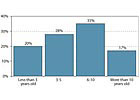
Figure 10. Average age of liquid application equipment
Industry Challenges
When the interviewees were asked about the biggest challenge or opportunity facing the coatings industry today, rising raw material prices were a major concern. Mike Tonn said, “The greatest challenge that we have is with the escalating cost of raw materials. We have to find ways to increase our internal efficiencies so we can offset the cost of raw material increases, eliminating or minimizing margin erosion without having to pass on huge price increases to our customers.”Don Mihalik agreed that the current high raw material pricing is a challenge, saying that “it’s really hurting us, because a lot of our customers just refuse to accept price increases.”
David L. Westerman Sr., vice president of Carbit Paint also concurred. “We have experienced steady raw material cost inflation over the past 24 months,” he said. Westerman went on to say, however, that he believes “the greatest challenge for the coating industry is the trend for industry to introduce substitute materials that do not require coatings,” such as colored plastics, vinyl, etc.
Burton Windeknecht said that the trend to move manufacturing from here in the U.S. to other countries “has stagnated the price of powder coatings,” and that the biggest challenge to the U.S. powder coatings industry is going to be “keeping the market here in the United States.” He went on to say that “being able to make powder coatings and operate profitably here in the U.S. is going to be a challenge in the future.”
For some companies, such as Kalcor, the answer has been to focus more on exports and on establishing partnerships with companies in regions such as China, Japan and Europe. Other companies are relying primarily on innovation to distinguish themselves in the global marketplace. But as Cory Zucker, vice president of manufacturing for Kalcor Coatings, noted, companies that are willing to invest in new products and technologies are becoming increasingly scarce. “There’s always a lot of interest and buzz, but few companies are willing to make the necessary investments,” he said. “The industry needs leaders that will raise the bar for coatings technologies by investing in capital equipment and better products.”
Our survey showed an interesting mix of optimism and concern about the future. Globalization continues, with the global paint and coatings market shifting toward the Asia-Pacific countries and away from the U.S. At the same time, raw material costs continue to escalate, placing manufacturers in an ever-tightening bind. Clearly, the winners in the finishing market will be those companies that do the best job of controlling raw material costs, increasing manufacturing efficiencies, and giving customers the best value for their dollar.
Finishing Today's complete 20th Annual Finishing Market Study will be available for sale beginning in February 2007. For more information, contact Clear Seas Research at 248.786.1625 or e-mailbaizn@clearseasresearch.com.
Report Abusive Comment