


When developing and introducing new technology, customers expect supporting data on how to best use new products. The question is always, “How can the product be formulated to best take advantage of its features?” Since time and resources are always limiting factors, statistical design of experiments (DOE) is a useful tool in this characterization work as it provides a focused approach to generating significant studies in a timely fashion. In this article, the use of DOE from a coatings formulator’s perspective is presented, and advantages and myths surrounding the approach, along with real-world examples, are discussed.
Forbo manufactures vinyl acetate ethylene latex, acrylic latex and vinyl acrylic latex. Markets for these latexes include architectural coatings, construction and adhesives. A new product is ELVACE® 750, a high solids, non-APEO, ultralow-VOC-capable, no-formaldehyde-added vinyl acetate ethylene latex for flat and semigloss coatings. Statistical design of experiments was used extensively to develop formulation guidelines for this product.
Statistical DOE
To most coatings formulators, statistical design of experiments is an interesting approach to testing, but the feeling is that it’s not applicable to their jobs. It’s something that is more likely to be used in high technology areas, like polymer synthesis. But what is the real definition and use of design of experiments? Mark Anderson and Pat Whitcomb from StatEase provided the following definition in their publication, DOE Simplified: Practical Tools for Effective Experimentation, Productivity, Inc., 2000.“Design of experiments (DOE) is a planned approach for determining cause and effect relationships. It can be applied to any process with measurable inputs and outputs.
”This simple explanation doesn’t say anything about coatings, but one can apply the various parts of the definition. First, there’s the “planned approach.” Coatings formulators always have a plan when starting a new project, whether it’s a quick, competitive study or an extensive reformulation project. Next, there’s “cause and effect.” When doing a project, the formulator is always looking at cause and effect: if this ingredient is changed, how does that effect the performance of the paint system? Finally, there’s measurable inputs and outputs. A paint formulation certainly has measurable inputs – raw materials and amounts are an obvious example. The measurable outputs are performance parameters, be it scrub resistance, gloss, salt spray resistance, dry time, oven stability and so forth. Thus, by definition, DOE should be a viable formulating tool for the coatings chemist.
Ladders and Scaffolds
DOE has been dismissed by some as a “glorified ladder study.” This is basically a way to hold onto the traditional, one-factor-at-a-time (OFAT) approach to testing that was often taught to the paint chemist from the first day in the lab. DOE can be compared to a ladder in the same way a scaffold can be compared to that same ladder.
Imagine painting a large run of wall with a ladder (OFAT) versus a scaffold (DOE). With the ladder, the painter has limited reach – basically an arm’s length in either direction. With a scaffold, that same painter has a broader, more stable reach. For the paint chemist, results from an OFAT study can be a reach, just like getting that extra inch of wall from a ladder. Every chemist can remember at least one study where an experimental result was achieved, never to be repeated. DOE, like the scaffold, gives a firmer base. DOE studies look at several factors at once. Additionally, mix designs and even factorial designs require replicates to establish error and fit.
Interactions of factors are seen in DOE; viewing those interactions is not possible with the OFAT/ladder study. And in DOE, erroneous results are either discounted as not being statistically significant, or are readily visible as outliers in the resulting analysis. Thus the base for conclusions and further work is much broader and more stable. On the cautionary side, like a scaffold, considerably more care is required to set up a DOE than an OFAT study. The various pertinent factors and ranges need to be considered carefully, calling on the chemist’s experience with the technology. A poorly designed DOE can lead to meaningless, or worse, erroneous, results, just like a poorly assembled scaffold can lead to disaster.
DOE Myths
There are many myths surrounding the use of DOE in coatings applications. A few of the more common are investigated below.
Myth #1: Extensive statistical knowledge is required to use DOE.This may have been true in the pre-computer age, but modern software is very user friendly, even for those with little or no knowledge of statistics. Basically, the programs will crunch the numbers, determine significance and present results.
Myth #2: DOE requires too many samples.Typically, a DOE study will require more samples initially. But if the formulator is looking at a complex formulation issue, the number of samples in a DOE is typically less than that required in a one-factor-at-a-time approach. Plus, DOE offers the capability, especially in factorial designs, to run fewer samples than statistically specified and still provide meaningful results.
Myth #3: Testing needs to be precise to the fourth decimal place.Precision and accuracy in testing based on sound lab methodology and execution is always good. However, DOE works as well on visual ratings (scale of 1 to 10) as it does on a 4-decimal place property. The software will calculate the significance of a given property, and provide input if a data point is an outlier.
Myth #4: One DOE will solve all my problems.Large DOEs can be all-encompassing, but they are also more difficult to manage. Logistically, timing of tests and the sheer volume of samples can be daunting and a source of error. It’s best to address a large, complex technical issue with smaller, more manageable DOE studies. Like OFAT, another DOE may be required to address the results seen in the first DOE. Going back to the ladder-scaffold scenario, a scaffold covers more ground, but to paint a large wall, it still has to be moved.
Myth #5: DOE works better for the “any area but mine” part of the business. Synthesis people will often say that application work is more DOE friendly. Applications people say that DOE is way too technical, best left to the synthesis folks. Or they’ll say it is more adaptable to the process side of the business. In Forbo’s development process, DOE has been used with success in both the synthesis side of the business to optimize new latex formulas and the applications side for formulation optimization and to troubleshoot performance issues. Going back to the definition of DOE, paraphrased from Anderson and Whitcomb, it can be used in any area where you have a planned approach to study cause and effect relationships with measurable inputs and outputs.
DOEs: When and What Kind?
A perplexing issue for many chemists that are new to statistical design of experiments is when to use DOE, and what type to use. A statistician will tell you the only type of DOE that’s worthwhile for a coatings system is a mix design. While mix designs are very useful in coatings formulation, there are also some excellent applications for factorial designs as well. For the beginner, there are three basic DOE formats to consider: 1) factorial designs; 2) mix designs and 3) response surface methods (RSM) designs. Factorial designs are the most basic of designs and are primarily for screening. The simplest factorial design is a 2-level factorial. This is for screening many different items. A general factorial is also a screening tool. However, it is used after you’ve determined the most significant factors. Full factorial designs allow the user to zero in on an area, or factors, of interest. These designs are very useful to the coatings formulator for screening things like new coalescents, new surfactants, ingredient levels and so forth.
The next type of design commonly used in paint formulating is the mix design to optimize the system. Mix designs look at key ingredients and their percentage in the formulation. The total of the mix always equals 100%, but can be expressed in terms of percentages, weights or volumes. Mix designs include replicates and typically look for curvature and a fit in the data. Frequently the results are expressed as a quadratic or even cubic model.
Finally, there are RSM designs. These are used mostly for optimizing processes. In terms of setting up an RSM, they are a basically a factorial design on “steroids.” They include replicates and more center points. The purpose of the RSM designs over a straight factorial is that it shows curvature of the data.
General Factorial Design
Factorial designs are excellent for screening new raw materials in coatings formulations. An example is a coalescent study that was run in a semigloss paint based on ELVACE 750. The purpose was to evaluate some of the new ultralow zero-VOC coalescents versus the industry-standard coalescent, Texanol. AMP 95 and AEPD VOX 1000 from Dow/Angus were also evaluated in the study. Finally, different coalescent levels were investigated. The factorial design was set up as follows:
Factor 1: Coalescent Type
Texanol (TMB) Eastman
Velate 375 (Coal-1) Eastman (formerly Genovique)
Loxanol EFC-200 (Bio-1) BASF (formerly Cognis)
Chimista LC-200 (Bio-2) Chimista
Oxicure 1000 (Bio-3) Cargill
Note that each of these coalescents represents a “level” under Factor 1.
Factor 2: Coalescent Level (% on latex solids)
2%
4%
Factor 3: Amine Type
AMP 95 Dow/Angus
AEPD VOX 1000 (Bio-3) Dow/Angus
The number of samples was basically 5 levels for Factor 1 times 2 levels for Factor 2 times 2 levels for Factor 3: 5 x 2 x 2 = 20 total paint samples. Several properties were checked: viscosity, gloss, burnishing, block resistance, cleansability and low-temperature touchup were all highlighted in the original project presentation. An advantage to design of experiments for the paint chemist is that once the paints are made, you can run and analyze as many tests as you need or have an interest in.
Results are analyzed by the design program. In factorial designs, interactions are the “gold standard” – where the best information about your systems is obtained. An interaction is where the results behave differently than expectations, or the lines of the results graph either diverge or cross. Interactions would be difficult, if not impossible, to spot with the one-factor-at-a-time methodology.
Interactions
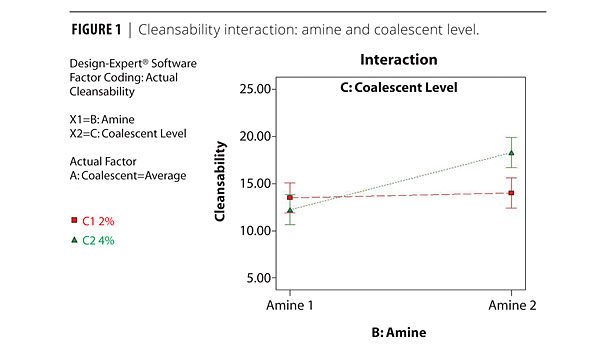
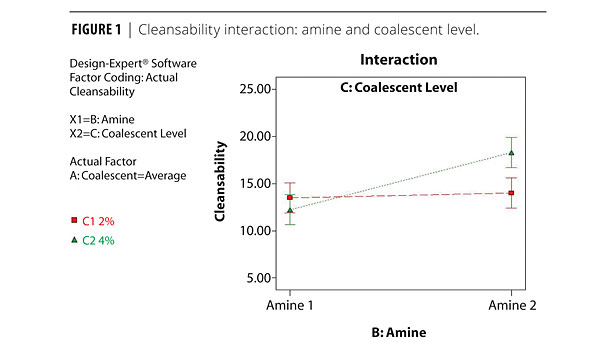
An interaction was seen in the semigloss coalescent study in the cleansability property. Cleansability is run per the Master Painters Institute (MPI) method, where aggregate color change from the removal of five stains (ketchup, mustard, hot coffee, red wine and powdered graphite) is measured. The interaction graph is shown in Figure 1.
As seen, the cleansability is lower with Amine 1 (AMP 95) at a 4% coalescent level, although it is fairly close to the 2% level (red square). Interestingly, with Amine 2 (AEPD), the cleansability color change is considerably greater, while the 2% coalescent level is constant with both amines at 2% coalescent. If the chemist were going to use Amine 2, cleansability would be optimum at 2%. The data shows that Amine 1 is more tolerant of different coalescent levels, with cleansability being essentially equivalent at either level.
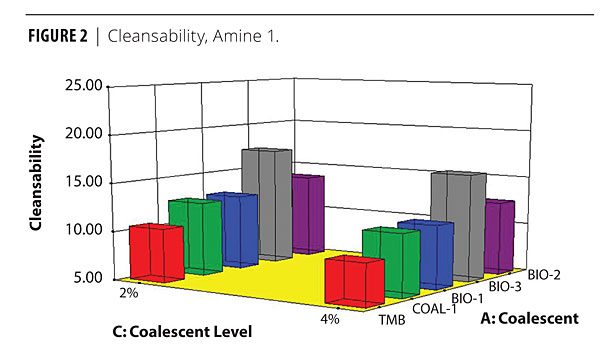
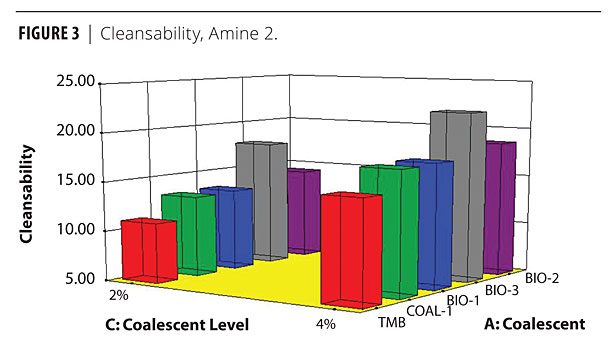
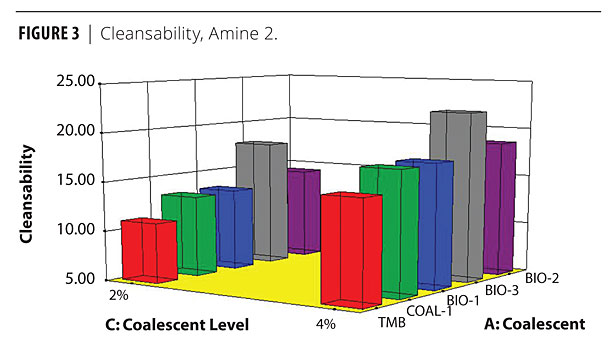
Figures 2 and 3 show the actual bar graphs of this data. The cleansability results with Amine 1 (Figure 2) are practically equivalent at both levels. It is evident from Figure 3 that the 4% level cleansability results are consistently higher (worse) than the 2% level.
Significant Factors
In addition to the interaction, the data also showed that coalescent type (Factor A) was significant in the cleansability property. TMB is generally the best, regardless of amine or coalescent level. The Coal-1 (Velate 375) and Bio-1 (Loxanol EFC-200) are very close to the TMB in cleansability performance. Note that in this particular property, lower values are preferred.
The analysis of factors shown in Figures 2 and 3 for cleansability was also run for other key properties, like viscosity, gloss, block resistance and low-temperature touchup.
Optimization
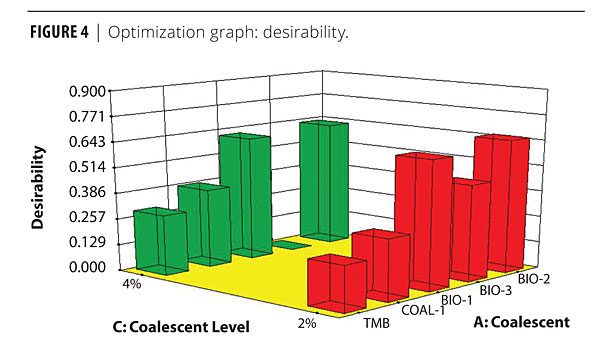
The design program has an optimization section that allows the user to input parameters, like maximize gloss, minimize DE for cleansability, maximize block resistance, minimize VOC, and so forth. The program will then provide a list of options with a desirability factor. A desirability factor of 1.0 indicates that all of the user-specified parameters have been met. The program will generate a table of factors, as well as illustrate those factors graphically. An optimization graph with one of the more desirable compositions is shown in Figure 4.
The useful information for the paint chemist in this work is that the two bio-coalescents, Bio-1 (EFC-200) and Bio-2 (LC-200), look very good overall with the ELVACE 750 latex in a semigloss formulation.
Finally, a chemist can compare the optimum sample(s) to a control sample outside of the DOE. This could be a commercial paint, a competitive product, or simply the existing formulation. In the case of this semigloss coalescent DOE, we used a coalescent-free, zero-VOC paint to see how the optimum coalescent package faired. The results are shown in Table 1. It is clear that, while a decent paint can be made with ELVACE 750 using no coalescent, there are advantages to using an ultralow-VOC bio-coalescent like EFC-200.
As the data shows, DOE can be a powerful tool for screening a variety of coatings ingredients; in this case coalescents.
Mix Designs
Mix designs are more complicated and require a little more planning in their setup. The following example is from a pigment study that was run with ELVACE 750 in semigloss systems. The purpose of the study was to look at various extenders to see which gave the best overall properties. This could be termed a trouble-shooting study, in that a specific goal was to minimize gloss burnishing and color float in the formulation. The fine-particle-size clay extender, Polygloss 90, gave excellent block resistance, cleansability and color float, but tended to burnish. The question was whether a finer-particle-size calcium carbonate (Hubercarb G-3) or finer-particle-size grades of nepheline syenite (Minex 7 and 10) could improve the burnishing as either a substitute or in combination with the fine-particle-size clay.
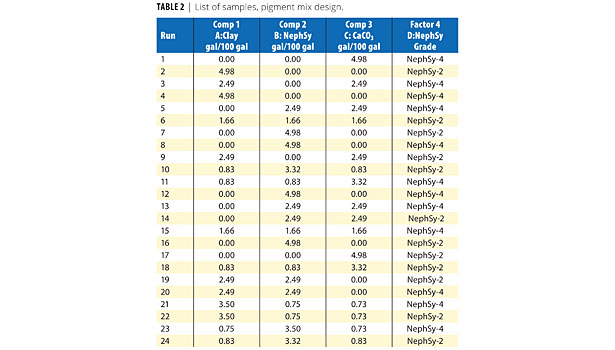
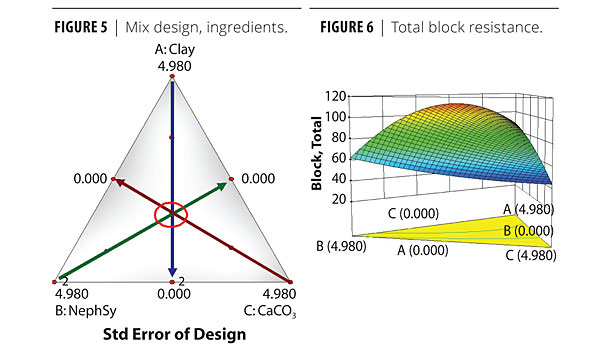
The approach for this study was a combination design – optimal mixture with factorial. The factorial was Minex selection – 7 versus 10. A 30% PVC paint formulation was used; the total amount of extender in that paint formulation was 4.98 gal/100 gal of finished paint. It was decided that each pigment would be checked from a level of 0 gal/100 gal to 4.98 gal /100 gal. Inputting these requirements into the DOE software provided the list of samples seen in Table 2. Examine the list of samples carefully and you will note several repeats, samples with 100% (4.98 gal) of each pigment, and several different combinations or blends of pigments. Once the concept of the study is conceived, the software generates a list of samples, such as the one in Table 2, in seconds. The study and samples can be illustrated graphically with a triangle plot, as seen in Figure 5. The arrows show the progression from 4.98 gal (100% of one pigment) to 0 gal. Where the arrows intersect in the middle of the triangle is 1.33/1.33/1.33 gal of each pigment. In Figure 5, this point is circled. This would correspond to Runs #6 (Minex 10) and #15 (Minex 7).
Responses
Four responses are featured for this article – cleansability, block resistance, burnishing and color float. Several more tests were run, but these gave the best example of using mix designs to optimize and troubleshoot paint formulations. All four of these properties were significant in their results. An example of the output on each property is shown in the block resistance results in Figure 6. The results are a sum of 16 different block resistance readings, under various conditions, dry times, dwell times and block temperatures. A is Polygloss 90 clay, B is nepheline syenite (either Minex 7 or 10, both performed the same) and C is Hubercarb G-3 (calcium carbonate). The orange section shows the best block resistance on the line between A (clay) and B (nepheline syenite). The dark blue section is the worst block resistance, between calcium carbonate and nepheline syenite, as well as between clay and calcium carbonate.
Similar outputs were seen with the other properties in the study. Overall, the data showed that the clay/Minex blends had the best block resistance. Increasing clay in the system provided significant improvements in color float. Conversely, by decreasing clay and increasing either calcium carbonate or Minex, or both, burnish resistance was greatly improved. Finally, straight clay gave the best cleansability, but the clay/Minex blends were also respectable. Calcium carbonate and blends with high levels of calcium carbonate had the worst cleansability.
Optimization
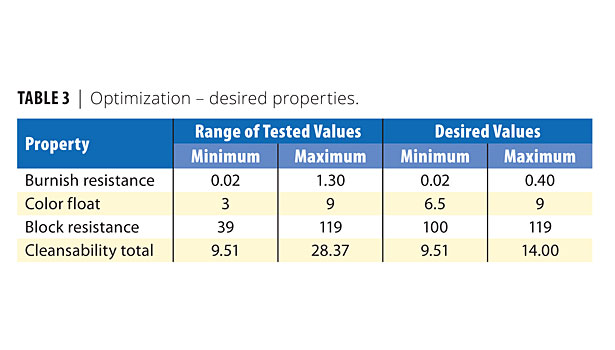
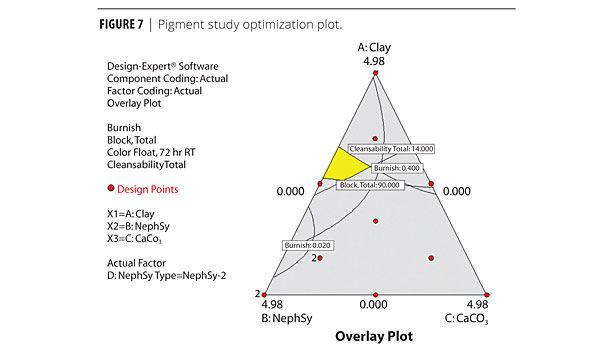
Even with four properties, this could be a lot of data to interpret – although the design software, as seen in Figure 6, makes interpretation easy. But the software, through the optimization segment, allows the paint chemist to see an optimum composition that would conform to specified parameters. Table 3 shows the range of parameters, along with the desired properties or values, from this pigment mix design.
The results are illustrated graphically in Figure 7. The yellow highlighted area is the area that meets the desired values – the “sweet spot.” Figure 8 shows how the chemist can point to a certain area of the highlighted, optimum region and “plant” a flag. The flag will give the actual composition, as well as the desired properties. A quick look at the properties in Figure 8 shows that they are within the desired requirements in Table 3.
The results showed an optimum mix for the semigloss formulations. There was no significant difference in performance between Minex 7 and Minex 10 (fine and finer-particle-size nepheline syenites). Clay, perhaps due to its oil absorption, was excellent for color float. Conversely, the Minex and calcium carbonate, theoretically due to their round as opposed to platy morphology, were much better for burnish resistance. The optimum formulation from above was re-made and tested, to confirm successfully the results of the mix DOE.
Conclusions
These two projects show some typical paint studies that can be run very effectively and efficiently using statistical design of experiments. Extensive results are obtained using a relatively small number of samples. As presented, factorial designs can be used to screen a significant number of coalescents, and a mix design can be used to troubleshoot and optimize certain paint performance parameters. Modern software – StatEase’s DesignExpert 8.0 was used in this work – makes setting up, analyzing and optimizing data very easy. While using the software does not require extensive statistical knowledge, the coatings chemist may find that the more they use it, the more they will want to learn more about the statistical side of DOE.
Acknowledgements
The author would like to acknowledge the management of Forbo Bonding Systems, Synthetic Polymers for allowing this work to be presented. Special thanks to my colleagues at Forbo who supported this project: Rich Vetterl, Shawn Daniel, Tim Tegen, Janice Mayer, Mike Brown and Ashley Hebert.
Forbo Presentations
Forbo’s coatings group uses statistical design of experiments extensively for coatings development and commercialization efforts. Several papers and presentations, including more in-depth versions of the two cited in this paper, have been presented. These are available to readers: please contact Rick Caldwell at rick.caldwell@forbo.com for copies.
References
1 Anderson, M.J. and Whitcomb, P.J. DOE Simplified. Practical Tools for Effective Experimentation, Productivity Press, 2000.
2 Werner, R. Effect of Extenders with Narrow and Broad Particle Size Distributions on the Properties of Coatings, pp. 71-76, Journal of Coatings Technology, Vol. 72, No. 903, April 2000.
3 Hare, C.H. and Kurnas, J.S. Reduced PVC and the Design of Metal Primers, Journal of Coatings Technology, Vol. 72, No. 910, November 2000.
4 Dietz, P.F. The Effect of Fine-Particle-Size Extenders and Entrapped Air on TiO2 in Emulsion Paints, Paint & Coatings Industry Magazine, September 2003.
5 Asbeck, W.K. Critical Pigment Volume Concentration Measurement – A Very Fast Method, pp. 64-66, JCT Coatings Tech, Vol. 2, No. 14, March 2005.
6 Broome, T.T. Approaches to Formulating Interior Latex Paints for the Southeastern U.S., Paint & Coatings IndustryMagazine, February 2008.
7 Hare, C. and Beck, R. “Extenders,” http://www.nycominerals.com
8 Kaolin Clay for Industrial Specialties, Kamin LLC, 2008.
9 Paint and Coatings Dictionary, Federation of Societies for Coatings Technology, 1978.


Report Abusive Comment