


Temperature Importance
Material weathering is primarily caused by the stresses of solar irradiation, temperature and humidity. Although solar radiation (primarily UV wavelengths between 300-400 nm) is the primary initiator of most chemical reactions, sample temperature is often a controlling factor. The effect of sample temperature on degradation rate can be quantified through the Arrhenius equation:
(1)
Where Kd = rate constant of chemical reaction;
E = activation energy;
A = reaction constant relating to material properties and test conditions;
K = Boltzmann constant; and
T = absolute temperature.
This equation shows that the temperature is the critical parameter in determining material degradation rate. The actual sample temperature varies during a weathering test, primarily due to the emissivity or solar absorptivity, and surface thermal conductivity of the sample. Variations in temperature among samples of different colors or materials can be significant. For example, aluminum panels with various colored organic paints undergoing simultaneous weathering tests showed temperature variations of up to 25 ºC.2 Such observations can compromise the validity of many service-life predictions that rely on an accelerated test.
A large portion of absorbed radiation is converted to heat, and the amount absorbed is also loosely linked to color, with white materials absorbing only about 20% of the visible light and black about 90%. Thus, the darker the color, the higher the temperature. Surface temperatures of exposed plastic specimens can reach 77 ºC,3 and specimens inside a closed automobile exposed to sunlight can reach 120 ºC.4
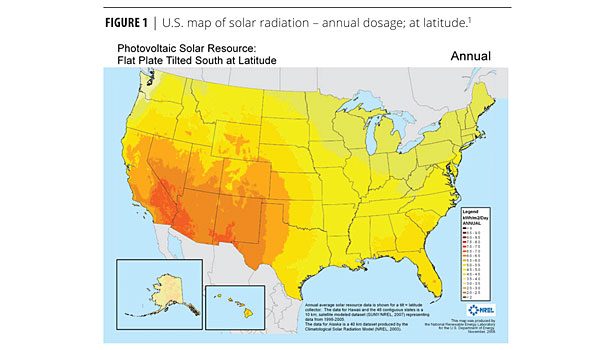
Elevated temperatures can significantly influence the destructive effects of light on polymeric materials by accelerating the rate of the secondary reactions and by altering the reaction processes following the primary photochemical step of bond breakage. For example, the increase of the oxygen diffusion rate and the reduced probability of recombination of free radicals can alter the main degradation mechanism. Therefore, temperature differences in the earth’s various climatic zones are responsible to a large extent for the variations in weathering, regardless of the amount of solar radiation received annually (Figures 1 and 2). As an example, the higher, cooler altitudes of central New Mexico receive very high levels of UV radiation but, generally speaking, will not degrade materials as fast as the weathering benchmark climate of southern Arizona.
Because of differences among materials in the effect of temperature on the secondary reactions, the stability ranking of materials can change with an increase in temperature.
Although daily averages and air temperature extremes are measured to quantify temperature conditions during specimen exposure to natural weathering, the temperatures that materials attain are higher than those of the surrounding atmosphere.
Temperature differences between the surface and bulk of polymeric materials due to the low thermal conductivity and heat capacity of these materials cause physical stresses. Daily and seasonal temperature cycling can cause mechanical stress in composite systems, such as between a coating and a substrate or between coating layers, because of a mismatch in the thermal expansion coefficients. This difference often results in cracking and loss of coating adhesion. Temperature and its cycles also affect the weathering of polymeric materials through influence on the effect of moisture. An increase in temperature accelerates hydrolysis reactions, while a reduction in temperature results in condensation as dew on the material. Freeze/thaw cycling or thermal shocks due to cool rain hitting hot, dry surfaces induces mechanical stress, which can cause structural failures in some systems, or accelerate degradation that has already been initiated.
It is often not practical to measure the surface temperature of individual test specimens due to (a) the location of the exposed specimen with respect to available data-acquisition systems and/or (b) the expense and labor to mount temperature-sensing elements to each panel. Therefore, black panel and white panel temperature sensors are used to represent maximum and minimum temperatures, respectively, attained by samples.
Sample Temperature in Accelerated Testing Instruments
The goal of artificial weathering testing is to simulate, then accelerate, natural, or end-use weathering processes. It is therefore logical that measuring and controlling sample temperatures are important factors within these chambers. As with natural weathering tests, black panels are commonly used to represent the maximum temperature achieved.
These panels have been defined by many standards institutions. For example, ASTM G151, Standard Practice for Exposing Nonmetallic Materials in Accelerated Test Devices that Use Laboratory Light Sources, and ISO 4892-2, Plastics – Methods of Exposure To Laboratory Light Sources – General Guidancedescribe the characteristics for these panels. Weathering instrument manufacturers equip these panels as standard features in the chamber, and tests run in these instruments typically will define a black panel temperature set point as one of the many parameters.
There are two common types of black panels. An uninsulated black panel consists of a flat metal plate coated with a black layer that has good resistance to aging and absorbs at least 90% of irradiation received during exposure. A thermal-sensitive element is firmly attached to the center of the exposed surface. An insulated black panel is similarly coated, but the temperature sensor is attached to the side opposite the radiation source. The metal is then attached to a 5 mm-thick base plate made of unfilled polyvinylidene fluoride (PVDF).5 In common weathering terminology, the uninsulated black panel is referenced as a “BPT,” and the insulated black panel is referenced as a “BST” or “black standard thermometer (Figure 3).”6
While these descriptions provide a general basis for construction, certain details are omitted, such as the panel thickness, specific type of metal used, and type and mounting method of the temperature sensor utilized. Further, different weathering instrument manufacturers may use different mounting techniques for the black panel depending on the orientation of the light source and exposed specimens.
As mentioned above, it is not practical to measure the surface of individual test specimens, and this impracticality is expanded by the rotation of the specimen rack during exposure and/or the need to route wires through the chamber door or other orifice of the test chamber, which could represent a safety hazard.
The fact that actual specimen surface temperatures are not measured is an inherent weakness of common artificial weathering tests. This is especially true when the focus of the research question is to determine the acceleration factor of the artificial test or to approximate the end-use service life of the material under study because, as already established, temperature is a primary factor in the degradation rate of a material.
New Methodology for Determining Specimen Temperature During Artificial Tests
A temperature-dependant radiation spectrum is emitted from all materials. Planck’s Law (Equation 2) and its various derived forms describe the spectral distribution for an ideal black body and is illustrated in Figure 4 for various temperatures. The emission is primarily in the infrared region. Real materials do not behave as an ideal black body, and thus one frequently must consider the emissivity (defined as the ratio of the material emittance at a specific wavelength and temperature to the emmitance of an ideal black body). Fortunately, a simple calibration can account for material-dependant emissivity. The measurement of (infrared) emission forms the basis of infrared pyrometry.
MBB = radiant emittance of a black body
h = Planck’s constant
k = Boltzmann’s constant
c = speed of light and
T = absolute temperature
Based on this fundamental premise, research and development staff at Atlas Material Testing Technology LLC undertook a project to incorporate existing temperature-sensing technology into the rotating-rack, xenon-arc artificial weathering instrument, the Weather-Ometer®. An appropriate IR pyrometer was selected based on the following criteria:
• Sensor head size – must be small enough not to significantly interfere (shadow) the radiation from the xenon-arc lamp;
• Response time – must be rapid enough to provide several measurements across the surface of a typical sample width of 2.5” (7 mm);
• Spectral response – must not be affected by the spectral range of the xenon-arc lamp;
• Spatial resolution – must provide a small enough measurement surface area to view only the specimen surface and not the chamber wall or sample holder; and
• Working ambient temperature/relative humidity – must withstand the harsh environment of the weathering chamber during actual weathering tests.
Initial work validated the IR pyrometer chosen, and further R&D efforts were made to develop a method to allow the instrument to determine which specimen temperature was being measured at any given time. Different specimen indexing methods were considered and, ultimately, the use of common RFID (radio frequency identification) technology was chosen. This method required the incorporation of an RFID reader that could identify tags mounted to sample holders that corresponded with specific specimens. A representation of these components as they are used in a rotating-rack, xenon-arc weathering instrument is shown in Figure 5.
The exposed specimens rotate around the light source at one revolution per minute. The IR pyrometer takes continual readings every 0.2 sec. As the specimens pass within the field of view of the pyrometer, at least five readings are taken horizontally along the specimen surface. Simultaneously, the RFID tag mounted on the back of the sample holder comes into the field of view of the RFID reader mounted behind protective glass outside the chamber. This “triggers” the appropriate temperature measurement from the IR pyrometer, which is then displayed on the graphical user interface of the Weather-Ometer. Temperatures can be displayed in table or trend plot format, and both the triggered specimen temperature measurement and the raw data from the continual readings from the IR pyrometer can be stored and retrieved through common data-collection methods.
Validation of the S³T System
Once components were chosen and all hardware/software incorporated into the design of the Weather-Ometer, several aspects of product validation were required. These included:
• Comparison to traditional temperature measuring techniques – Tests were conducted with a standard set of materials with thermocouples and/or RTDs mounted to the surface to determine if comparable temperature measurements could be achieved.
• Range of temperatures – The system was utilized with a wide variety of commonly used temperature black panel set points; from lower temperatures in AATCC TM16 (63 ºC) to SAE J2412 (89 ºC).
• Range of materials/colors – Several types of materials (textiles, coatings, plastics), along with a variety of colors were used to determine if valid temperatures could be attained with the system.
• IR pyrometer measurement of BPT/BST– Tests were conducted comparing the measurement of the standard insulated and uninsulated black panels to ensure there was agreement with the standardized method of data acquisition.
• Stress testing – The system was tested to the extremes of the performance envelope of the Weather-Ometer in terms of irradiance levels, chamber temperature, relative humidity, light/dark cycling, and spray.
Space restrictions limited the large amount of data that was collected and analyzed during the course of the R&D work. However, one example of validation testing that combines the first three aspects of product validation listed above is described here.9
Seven aluminum panels coated with colored PVC films with Type T thermocouples embedded between the coatings and the substrates were employed in these tests. The colors were white, yellow, orange, red, green, blue and black. The tests in this validation are listed in Table 1. For each test, the surface temperatures for each of the seven colored panels were recorded and tracked by both the S³T system and the thermocouples. The measured temperatures were averaged over 10-min periods during stable test stages for each colored sample, and the results are shown in Figure 6.
Limits of the S³T system
While the incorporation of the S³T system into artificial weathering testing represents a revolutionary advancement, there are certain limiting aspects of the system worth mentioning.
• Emissivity of material – Fundamentally, the use of IR pyrometry works best with materials that have relatively high emissivity. This includes a wide range of materials from plastics to textiles to coatings. Most opaque materials have an emissivity above 0.85, and the IR pyrometer used in the S³T system can be calibrated to specific emissivity levels. However, bare metals and low-E coatings used in fenestration applications are not appropriate for S³T.
• Position of specimens– In the Weather-Ometer, the standard rotating rack has three tiers on which specimens can be mounted. Due to potential shadowing of the IR pyrometer, only specimens on the middle tier of the rack can be measured.
• Rack rotation speed/high irradiance – To maintain appropriate temperature and irradiance uniformity during a test, the rack of the Weather-Ometer rotates at higher speeds for tests requiring high irradiance levels. Despite the fast response time of the IR pyrometer chosen (0.2 sec), a rack rotation speed of one revolution per minute must be used for the RFID components and IR pyrometer to synchronize correctly.n
References
1 http://www.nrel.gov/gis/images/map_pv_us_annual10km_dec2008.jpg
2 Fischer, R.M. and co-workers. Polym. Mater. Sci. Eng.83, 136–139 (2000). ACS National Meeting, Aug. 20–24, 2000.
3 Garner, B,L.; and Papillo, P.J. Ind. Eng. Chem. Prod. Res. Dev.1, 249–253, 1962.
4 Clauson, D. in 75th Annual IFAI Convention, Nov. 1987, Industrial Fabrics Assoc. Int’l, St. Paul, Minn., 1988, pp. 96–110 (Preprint).
5 ASTM G151, Standard Practice for Exposing Nonmetallic Materials in Accelerated Test Devices that Use Laboratory Light Sources, 2010 revision.
6 ISO 4892-2, Plastics – Methods of Exposure To Laboratory Light Sources – General Guidance, 2006 revision.
7 http://www.eldoradocountyweather.com/climate/US%20Climate%20Maps/Lower%2048%20States/Temperature/Mean%20Daily%20Maximum%20Temperature/Gallery/us- mean-daily-max-temps-gallery.html
8 http://www.sciencephoto.com/media/146802/enlarge
9 Zhang, J. SST Research Summary, Internal Atlas R&D Research Report, 2007.


Report Abusive Comment