


Frictional resistance contributes up to 80-90% of the total resistance for commercial vessels. An increase in resistance results in higher fuel consumption, harmful greenhouse gas emissions and higher (engine) maintenance – ultimately higher cost for ship owners and operators.
Therefore, much attention has always been paid to understanding and predicting frictional resistance of a ship in the design phase. To make such predictions, detailed knowledge of the frictional resistance coefficient of the wetted surface area of the ship is required. This frictional resistance coefficient depends largely on the roughness and texture of the wetted surface area. Effects of physical roughness parameters on the friction coefficient were established long ago in towing tank experiments and are well documented.1 Thereafter, other studies were published on the relationship between surface roughness of non-fouled hull coatings and friction drag performance. At that time, so-called self-polishing antifouling paints (based on TBT) gained a strong market position due to their advanced binder technology, resulting in a smooth surface on which minimal fouling could settle. Further investigations into friction drag consequences of changes in hull roughness due to paint polishing have been reported by Townsin et al.1 and Grigson.2
Seaweed, barnacles, mussels and tubeworms are all attracted to ship hulls. Substantial fouling growth on a ship hull may easily give 50-80% extra friction drag. In the case of hard fouling (such as barnacles, tubeworms and oysters), added drag effects were quantified by Kempf,3 cited in Schultz4 and later on by Townsin.5 For soft fouling, such as seaweed and slime fouling from diatoms and bacterial biofilms, quantified added drag effects have been reported varying from 9-29%.6 So for both hard and soft fouling, the drag penalty can be significant, although the magnitude of the increase will strongly depend on the type of fouling and percent coverage.
Currently available hull coatings can be divided into two major groups: so-called self-polishing coatings (SPCs) with biocides that leach into the environment and thereby kill fouling organisms; and biocide-free fouling release coatings (FRCs) on which organisms can only weakly adhere, and fouling is readily removed at certain ship speed and activity.
Worldwide, SPCs still have major market share – between 80-90%. FRCs are usually higher in cost, require more attention during application and are more vulnerable to mechanical damage. On the positive side, there are claims from coating producers that FRCs provide fuel savings, at least in newly applied conditions.
In practice, total friction resistance of a ship is influenced by changes in hull surface conditions, such as polishing or weathering of the coating, and by fouling that has settled on top. The hydrodynamic roughness resulting from fouling onto a weathered coating system is hard to define. Next to physical roughness parameters characterizing the coating surface, there is what could be called “biological roughness” that, together and in interaction with the coating surface, will give a total drag penalty. When comparing hull coatings on friction drag performance, this total added drag effect is the main parameter that counts.
The “biological roughness” thus far cannot be described in existing physical roughness terms. Until now, the lack of suitable experimental methods to determine such effects has prevented reliable determination of this parameter. Towing test facilities are not suitable for this purpose, especially not for making replicate measurements, and also such experiments are far too expensive to investigate all relevant variables.
Measuring Friction Drag Properties
A small-scale laboratory test set-up, such as the Friction Disk Machine (FDM) available at Endures, has significant advantages in this respect. The set-up replicates an example from the U.S. Navy6 and is used for differential measurements of the same disks with different surface conditions. Such comparative measurements establish the added drag effects of specific surface conditions such as roughness or fouling patterns. At 23 cm diameter, the small disk size also simplifies the process of getting sufficient replicates of experimental samples with the same coating or with similar fouling patterns.
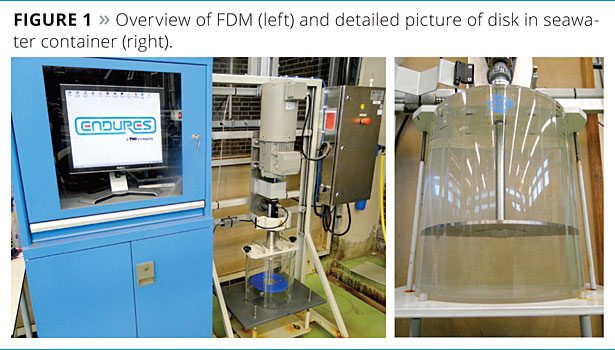
The FDM (Figure 1) consists of a variable-speed motor that drives a shaft onto which disks are mounted. The coated disk rotates in a cylindrical Perspex container (32 cm height and 30 cm diameter), completely filled with filtered natural seawater. A torque sensor installed on the shaft measures the torque produced during the entire rotation protocol.
Torque on the motor shaft is recorded as the disks are spun at increasing angular velocities from 500 rpm to 1500 rpm (in incremental steps of 200 rpm). Different rotation protocols are used, depending on the specific purpose of the test. An example of a commonly used protocol is shown in Figure 2. Torque data used in analysis of results are the last 60 seconds of each speed step.
To verify the test accuracy, friction drag tests were done with aluminum disks with four different roughness grades (Rt values of 51, 55, 80 and 97 µm, respectively) in comparison to a smooth titanium disk (Rt 2 µm). The graph in Figure 3 shows the results of these tests. Friction drag increases with surface roughness – even very small differences in Rt were found to give different drag. This follows general hydrodynamic theory, and the FDM test set-up is able to generate reliable and consistent data on friction drag properties of specific surface conditions.
Friction Drag Measurements on Different Types of Coatings
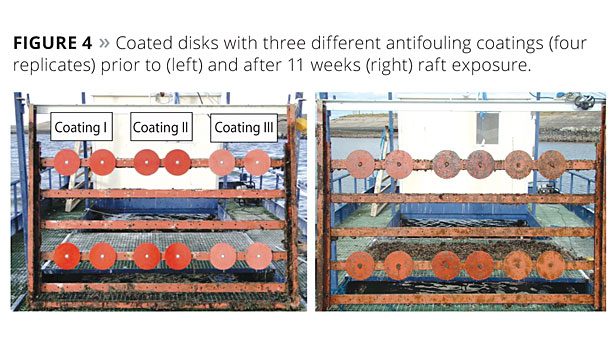
Three different, commercially available hull coatings – two types of fouling release coatings (FRC) and one self-polishing coating (SPC) – were subjected to friction drag tests in the FDM, first in pristine condition and subsequently after a period of 11 weeks raft exposure with natural fouling on their surfaces. The difference in drag between the two measurements demonstrates for each coating the added friction resistance caused by the fouling pattern present on the surface.
Figure 4 shows the coated disks prior to and after the raft exposure period. Each coating was tested in fourfold.
In Figure 5, average friction resistance values of coatings in pristine condition are given. Data measured at 500 rpm were not correctly logged in this test and therefore discarded. Both FRCs were almost equal in friction resistance at all rotation speeds, whereas Coating III, the SPC, gave the highest friction drag over the entire speed range. In comparison to Coating I, the SPC showed 10-15% more friction resistance at speeds from 900 rpm onwards. The relative difference between both FRCs was very small with 2-5% in favour of Coating I. Variation between the four replicates was very low. In this particular case the newly applied fouling release coatings showed better drag performance than the self-polishing antifouling paint.
Figure 4 (right) gives an overview of the fouling condition after 11 weeks. Despite being exposed at the same location and for the same time, the different coatings showed differences in rate and type of fouling on their surface. Fouled disks were returned to the lab under immersion in seawater, and they were kept immersed until drag measurements were completed. Photographs that were taken of coated disks prior to and after completion of the drag test are shown in Figure 6.
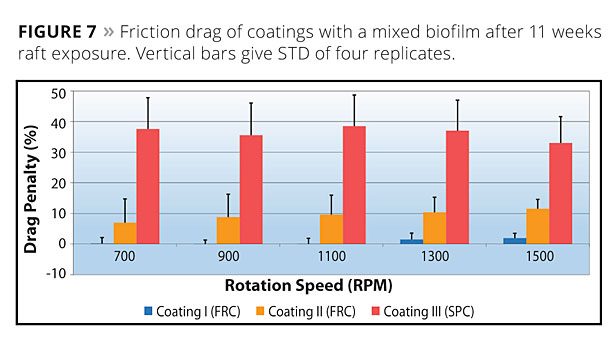
The graph in Figure 7 shows the results of drag measurements with fouled disk in a relative sense. This means that the torque value measured in fouled condition is expressed as a percentage of the torque in clean condition. This way the percent added drag as shown on the vertical axis in Figure 7 can be seen as the drag penalty that can be ascribed to the presence of the mixed biofilm.
The three coatings show clearly different drag properties. Coating I actually does not give any added drag with the fouling pattern, as shown in Figure 6. After completion of the test, the disk surface was visually almost clean.
The other FRC, Coating II, in fouled condition gives around 10% added drag at all rotation speeds. Visually, the fouling pattern prior to testing on Coating II does not differ greatly from the one observed on Coating I. However, this fouling apparently has stronger adhesion to the surface, which means that the fouling release properties of Coating II are less than those of Coating I. The surface condition of Coating II after the test shows an irregularly distributed thin biofilm of diatomaceous slime; apparently this slime layer is still able to evoke a drag penalty of 10%.
The SPC coating (Coating III) shows a very different fouling pattern initially (Figure 6) with quite a lot of slime and sand patches regularly distributed over the coating surface. These patches partly contained small sand-burrowing tubeworms, a type of fouling not very common on antifouling coatings. After rotation in the FDM all patches had disappeared, leaving a biofilm behind, mainly consisting of diatom slime. The added drag effect of this slime layer was found to be around 35% over the entire speed range.
The raft test has clearly shown that, under the same exposure conditions, fouling settlement on fouling release coatings is different than that on self-polishing coatings. The subsequent friction tests demonstrate that, as a result, friction drag properties of hull coatings may differ considerably.
Comparing both of the fouling release coatings, two similar commercially available products, the type and rate of fouling development during the period of static raft exposure was not very different. Despite this, the friction drag test in the FDM indicated better fouling release properties with one of the FRCs, making this product a better choice from a friction resistance perspective.
Determination of Long-Term Drag Properties
In another test set-up (Figure 8) we applied rotation aging of coated disks in natural seawater at various speeds in order to simulate a ship sailing at cruising speed. Combining this with intermittent short periods of static raft exposure, full operational schedules of a ship can be simulated, including idle time spent in harbour.
Determination of the friction drag properties of self-polishing hull coatings over longer periods of time is possible by measuring the friction resistance of coated disks at specific intervals. This way, in conjunction with raft exposure, quantitative data is obtained on fouling development on aged hull coatings and associated added drag. Custom-made aging and exposure protocols can be applied, depending on client needs.
Conclusion
Results demonstrate that in essence, the FDM methodology has good potential and value for use in screening or selection of suitable hull coatings. Using a key performance parameter of hull coatings – the ability to keep friction resistance of a ship hull as low as possible – experiments in the FDM can help to find suitable products for specific ships or operational profiles, or to select the most efficient products with best long-term friction drag performance. This will increase cost efficiency in both ship operations and maintenance. The differential measurements in the FDM set-up generate drag penalty data that need further transformation before appropriate statements can be made on consequences for added friction resistance of ships. Such transformation can be done following the approach described in Granville.7
References
1 Townsin, R.L.; Byrne, D.; Svensen, T.E.; Milne, A. Trans SNAME 89. 1981, 295-318.
2 Grigson, C.W.B. J. Ship Res.1992, 36: 182-196.
3 Kempf, G. Trans INA. 1937, 79: 109- 119.
4 Schultz M.P.; Bendick, J.A.; Holm, E.R.; Hertel, W.M. Biofouling2011, 27: 87- 98.
5 Townsin, R.L. Biofouling2003, 19 (suppl.): 9- 16.
6 Holm, E.R.; Schultz, M.P.; Haslbeck, E.G.; Talbott, W.J.; Field, A.J. Biofouling2004, 20: 219- 226.
7 Granville, P.S. J. Fluids Eng.1982, 104: 373- 377.
For more information, e-mail Dr. Klijnstra at Job.Klijnstra@endures.nl.


Report Abusive Comment