
When we look back at 2005, the most notable events surely will include Hurricanes Katrina and Rita. Like the old adage goes, "Timing is everything." For 19 years now, we mail our survey to qualified finishers in early fall. This year, the survey was delivered shortly after the two storms hit. And as we all know, they hit mighty hard. Even as this article is being written - two weeks before the close of 2005 - there are countless people still without homes, and businesses that may never do business again.
According to a survey by the Associated Press early in December, though, manufacturing expanded in November in industries ranging from apparel to tobacco. The Commerce Department reported that personal spending rose 0.2 percent in October, down from September's 0.5 percent gain but better than the 0.5 percent decrease in August when the Gulf Coast region was hit by Hurricane Katrina. Incomes rose 0.4 percent in October after being skewed for two months by the storm's fallout.
Energy pricing was a concern, but on Wall Street, stocks soared as investors welcomed inflation-friendly economic data and hoped the November rally would continue through year-end. The Dow Jones industrials rose 106.70, or 0.99 percent, to 10,912.57. The move higher nearly reversed the market's previous three days of losses, Broader stock indicators also rose sharply. The Standard & Poor's 500 index added 15.19, or 1.22 percent, to 1,264.67, and the Nasdaq Composite index surged 34.35, or 1.54 percent, to 2,267.
There was optimism among business executives surveyed by the Institute for Supply Management, which said its manufacturing index stood at 58.1 last month. While that is down slightly from October's reading of 59.1, any reading above 50 indicates the sector is expanding. November marked the 30th consecutive month of growth in the manufacturing segment.
This sounds very promising, but it seems that finishers are not as upbeat about business prospects in the coming year as they had been in the last couple of years, according to Industrial Paint & Powder's 19th annual Finishing Market Survey. Of 176 respondents, only about 47 percent say that their operating levels in 2006 would be higher than in 2005, this is down nearly 10 percentage points from last year's survey. About 10 percent of respondents said their operating levels would decrease in 2006, which is a bit higher than the estimated 5 percent response from the last two years. About 43 percent of respondents indicate that business will remain about the same as last year - that is 5 percentage points higher than last year.


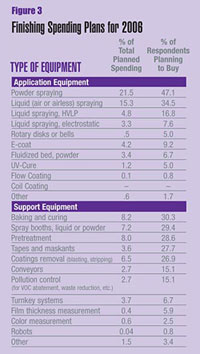
In the past two years, upgrading or replacing aging equipment was the main reason for investing in new equipment, the motive cited by almost 52 percent (multiple responses are allowed) this year. But this year, a reduction in operating costs is the principal motive for new investments in finishing equipment. More than 57 percent of respondents cited this as the main reason to invest in 2006.
Other reasons for purchasing new equipment include:
- Increase capacity - down to 38 percent after its jump to 46 percent last year. This response is nearly the same as it was two years ago at 39 percent.
- Improve coatings appearance/performance - nearly 33 percent (down 6 points from last year).
- Environmental compliance - 26 percent (down 1 percent).
- Expand/improve color-change capabilities - 10 percent (up from 6 percent last year).
- Conversion to new coating system, 12 percent (up from 9 percent last year).
When asked which costs would be reduced to justify investment in new finishing equipment, "direct labor" was cited by more than 53 percent of respondents, down 5 percentage points from last year. "Scrap and rework" was cited by 56 percent of respondents as a justification for investing in new equipment, which is about the same as last year. Other spending justifications include "material costs," 38 percent; "indirect labor" (setup, maintenance, material handling), 49 percent; "in-process inventory," almost 12 percent; and "warranty and field service," nearly 12 percent. These spending justification percentages were similar to last year's numbers.
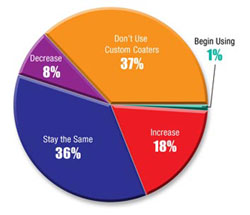
About 32 percent of finishers say they outsource at least some of their finishing to custom coaters. Though the majority of these companies (55 percent) outsource less than 10 percent, 18 percent say they plan to increase their use of custom coaters within the next two years.
In the plant
Capacity-utilization rates in 2006 fluctuated only somewhat from 2005 rates. The capacity-utilization-rate categories were:- Less than 50 percent capacity, checked by 24 percent of respondents
- 50 to 59 percent capacity, 15 percent
- 60 to 69 percent capacity, 12 percent
- 70 to 79 percent capacity, 19 percent
- 80 to 89 percent capacity, 16 percent
- 90 percent capacity or more, 13 percent
The percent of companies saying that they send at least some of their parts out to custom coaters to be painted or powder coated - more than 31 percent - is up from last year's 29 percent. This number had been on the decline for two years at 33 percent and 45 percent four years ago. The majority of finishers say that less than 10 percent of their coatings requirements are handled by custom coaters, but that 18 percent plan to increase their use of custom coaters over the next two years (Figure 4).
When it comes to the types of coatings used, the main change that has occurred over the last few years is the increase in the use of powder coatings. Respondents say that powder coatings account for nearly 50 percent of total usage, an increase of roughly 15 percent over the last three years. Finishers say they expect powder coatings to account for 55 percent of total usage two years from now. Like last year, the high cost of conversion was cited as the primary obstacle, but by 44 percent, which is down from 58 percent last year.
News From NAM
The National Association of Manufacturers' president, John Engler, emphasizes the importance of NAM's Campaign for Growth and Manufacturing Renewal. The Campaign, which was launched by the NAM Board of Directors in early 2003, reminds the United States that while manufacturing is more productive, innovative and critical to America's economy than ever, it also faces historic challenges.On December 7, 2005, the National Summit on Competitiveness in Washington hosted by NAM and the Commerce Department brought together leaders from corporate America, academia, government and the small and mid-size manufacturing sector, Engler says, to accelerate action on an innovation agenda that will allow America to compete successfully in the 21st century.
"As I emphasized in opening the summit, this nation cannot thrive without the technological advantages that we as Americans have enjoyed over the decades," Engler says. "That is why we are calling for an increase in federal monies for research and development, a greater emphasis on science and math education in our schools and immigration reform as a means to keep as many of the brightest minds that study in American universities in our great nation."
Engler says the story is told best in the 2005 Skills Gap Report that was released by NAM, the Manufacturing Institute and Deloitte Consulting. It shows that increasingly, U.S. companies are unable to find the skills and talent they need while some developing nations now turn out more engineers than the United States does each year, according to Engler. He says that China graduated 600,000 engineers last year; India graduated 350,000; and the United States graduated 70,000.
"China and India are racing to climb the technology ladder. We must recognize that we're in that race, too, and we have to run smarter if we are to maintain our high standard of living and our global leadership.
"Our failure to keep pace in research funding and workforce preparedness has been well documented in recent years with a series of reports on innovation and competitiveness. But, the purpose of the summit is not to produce another report; it's to draw from those existing reports and focus on an action program," Engler says.
He adds that credit is due to leaders in Washington who have understood this problem for some time. "Rep. Frank Wolf (R-VA) should be applauded for initiating the summit with help from Rep. Sherwood Boehlert, (R-NY), chair of the House Science Committee, and Rep. Vernon Ehlers, (R-MI), chair of the House Environment, Technology and Standards Subcommittee. Commerce Sec. Carlos Gutierrez, Energy Sec. Samuel Bodman, Labor Sec. Elaine Chao, Education Sec. Margaret Spellings and Deputy Commerce Sec. David Sampson all met with summit participants to discuss policy prescriptions for future economic success."
Smaller manufacturers told their stories as well, Engler says. Della Williams, owner of Williams-Pyro Inc. in Texas, said when she went looking for engineers for her company she could find no American candidates. Instead, she hired foreign-born workers educated at Texas universities, but has had trouble retaining them and cannot even get "green cards" because of outdated immigration rules, according to Engler.
Kellie Johnson of ACE Clearwater Enterprises in California said 10 openings in her company have gone unfilled because of the lack of skilled candidates, Engler says. "She has not sat idly by, however. Instead, she has thought ahead by hosting plant tours for children in elementary school to show them how exciting work can be a in a manufacturing company," Engler says. Johnson also hires high school interns for summer work and seeks out graduate students from local schools like the University of Southern California.
Engler says, "The Innovation Summit was a giant step to bring the attention of the nation's leaders on the bottom-line impacts of standing still in a rapidly changing world. The focus is now on moving the debate along swiftly to keep America the world's leading innovator."
Editor's Note: Industrial Paint & Powder would like to thank the many readers who took time to participate in this year's market survey. To gather information for the survey, questionnaires were mailed in October to a representative sample of industry professionals at 2,000 U.S. finishing locations. A total of 276, or 14 percent, were returned. A sample this size offers a 5.9 percent margin of error at a 95 percent confidence level. This survey's intent is to highlight industry trends rather than set specific dollar expenditures for individual sectors of the market. We welcome comments and suggestions regarding the survey. Send them to spielmans@paintand powder.com.
Of those responding to this year's Finishing Market Survey, nearly 57 percent identified their operations as finishing departments of a manufacturing company; 35 percent identified themselves as a custom coater or job shop.
SIDEBAR: The "Typical" Finisher
Finishing operations vary widely in size and scope of operations; thus, attempting to provide a snapshot of the "typical" finisher is no easy task. But the responses to Industrial Paint & Powder magazine's 19th annual Finishing Market Survey provide detailed information about staffing, spending, application methods and much more for small and large finishers alike.While finishing facilities that use a relatively small amount of liquid paint comprise a huge portion of all facilities using liquid coatings, the same is less true for powder finishers. Of those respondents using liquid coatings, nearly 49 percent use less than 100 gallons per month; 100 to 249 gallons, 18 percent; 250 to 499 gallons, 7 percent; 500 to 999 gallons, 12 percent; 1,000 to 2,499 gallons, 7 percent and 2,500 gallons or more, 6 percent. Conversely, about 33 percent of shops applying powder coatings use less than 250 pounds per month; 250 to 999 pounds, 18 percent; 1,000 to 2,499 pounds, 19 percent; 2,500 to 9,999 pounds, 16 percent; 10,000 pounds or more, 16 percent.
The majority of the respondents (65 percent) say their finishing operations occupy less than 10,000 square feet; about 41 percent occupy less than 5,000 square feet. About 7 percent occupy 50,000 square feet or more.
When asked about the age of their equipment, 18 percent of respondents said their liquid application equipment was less than three years old; 39 percent, three to five years old; 25 percent, six to 10 years old; 19 percent, more than 10 years old.
Regarding powder application equipment, 19 percent of respondents said their equipment is less than three years old; three to five years old, 32 percent; six to 10 years old, 34 percent; and more than 10 years old, 15 percent.
On average, respondents say that about 14 people are directly involved in the company's finishing activities, though 72 percent of respondents say they employ 10 people or fewer. The number of people involved in finishing, according to respondents, has fallen significantly the last few years.
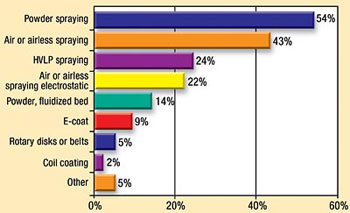
How are those employees applying paint and powder? About 42 percent of respondents use air or airless spraying, which is about the same as the last two years but down from 48 percent four years ago. That category has dropped further behind powder spraying (54 percent), up from 44 percent just last year and 34 percent a few years ago. About 24 percent employ HVLP spraying and 22 percent use electrostatic liquid spray equipment (Figure 5).
And what are they coating? Ferrous metals account for 66 percent of total coating volume, while nonferrous metals account for 22 percent. Those numbers have remained fairly consistent over the last several years. Respondents indicate a slight decrease in coating ferrous metals and an increase in coating nonferrous metals during the next two years. Wood accounts for almost 4 percent and plastic nearly 6 percent of total coatings volume.
Only about 11 percent of respondents say they are reformulating their coatings, this is down from almost twice that last year. Of those that do, here is a breakdown of company purchases (multiple responses were allowed): solvents, 85 percent; additives, 60 percent; pigments 55 percent; and resins 30 percent.
Report Abusive Comment