
Radiation curing is a small but fast-growing segment of the near-$100 billion paint and coatings market. According to several recent postings on the SpecialChem4Coatings website, the total world market for paints and coatings is growing only at GDP growth rates, while the radiation curing segment, representing only 3.2% of the total market in 2005, is growing at an annualized rate of 6%.1 However, radiation curing is much more than simple conformal coatings. It also includes imaging applications that impact packaging, semiconductor and electronics, and textile markets where ultraviolet radiation or electron beam technologies are used to create photopolymer patterns for subsequent development or for overall surface curing (e.g., CD and DVD coatings). When this segment is included, the total addressable radiation curing market is nearly $3 billion, with growth rates ranging from 4 to 8% per annum.
This attractive market also benefits from positive trends pointing to continual improved growth. Rising energy and materials costs and worldwide trends toward greener manufacturing processes all support the conversion of conventional coating and drying technologies into fast, clean, radiation-based manufacturing methods.
What holds back a wider introduction of radiation-based manufacturing? Partly, it is the huge infrastructure of conventional coating manufacturers. But it is also that radiation curing technology is intimidating to many who wish to enter, as radiation curing requires some knowledge of polymer chemistry, photochemistry, and formulation science, light source engineering and manufacturing process quality control. In addition, the complex value chain in radiation curing has created an atmosphere that inhibits communication along the value chain. Materials suppliers are reluctant to share data with formulators, and light source manufacturers promote processes and equipment that do not necessarily optimize manufacturability or promote quality.
Recently, new software has been developed that enables users to create virtual formulations on a computer; set up radiation curing conditions such as choice of light source, power input levels and environmental conditions; and then analyze and optimize material combinations, costs of processes and utilization of light sources, all without mixing a single formulation in a laboratory or making a test run on a manufacturing line. While using such software will not eliminate the need for laboratory or manufacturing line experiments, it can shorten the time to bring new formulations to commercial status. In addition, the software's networking capabilities and communication tools can allow secure information sharing between suppliers and customers without a loss of confidentiality. Through these and other benefits, the software is creating new opportunities for the radiation curing industry.
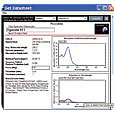
Figure 1. A portion of the data sheet for Irgacure 651, generated at several percent loading of the initiator, at a thickness of 1 micron.
Essential Components
The software consists of three modules - a database, a formulation tool, and a networking and communication tool - which are linked together to predict and optimize the photocuring properties of materials formulations.The database includes materials, light sources and other equipment, and any ancillary items used in developing and manufacturing radiation curable coating formulations. Photoinitiators, monomers, oligomers and additives (including pigments) are either supplied as part of an existing database or can be added by users. A variety of light sources, including many doped mercury lamps, several lasers, some fluorescent sources and a laser diode source, are also included. The database also contains several filter materials that can be impinged between the light source and the coating to be irradiated, and several examples of substrates with different degrees of reflectivity to light of different wavelengths. In all of the database categories, users can enter other materials, substrates, filters and light sources to customize the software.
In the formulation module, users create formulations, store them for later retrieval or modification, and use them in curing scenarios for analysis. Users can also conduct optimizations and what-if analyses that can provide a competitive advantage compared to firms that continue to do time-consuming, repetitive and costly formal analyses, such as design of experiment.
The third module is designed to be an expert tool and network-based communications module for group interactive collaboration and sharing of results on a confidential basis. This module expands the range of the software's modeling capability by incorporating advanced methods and variables, and enhances the database by creating possibilities for custom entries and solutions tailored to specific user groups.

Figure 2. A continued view of the Irgacure 651 data sheet, which shows the relative spectral sensitivity of this formulation as a function of wavelength.
The Software in Action
The capabilities of the software allow companies to model and predict the behavior of radiation-cured coatings based on current or past research. For example, in the late 1980s and early '90s, Professor Christian Decker and his then-student Khalil Moussa at the French Laboratoire de Photochemie Generale, Ecole Nationale Superieure de Chemie in Mulhouse, began a series of publications in which they introduced the method of real-time infrared spectroscopy (RTIR) to follow the course of light-induced photopolymerization during and after exposure under many different conditions, including in air, under an inert gas atmosphere or in laminate structures. These pioneering studies also provide some of the best and most extensive data on the time-course of photopolymerization.Decker and Moussa (D-M) studied a series of formulations initiated by several common photoinitiators under the influence of a Krypton ion laser (Kr+, 337.4 nm light),2 one of which was a 1:1 weight mixture of two commercially available monomers: hexanediol diacrylate (HDDA) and a carbamate acrylate [2-(isopropylcarbonyl-amino) ethyl acrylate]. This formulation was initiated by Irgacure 651 (benzyl dimethyl ketal), which was present at 5 wt %.3 Films were cast at a 1 micron thickness and then laminated with a polyethylene coversheet to prevent ambient oxygen from the atmosphere from entering the film.
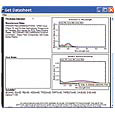
Figure 3. An expanded view of the 350 nm region of the relative spectral sensitivity graph of the Irgacure 651 data sheet.
Creating a Data Sheet
To model this formulation using the new software, a user would first pull up a data sheet for the initiator by clicking on the database button in the start-up screen. A dialog box would appear, prompting the user get a data sheet, add new items to the database or search the database by key words. Clicking on the "Get Datasheet" button would present the user with a choice of different material and equipment categories that can be used to produce a data sheet.To create a data sheet for a photoinitiator, the user would choose "Initiators" to pull up a list of initiators. Clicking Irgacure 651 and then the "Generate" button would produce a new dialog box, from which the user could set up the presentation of the data sheet by choosing concentrations or weight percentage levels, optical properties, and path length thickness. Since D-M used a 5 wt % level at 1 micron thickness, the user would make that one of the choices, then click "OK" to produce the data sheet.
The data sheet would show physical property data for Irgacure 651, such as molecular weight, physical appearance, density, melting point, quantum yield of radical production, and the thickness chosen for the presentation. It would also display three graphs, shown in Figures 1 and 2 (p. 16). The top graph in Figure 1 is the absorption spectrum of the material (in acetonitrile). The bottom graph in Figure 1 consists of three plots of the optical extinction of the three chosen loading levels. The blue line represents the highest loading chosen, while the red represents the intermediate level and the green the lowest loading, all at the thickness (pathlength) chosen. In this case, the 5 wt % level (red) at a 1 micron thickness produces low light absorption. In fact, at the laser emission wavelength (334.7 nm), the optical density is only 0.007. (Note the point revealed by the cursor at 334 nm in the lower right corner of the figure.)
The bottom graph in Figure 2, which is the relative spectral sensitivity graph, is below the optical density curves. This graph shows, again at the three loading levels chosen, what wavelengths of light will produce the greatest polymerization response in this film, with a value of 1.0 being an "ideal response." In this case, for this very thin film (1 micron), the value is quite low and far from the ideal value. By expanding the graph scale and using the cursor pointing technique, as shown in Figure 3 the user can determine that the relative spectral sensitivity at 334 nm is 0.04.
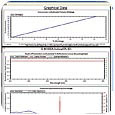
Figure 4. A portion of the graphical output calculated by the software for the HDDA/carbamate acrylate formulation, initiated by Irgacure 851, exposed with a Krypton ion laser in air.
Creating a Formulation
After creating the required data sheet, the user could then employ the software's formulation module to create the formulation used by D-M and simulate its exposure to the Krypton ion laser. From the main formulation screen, the user could create a new formulation (or modify a pre-existing one), analyze a formulation that has already been created and stored, or create custom filters or substrates. Clicking on "Create or Modify a Formulation" would pull up a formulation-creation screen. The user would name the formulation for later retrieval and scroll down in the initiator section until Irgacure 651 was visible, and this option would be checked for inclusion. The software would automatically enter the initiator into a table at the bottom of the screen that lists the formulation being created. Continuing to the monomers list, the user would check Acticryl 960 (SNPE's designation for the carbamyl acyrlate) and SR 238 (Sartomer's designation for HDDA). The user would then enter the amounts of each, in grams, to make the 5% Irgacure 651, 1:1 HDDA:Acticryl 960 formulation, designated as "D-M HDDA Acticryl 5% 651." The user would click "Save Formulation" and navigate back to the main formulation page, where s/he would then click "Contextually Analyze a Formulation."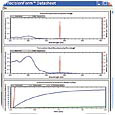
Figure 5. A continued view of the graphical output from the software.
Running a Simulation
The formulation created by the user would be stored in the "My Formulations" section of the formulation database. The user could pull down the "Select a Formulation" scroll list, locate "D-M HDDA Acticryl 5% 651" in the list and select it. The software would then ask the user to name the analysis. Selecting "D-M Test 1" would pull up a screen in which the formulation itself would be listed to the right, and the formulation and analysis names would be listed for reference. The user would then be asked to provide an "Analysis Environment," which includes the light source, atmosphere, and film thickness. Perusing the list of available environments, the user would choose "Decker Kr+ Laser" and then click "Show Details." A new set of data would appear on the screen, including all the variables that describe the conditions surrounding the exposure of this film as stipulated in D-M: The laser power produces 50 mw/cm2 at the film surface; the film is a laminate structure, which means oxygen is present in the film volume but no new oxygen can penetrate when the original oxygen concentration is exhausted; and the film thickness is 1 micron. Other parameters also could be selected; for example, the user could choose to intersperse a filter between the light source and the film, or could choose a substrate that reflected some or all of the light that passes through the film thickness.Before running the simulated exposure, the user would need to evaluate several sets of pre-analysis data in case changes need to be made. First, an "Estimated Limiting Degree of Conversion" would provide an estimate, based on the functionality of the formulation, as to the extent of double bond conversion (crosslinking) that can be expected in this formulation. Next to it, the "Apparent Limiting Degree of Conversion" (LDCa) would reveal the degree of crosslinking that could be anticipated based on the conditions chosen for the run, considering the power available, and the availability of oxygen for inhibition. In this case, the LDCa would be just about the same as the LDC estimated. The software would also show an estimated induction period.
A box in the middle right portion of the screen would show the value of the "Kinetic Chain Length" (KCL) to be used in the computation. The KCL is the number of monomer units converted per free radical generated and it is a crucial parameter of the crosslinking reaction. While the software automatically generates the KCL using proprietary algorithms, the user could change this value by checking the "Alternate KCL" selection box and entering the new value.
To run the experiment, the user would click "Generate Data Sheet." After a short wait, the results of the computation would be presented in a data sheet that could be saved and used as an electronic notebook page to record the experiment.
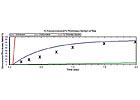
Figure 6. A comparison of the calculated conversion (blue) vs. D-M data (X).
The Data Sheet
The data sheet contains several kinds of data. The first column of data records the formulation and the environmental conditions of the run. A section titled "Contextual Data" provides numeric output from the computation, grouped into subsections for logical consistency. The first subsection is a series of data concerning the degree of crosslinking (LDA and LDCa, plus the time required to reach LDC). Second is information about the formulation, including the functionality of the formulation and the functional density (the concentration of double bonds in moles/cc), as well as the density of the formulation before ("wet" density) and after crosslinking (converted density at LDC). Also recorded in the first column of data are the induction period and the cost of the formulation, which is based on costs entered by the user.In the second column of numeric data are several calculated values generated by the software. The first is a set of "Figures of Merit" (FOM), one for the surface layer, and one for the layer at the bottom of the film. The ratio of these values is also calculated. The FOM values are related to the concentration of free radicals generated during the exposure at the indicated points in the film thickness. They are therefore indicative of the cure at the surface and at the base and can be related, with external data, to characteristics such as surface tack, scratch resistance or adhesion of the film to the substrate. The next datum is the "Line Speed Indicator," which is a contextual indication of how fast a web-based film of this formulation could be cured under the described conditions. When used within the context of several runs (or formulations), the software will correctly rank the runs (formulations) in order of line speed, from slowest to fastest.
Shown next is the "Fraction (of film volume) Reacted to Gel" (Fre), which represents the minimal fraction of the film composition that must be converted to crosslinked material (gel) so that the film can be "developed" by some physical means (for example, by solvent wash-off) to generate a visible image. It represents the minimal response of the system to energy required for effective conversion. Two additional items, if present - "Surface Lost to Oxygen" and "Percent of Coating Lost to Oxygen" - relate to the oxygen inhibition of polymerization and loss of film composition due to this inhibition.
Finally, the last numeric datum is the calculated "Rate of Polymerization" of the composition, quoted in moles/liter-sec. This is related (contextually) to a rate that might be derived from, for example, an RTIR experiment as performed by Decker and Moussa, or from photocalorimetry techniques.
In addition to numeric data, the data sheet produces graphical data that can be related to many standard experimental data sets. The top graph in Figure 4 (p. 17) shows a shrinkage plot, indicating the percent shrinkage that can be anticipated for this formulation as a function of the degree of conversion. The middle graph in Figure 4 shows a "Depth of Penetration" curve. For the case of this very thin film (1 micron), the graphic is somewhat ambiguous, since the monochromatic laser light passes directly to the base of the film. The bottom graph in Figure 4 is a plot of the film absorption spectrum (in blue) convoluted with the output of the light source (in red).
The middle graph in Figure 5 is a plot of the "Ideal Absorption" (in blue) of the formulation convoluted with the light source spectrum (in red). This figure shows what wavelengths of light can be expected to most efficiently cure the formulation. The bottom graph in Figure 5 shows the course of the conversion of the formulation versus time. In blue is the conversion of double bonds (in percent) versus time; in red is the "Fraction Reacted to Gelation," which is depicted as the gel front passes through the thickness of the film. Lastly, in green, is the time course of consumption of photoinitiator. In their paper, Decker and Moussa present a figure showing the conversion curve for this formulation, under the conditions above. Figure 6 compares their data (X) to the conversion curve calculated by the software.
As can be seen from Figure 6, the software does a fair job of reproducing the experimental data. The extent of polymerization matches well to Decker and Moussa's data, and the computation reproduces the data at later times in the polymerization. However, the software does not fit well at early times. The calculated induction period is shorter than Decker and Moussa observed (0.05 seconds vs. 0.16 seconds experimentally), and the software calculates a rate of polymerization of 10 mole/liter-sec vs. the observed value of 5 mole/liter-sec. In addition, Decker and Moussa state that this very thin coating does not polymerize at all if they remove the protective polyethylene laminate coversheet from the film structure and allow oxygen to move freely into the composition and inhibit polymerization. That is, at the laser power used (50 mw/cm2), the rate of initiation is not sufficient to overcome oxygen inhibition. When the exposure environment in the simulation is changed to open the film to air, the software predicts that no polymerization will occur.
Note the differences (circled in red) on the data entry form in Figure 7 compared to the initial scenario when the formulation was in a laminate structure. When the data sheet is generated for the open-to-air conditions, the software warns the user that polymerization does not occur by indicating in red that 100% of the coating thickness has been "lost to air" (see Figure 8)
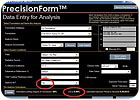
Figure 7. The data entry sheet for analysis of the HDDA/carbamate acrylate formulation while exposed to air. Note the circled conditions and the indication of influence of oxygen on the apparent limiting degree of conversion (LDCa).
How Reliable is the Computation?
Is the result shown in Figure 7 flawed compared to the actual experimental data? D-M showed that this formulation, especially at a thickness of only 1 micron, is very sensitive to the presence of oxygen. Recall that the software calculated an induction period for this run of 0.05 seconds, compared to D-M's observed value of 0.16 seconds. It is possible that the method D-M used to prevent oxygen from entering the film structure, which was simply to lay a polyethylene film over the sample surface, may be ineffective. The software's calculated result would fit much better with the experimental result if the data were shifted to shorter initial time values, in alignment with the calculated induction period. If the polyethylene film was only 1-2 mils in thickness, significant oxygen replenishment can occur over a 2 second exposure time. This could lengthen the apparent induction period. In other examples presented in the D-M paper, most have induction periods in the range 0.03-0.07 seconds, more in line with what the software calculated.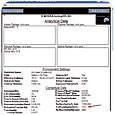
Figure 8. A portion of the output data sheet for the calculation of HDDA/carbamate acrylate in air. Note the complete loss of coating to oxygen inhibition (red arrow).
Optimized Formulations
The new software allows users to optimize formulation performance in several important ways. The speed of a formulation can be optimized while keeping the initiator unchanged, or by substituting new initiators for the initial choice. Additionally, the price of a formulation can be optimized, without sacrificing speed, by judicious choice of initiator; the software can assist in this choice if the user has good data on the prices paid to vendors for photoinitiators. Finally, the formulation performance can be optimized to the light source. If the user has a formulation that needs to remain fixed for whatever reason, the software can explore the use of new exposure sources to increase the speed of the system.Through these and other benefits, the software can help formulators, manufacturers, and finishing engineers in the radiation curing industry improve productivity and shorten the time to market for the delivery of new products.
Glen A. Thommes, Jeffrey Thommes, David F. Eaton and Daniel Mickish are associates of PrecisionCure, LLC, Wilmington, DE, developer of the PrecisionCure radiation-curing software. For more information, visit www.PrecisionCure.com .
Report Abusive Comment