Quantification of Surface Tack
of Next-Generation, High-Gloss, Low-VOC Architectural Binders
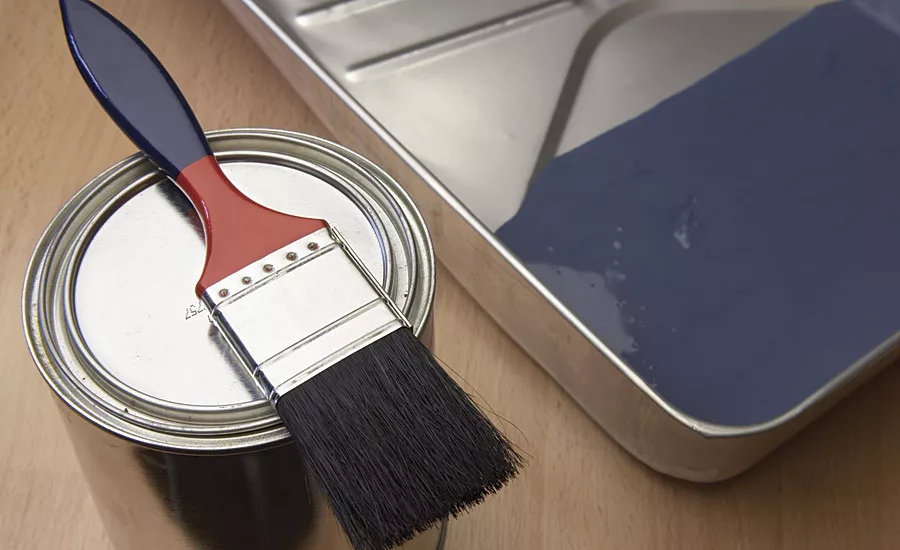

FIGURE 1 » Experimental setup for the tensile tester tack test.

FIGURE 2 » Run schematic for running a tack measurement using the tensile tester tack test.
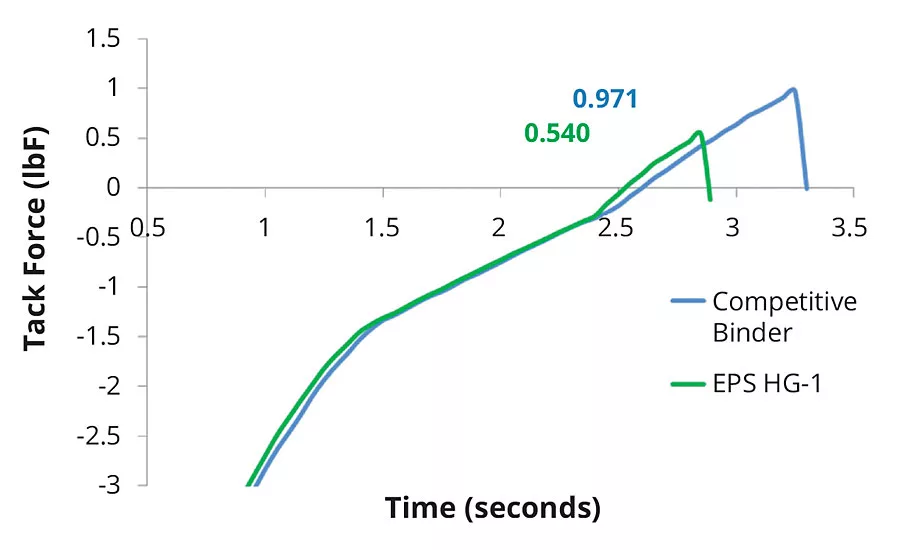
FIGURE 3 » Example of data output for tack force measurements of two separate polymers measured on the tensile tester.
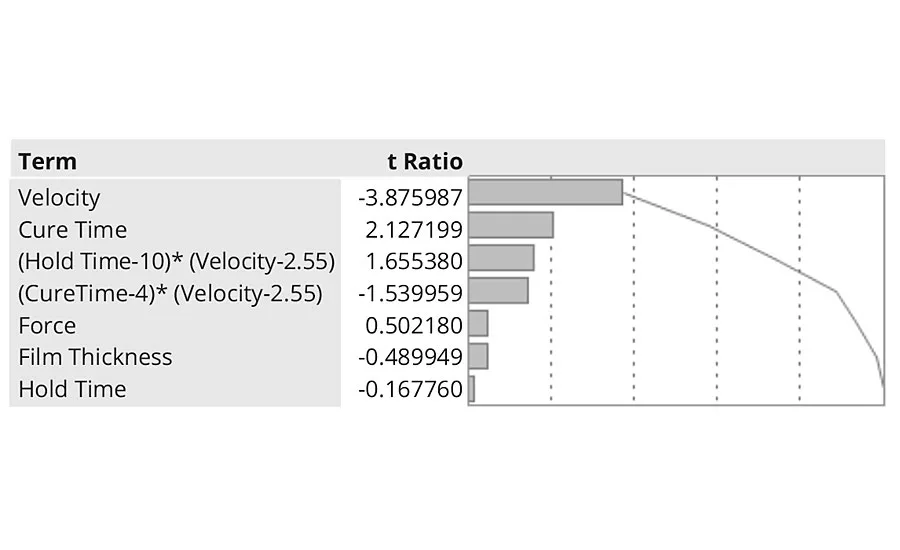
FIGURE 4 » Pareto plot for the DOE for run parameters for the probe tack test on a tensile tester.
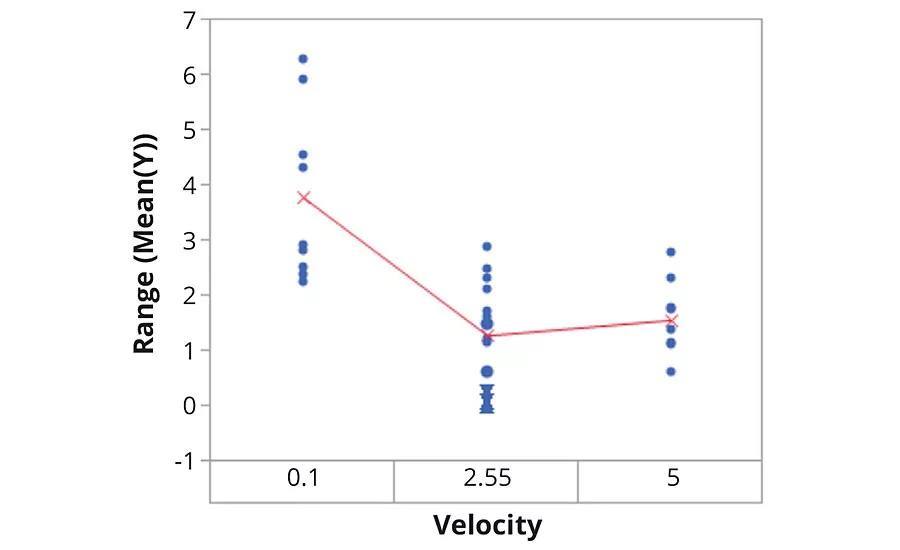
FIGURE 5 » Range of the means of samples by the three different run speeds or velocity for the run parameters on the tack test on a tensile tester.
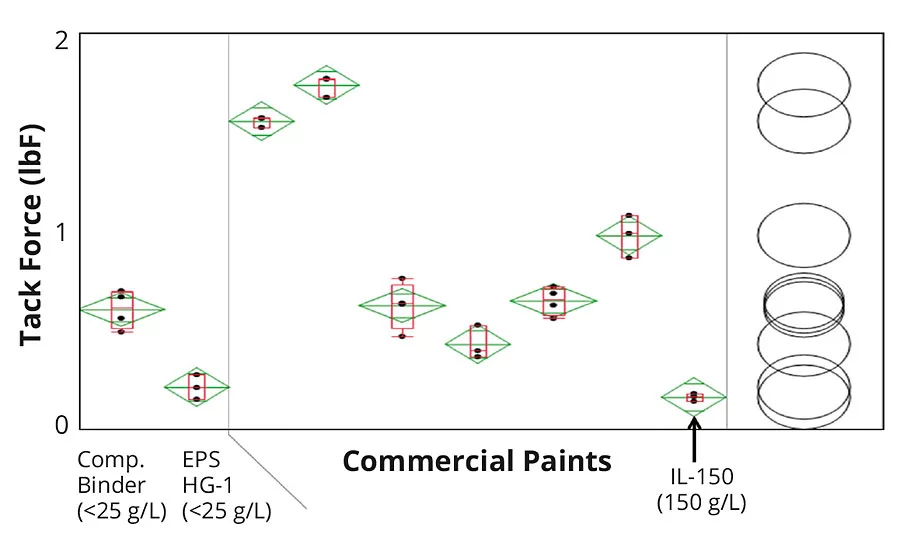
FIGURE 6 » Tack measurements for colorant B for the colorant benchmarking study. The Tukey t-test analysis is represented by circles on the very far right of the graph. Each paint sample is represented by three black data points, a red box plot, and a green mean diamond.
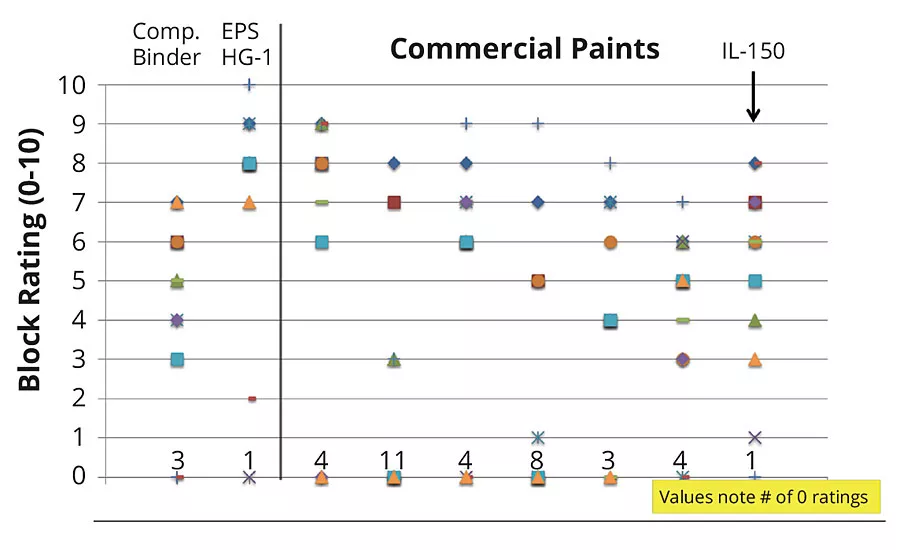
FIGURE 7 » 24-hr HT block resistance for the colorant benchmark study. The 16 HT block resistance rating for each paint base is plotted vertically. The values on the bottom x-axis depict the number of zero values for a given paint base.
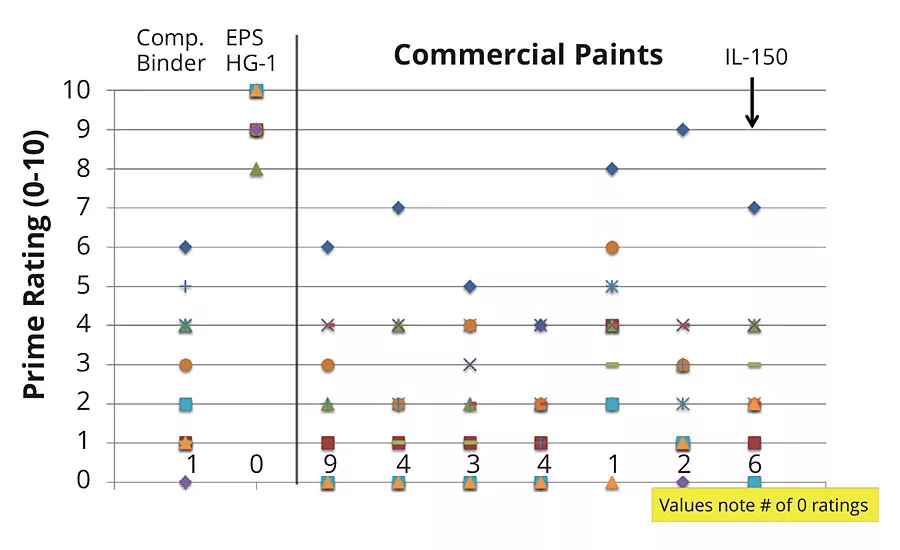
FIGURE 8 » 24-hr HT cheesecloth print resistance. The values on the bottom x-axis depict the number of zero values for a given paint base.
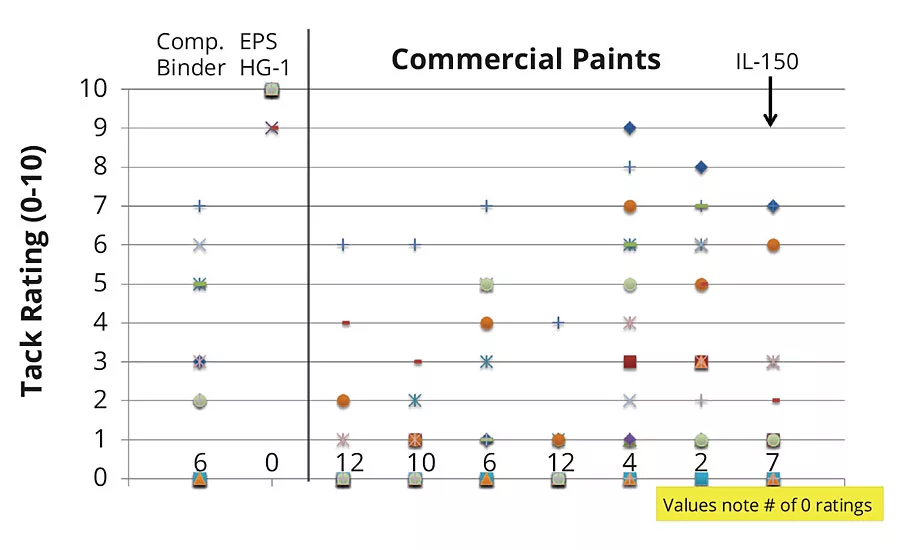
FIGURE 9 » 24-hr HT cotton ball tack resistance. The values on the bottom of the x-axis show the number of zero ratings for a given paint base.

FIGURE 10 » Picture representation for cotton ball tack test for the colorant B paint samples. Each paint base is represented vertically for the four colors tested for this colorant brand.
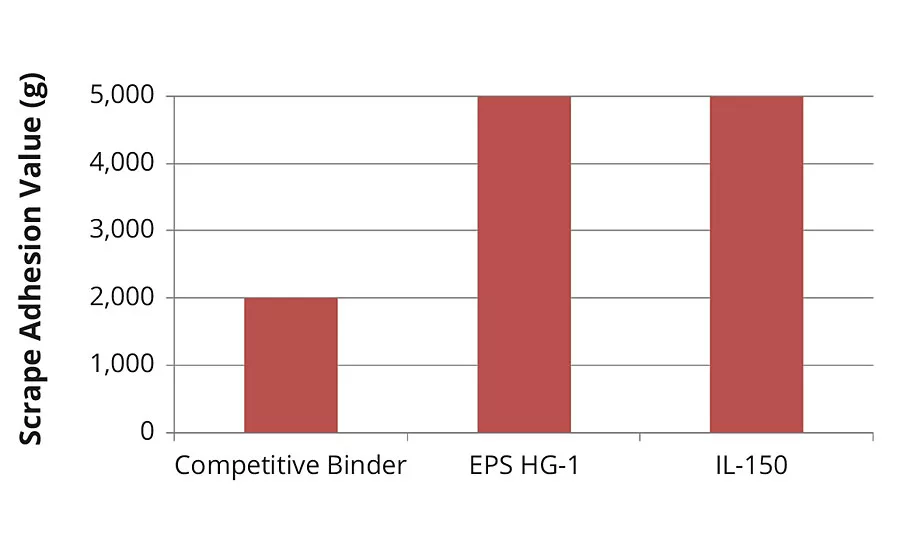
FIGURE 11 » Scrape adhesion values for the red color of the colorant A brand for the competitive binder, EPS HG-1 and IL-150 paints.
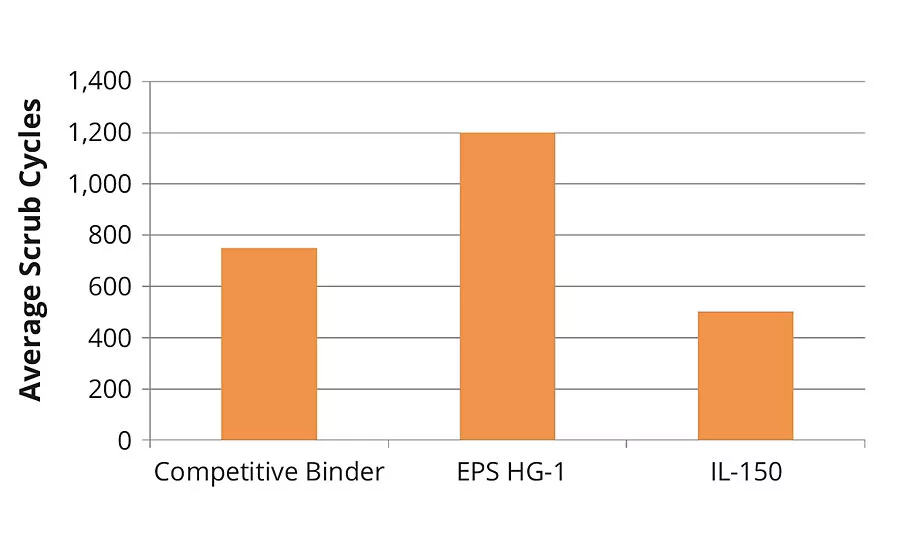
FIGURE 12 » Scrub resistance data for the YOX color of colorant brand B from colorant benchmark study for the competitive polymer, EPS HG-1 and IL-150 paint bases.
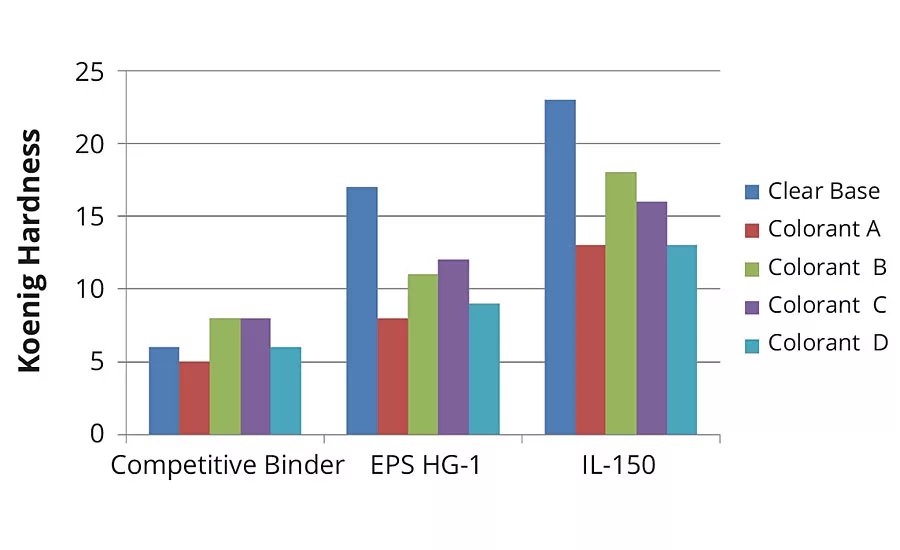
FIGURE 13 » One-day Koenig hardness oscillation values for the clear base (untinted) and YOX paints from each colorant brand for the competitive binder, EPS HG-1 and IL-150 paint bases.
Demand in the architectural coatings market requires new polymers to meet strict hardness properties while maintaining low coalescent demand. In the past, a polymer’s hardness and blocking properties could be improved simply by using higher-Tg monomers and increasing the volatile coalescent amount used in formulating the polymer. Due to changes in environmental awareness, the VOC limitations of architectural paints require less coalescent, less solvent or use of a low-VOC coalescent.1 Meeting the desired hardness at low coalescent demand becomes even more difficult in deep-base paint systems with high loadings of low-VOC colorants that exacerbate the problem. The most common issue with performance in deep-base paint systems with low-VOC colorants is the tackiness and “green feel”. The term green feel typically refers to the paint remaining sticky to the touch even after long cure times. The low-VOC colorants introduce many surfactants, dispersants, humectants and coalescing agents that contribute to this issue. Tackiness is similar to green feel, however this term is used for short-term stickiness that fades over time, and is defined as the ability to form a connection of measurable strength to a substrate under pressure after a short contact time.2 As a result of these issues, there is a market requirement for a low-VOC-capable polymer that functions in low-VOC, colored, deep-base paint systems with low to almost no tack or green-feel. This unmet market need must also be balanced with other common paint properties.
Another important feature of the described low-VOC paint systems is the hardness profile. There are many different methods for evaluating the hardness of a coating, and the variety of tests may lead to different conclusions about the hardness performance.3 Some commonly used tests are Koenig hardness, pencil hardness, block resistance, print resistance, scrub resistance and various tack methods. Each of these methods does not always correlate with the others, which can lead to different conclusions for the hardness of the coating. As a result, the ultimate hardness profile of the coating must be balanced depending upon the application or function required by the end-use consumer. Some other important properties of architectural paints include oil and lanolin resistance, chemical resistance, abrasion resistance, scrape resistance, flexibility and cleanability. If the coatings are to be used in exterior applications they must also withstand heat, temperature changes, moisture, oxygen, sunlight and freeze-thaw cycles.3 A fundamental understanding of the polymer design as it affects the polymer functionality is critical to meet the current demand for architectural coatings. This study develops a test method to measure surface tack to accelerate polymer development for an architectural, high-gloss, interior and exterior paint application with an emphasis on performance in deep-base systems with high loadings of low-VOC colorants. This application space is very difficult for current polymer technology to meet the demand of hardness and low tack while maintaining the other previously described properties. Much polymer development focuses on increasing the hardness of the polymer with the assumption that the tack will improve as well; however, this is not always the case. This study compares the different measurements of hardness and tack to evaluate if a direct correlation can be made. There are many references in literature for different methods to measure tack, including Zapon, peel tack, rolling ball tack and probe tack, as well as subjective hand feel of the coating. Many of these test methods have limitations and are not consistent. This study utilizes the use of a modified probe-tack test on a tensile tester to replace the other subjective tack tests with a quantitative and reproducible measurement for tack. The tensile tester was fitted with a probe fixture to quantify the tack performance of deep-base paint systems with high loadings of low-VOC colorants. Correlation analysis between results of the probe tack test and other hardness tests was used to make conclusions on the overall hardness performance of industry-leading paints and polymers.
Experimental
Colorant Benchmark Study
This study primarily focused on the performance of our high-gloss (HG) polymer technology called EPS HG-1. The EPS polymer was compared to a market-leading competitive polymer and seven commercially available paint bases. The EPS HG-1 and the market-leading polymer were formulated into clear paint bases at less than 17 g/L VOC. The VOC in the formulated clear base paint bases was contributed from one of the dispersants used in the paint formulation. All commercial paints used in the study were marketed as high-quality, high-gloss paints that ranged from 0 to 150 g/L VOC. The commercial paint bases included both interior and exterior versions, and all of the nine bases in the study were tinted with 12 oz of colorant. Out of the seven commercial paints used, an industry-leading, 150 g/L VOC commercial paint for early hardness and low-tack performance at RT, referred to in this article as IL-150, was used as a benchmark comparison for the EPS HG-1 and competitive polymer. All the other commercial paint bases were analyzed; however, direct comparisons will be made only with the IL-150 base. Four different colorant brands were used; the details are shown below:
- Colorant A – Low-VOC universal colorant.
- Colorant B – Low-VOC water-only colorant.
- Colorant C – VOC-containing, glycol-based universal colorant.
- Colorant D – Low-VOC universal colorant.
For each colorant brand, four different colors consisting of red, black, blue and yellow oxide (YOX) were used. A total of 144 paints were made representing all possible combinations of paint base, colorant brand and color.
Development of a Room Temperature (RT) Tensile Tester Tack Test
A tensile tester test was modified with a probe fixture to quantify the surface tack at RT of finished coatings. The device used was a MTS Insight Electromechanical tensile tester. Paint was applied using a 4-mil bird bar on aluminum Q-Panel sheets A-612 (0.025” by 6” by 12”) and allowed to dry for 24 hrs under ambient conditions. After drying, the panels were cut into dimensions of 3 and 5/16’ by 3’. The cut panels were placed with the painted side facing upwards into the test fixture, which was secured in the bottom clamp of the tensile tester. The probe fixture was clamped into the upper fixture with the flat probe surface facing parallel to the paint surface. The probe was then brought into contact with the paint surface under various conditions of force and contact time. After a set hold time, the probe fixture was removed from the paint sample at different separation rates, and the force required to remove the fixture from the paint sample was measured in units of force. The instrument setup and general run schematic used in the study is shown in Figures 1 and 2, respectively. Each tack force measurement was made on a separate panel, and the average of three to six panels was recorded. The optimized run parameters used are described in the results section.
A data output example of two tack-force measurements exported into Excel is shown in Figure 3. The tack force is defined as the maximum force value measured upon removal of the fixture from the paint sample. As discussed in the literature, the lower the tack force measured, the lower the tackiness of the paint sample.4
Statistical analysis was conducted on each sample set to compare if the mean of each sample was different from other samples in the set. Conclusions for tack could only be made on samples tested on the same date, as the impact of drying conditions has not yet been determined. As a result, tack measurements of samples prepared on different days could not be absolutely compared to one another; however, trends in the tack results could be noted based on the use of a control in each test set.
High-Temperature (HT) Block Test
ASTM D4946 test standard for blocking resistance of architectural paints was used. The testing was conducted after 24-hr cure time, in a 50 ºC oven for 30 min with a 1 kg weight.
HT Cheesecloth Print Resistance
Test method ASTM D2064 cheesecloth print resistance for architectural paints was used. The testing was run after a 24-hr cure time, at 60 ºC for one hr with a 500 g weight. After removing from the oven, the weights are removed and the sample with cheesecloth is allowed to sit at RT for 30 min. After 30 min, the cheesecloth is removed and the sample is rated. The rating scale is 0-10, with 10 being no imprinting and 0 representing the cheesecloth being completely printed onto the coating.
HT Cotton Ball Print Resistance
ASTM D2064 for cheesecloth print resistance was modified to use cotton balls instead of cheesecloth. The procedure is the same as the listed ASTM with some modifications: drawdowns (3 mil wet) are made on Leneta charts, and 2-inch squares are cut from the chart at 1 and 7 days. Instead of cheesecloth, ½ of a cotton ball is placed between the paint sample and the bottom of the large end of a rubber stopper. The test is run with a 500 g weight on top of the stopper at 60 ºC for 1 hr. After removing from the oven, the sample is allowed to sit at RT for 30 min. After cooling for 30 min, the cotton is pulled off in one smooth motion. The sample is rated 0-10 for the amount of cotton stuck (0 for 100% cotton stuck, and 10 for 0% cotton stuck).
Statistical Analysis
Statistical analysis was made using Minitab Version 17 or JMP Version 12.1.0. Tukey t-test analysis was used to compare the means of tensile tester tack force measurements of each paint to the other paints in each sample set. This statistical test was only used to compare samples within a data set to make the conclusion if the sample means were statistically different from one another. The test represents each sample by a circle, and if any two circles overlap with an angle of intersection of less than 90 degrees, then the test concludes that the sample means for those two samples are statistically different from one another. The Tukey analysis was used to compare the mean tack force averages of each paint to the other paints in the data set.
Scrape Adhesion Test (Thumbnail Scrape Test)
The ASTM D2197 standard test method for adhesion of organic coatings by scrape adhesion was used with a Gardco Balanced Beam Scrape Adhesion and Mar Testers MODEL PA-2197B with a loop stylus fixture to measure the scrape adhesion values in grams. Typically, the scrape adhesion test is conducted on metal panels; however, the test was modified to be completed on Leneta paper or mylar chart. This removes the metal adhesion aspect of the test and allows for a good comparison of scratching the coating to analyze for hardness. This hardness quantification is similar to a thumbnail scratching of the coating to assess for film hardness failure. One drawback of using the Leneta charts is that the max force on the paper is around 5000 g scrape adhesion value. Above this value, the paper chart becomes damaged and the hardness cannot be quantified accurately. Regardless, between a scrape adhesion value of 500 g and 5000 g, this test provides enough information to show the scrape adhesion performance of paints and quantify the industry-common and subjective thumbnail scrape test.
Scrub Resistance Test
The ASTM D2486 standard test method for scrub resistance of wall paints was used.
Pendulum Hardness Test
Koenig hardness was assessed using a BYK Pendulum Hardness Tester with a Koenig Pendulum in oscillation mode.
Results and Discussion
Development of a RT Tensile Tester Tack Test
Before the colorant benchmark studied was conducted, a test method to quantify the tackiness of paints at RT was needed. The following criterion was used for the development of the test method:
- Quantification of tack and replacing the need to subjectively feel the panels;
- Reproducible and repeatable measurements;
- Correlation of test to subjective feeling of panels;
- Efficient and easy to complete with commonly used test equipment in industry.
Design of Experiment (DOE) for Run Parameters
Run parameters were optimized in a DOE to measure the tackiness of a paint film. The instrument setup with detailed information on the different run parameters is described in the experimental section. The factors of the DOE were:
- Wet film thickness (4, 7 and 10 mil);
- Cure time (1, 4 and 7 days);
- Force (5, 10 and 15 lbF);
- Hold time, or probe contact time (5, 10 and 15 seconds);
- Run velocity, or separation rate (0.1, 2.6 and 5 in/min).
The pareto plot from the design of experiment is shown in Figure 4. The plots of the means of the samples at each run speed, shown in Figure 5, shows that at the lower run speeds, the range of the signal increases. The run velocity was also found to be the most significant factor in the design study. The remaining factors in the DOE other than run speed were set to create the shortest possible run time. The finalized run conditions were:
- Wet film thickness: 4 mil;
- Cure time: 24 hrs;
- Force: 5 lbF;
- Hold time, or probe contact time: 3 seconds;
- Run velocity, or separation rate: 0.2 in/min.
Measurement System Analysis
Multiple gage R+R studies on various paint systems were measured for tack on a tensile tester with the described setup and optimized run parameters. The process variation for the measuring system typically ranged from 10-25% depending on the set of operators and paints. In most cases, the gage studies were conducted with three operators and three paints. The measurement system for tack on the tensile tester was statistically shown to be repeatable and reproducible, and was used in this study to determine the tack performance of paints within a sample set. The tack measurements were only used as comparative measurements to other paint samples in the set, since drying conditions can impact the tackiness of the paint film.
Colorant Benchmark Study
As discussed in the experimental section, this study contained nine bases of 16 paints each, for a total of 144 paints. The three paint bases that will be referenced will be the EPS HG-1 at 17 g/L VOC, a competitive polymer at 17 g/L VOC and the IL-150 at 150 g/L VOC. Data for the remaining commercial paint bases will be presented, however no other individual paint from that set will be labeled other than the IL-150.
RT Tensile Tester Tack Test
The optimized run parameters were used on a tensile tester at RT to measure the tack of paints for the benchmark colorant study in units of force. As previously stated, the lower the force measured to remove the probe fixture from the paint sample, the better the RT low-tack performance of the paint. The YOX color of each paint base for the colorant brand B was analyzed for tack on the tensile tester at ambient temperatures. Tukey t-test statistical analysis, box plots and mean diamonds for the tack measurements made on the YOX paint samples for the colorant B brand are shown in Figure 6. The Tukey analysis was used to compare the mean tack force of each paint to the other paints in the data set. The results show that the performance of EPS HG-1 paint was not statistically different than the IL-150 paint for tack force measurements at RT. The EPS HG-1 polymer was also statistically lower in tack force than the market-leading competitive polymer and most of the other commercial paints. From this data, the conclusion was made that even at 17 g/L VOC, the EPS HG-1 paint had comparable low-tack performance at ambient conditions to the IL-150 paint, and also had better low-tack performance than the remaining paints in the sample set.
HT Block Resistance
The data for the HT block resistance testing is shown in Figure 7. The 16 HT block ratings for each paint base are shown vertically. The competitive polymer, EPS HG-1, and IL-150 paint bases are labeled. Overall, EPS HG-1 had a block rating of 7 or better for 14 of the 16 colorants tested; however, the base had two fails. The competitive binder had six values of less than 4 (small amount of film failure), and three samples with complete film failure. The commercial paints varied but overall performed poorly when compared to the EPS HG-1 base. The IL-150 base performed the best out of the commercial paint bases with one fail and the remaining ratings spread between 1 and 8. The IL-150 base had only four paints rated 7 to 8, whereas the EPS HG-1 base had 14 paints greater than 7 rating. From this, the conclusion was made that the EPS HG-1 paint base at 17 g/L VOC had superior block performance compared to the 150 g/L VOC IL-150 paint base, and other commercial paints and polymers in the sample set.
HT Cheesecloth Print Resistance
The data for cheesecloth print resistance is shown in Figure 8, and the data for the 16 paints for each paint base is represented vertically. EPS HG-1 was rated between 8 and 10 (10 representing no imprint left on paint) for all the 16 paints in the base tested for print resistance. All the other commercial paints and competitive binder were ranked for print ratings of less than 5 on average. The IL-150 paint base was rated with one ranking of 7, six rankings of 0 and the remaining paints in the base of less than 4. The 17 g/L VOC EPS HG-1 paint base was concluded to have superior print resistance compared to the competitive polymer and all the high-quality commercial paints tested.
HT Cotton Ball Tack Resistance
The HT cotton ball tack data for the paints tested in the colorant benchmark study is shown in Figure 9. The HT cotton ball tack values are rated from 0-10, with 10 representing 0% cotton stuck to the exposed paint sample, and a rating of 0 representing 100% cotton stuck. Each of the 16 paints for each base was ranked and the values are represented vertically in Figure 9. The EPS HG-1 paint base was rated 10 (0% cotton remained) for 14 out of the total 16 paints tested, and the other two paints were rated with a value of 9 (10% cotton remained). The IL-150 commercial paint was rated in the HT cotton ball tack test with seven rankings of 0 (100% cotton stuck), and 14 of the 16 paints tested being rated 3 or less (70% or more cotton stuck). A picture of the HT cotton ball tack test results for the colorant B system is shown in Figure 10. Visual assessment of the cotton ball tack test results shows the EPS HG-1 maintained low-tack performance at elevated temperatures. The competitive polymer and commercial paint bases shown in the picture had large amounts of cotton stuck and were rated accordingly, shown in Figure 9. The picture shown is only for the colorant B system; however, the other three colorant brands tested had almost identical results to the one shown in Figure 10. The EPS HG-1 polymer technology maintained low-tack performance in both the RT tensile tack test and the HT cotton ball tack test, whereas the IL-150 paint base was rated to have low-tack performance at RT but failed for tack performance at elevated temperatures. From the two tack tests performed, the EPS HG-1 paint base at 17 g/L VOC was concluded to have the best low-tack performance at both RT and HT testing compared to the other paint bases tested.
Scrape Adhesion Test
The scrape adhesion test was performed at ambient conditions on the red paint sample of the colorant brand A for the EPS HG-1, competitive binder and the IL-150 paints, shown in Figure 11. The goal of this test was to simulate a thumbnail scraping across the top of the coating, and to quantify the amount of force required to scrape the coating off the paper substrate. The EPS HG-1 and IL-150 paints maxed out the scrape adhesion tester capability, with scrape adhesion values of greater than 5000 g. The competitive polymer was deficient in scrape adhesion compared to the other two paints with a value of 2000 g. The EPS HG-1 paint at 17 g/L VOC was concluded to have comparable scrape adhesion performance to the IL-150 paint at 150 g/L VOC. These paints were also tested by a thumbnail scrape test. The EPS HG-1 and IL-150 paint films could not be scraped off by thumbnail, whereas the competitive binder scraped off under low pressure.
Scrub Resistance
Scrub testing was conducted on EPS HG-1, the competitive polymer and the IL-150 paints. The testing was completed on the YOX paints for each base for the colorant B brand, shown in Figure 12.
The competitive binder paint scrubbed for less than 800 cycles, and the IL-150 paint scrubbed for 500 cycles on average. In comparison, the EPS HG-1 paint scrubbed for 1200 cycles. The conclusion was made that at 17 g/L VOC, the EPS HG-1 had superior scrub performance compared to the 150 g/L VOC industry-leading commercial paint and the 17 g/L VOC competitive polymer paint.
Koenig Hardness
Koenig hardness was run on each clear base (untinted) and the YOX paints for the competitive polymer, EPS HG-1, and the IL-150 for each of the colorant brands from the colorant benchmark study, shown in Figure 13.
The Koenig hardness for EPS HG-1 was greater than the competitive binder for all bases tested, and the clear base alone was 11 units higher than the competitive binder. While the Koenig hardness for EPS HG-1 was deficient to the IL-150 paint base, it should be noted that the EPS HG-1 base was a low-VOC formulation. Additionally, at 17 g/L VOC the EPS HG-1 had other superior hardness properties, such as scrub resistance, scrape adhesion, HT block resistance, HT print resistance, RT tensile test tack force and HT cotton ball tack resistance. The IL-150 paint maximized the Koenig hardness but failed in a HT tack test, and was ranked poorly in scrub resistance, block resistance and print resistance. This underscores the point that the Koenig hardness alone does not necessarily correlate with other hardness properties that a customer will rank highly critical to paint performance, and that a balance of the Koenig hardness with other properties must be considered.
Summary
The hardness profile of architectural coatings is a highly debated and challenging property to define. This study utilized multiple hardness and tack testing procedures in order to fully understand the hardness profile of architectural paints. To measure the tackiness of paints, a reproducible and repeatable testing procedure was developed on a tensile tester. The Koenig hardness, which is a commonly used method to analyze the hardness of a coating, did not always correlate with other hardness and tack measurements, especially when subjected to testing at elevated temperatures.
The study was performed on industry-leading, deep-base commercial paints with high loadings of colorant. Also included in this study were a leading competitive commercial polymer and a newly developed high-gloss polymer, EPS HG-1. The paints formulated with EPS HG-1 at less than 25 g/L VOC exhibited an excellent hardness profile in various testing methods including low-tack performance at ambient and elevated temperatures. In comparison, an industry-leading, 150 g/L VOC paint for Koenig hardness, called IL-150, had good low-tack performance at ambient temperatures but failed at elevated temperatures. Additionally, the IL-150 paint was deficient in most of the other hardness properties tested.
Overall, the EPS HG-1 polymer was shown to outperform industry-leading polymers and paints and have the best balance of hardness and low-tack properties that a customer will rank highly critical to paint performance.
References
1 Schuler, B. et al. Structure and Properties of Multiphase Particles and Their Impact on the Performance of Architectural Coatings. Progress in Organic Coatings. 40, 139–150, 2000.
2 Kirsch, S. et al. Interface and Bulk Properties in Films of Phase Separated Dispersion Particles. Progress in Organic Coatings. 45 (2002) 193-204.
3 Koleske, J. Mechanical Properties of Solid Coatings. Encyclopedia of Analytical Chemistry. 1-15. 2012.
4 Çakmak et al. – eXPRESS Polymer Letters. 5 (2011) 1009-1016.
This article was originally presented at the 2016 American Coatings Show/Conference.
Looking for a reprint of this article?
From high-res PDFs to custom plaques, order your copy today!


