Characterization of the Surface Mechanical Properties of Paints and Polymeric Surface Coatings
The mechanical properties of polymeric coatings are often overlooked because researchers are not aware of how modern instrumentation can aid them in understanding how a particular product may survive in service conditions. In many applications the two main considerations are aesthetics and durability, both of which can be directly related to the mechanical properties of the base material. For example, the durability of a paint will depend on its hardness, elastic modulus, scratch resistance, abrasion resistance and on how well it adheres to its substrate. The aesthetic quality of the paint surface will depend on its ability to resist surface scratches and deformations, which will diffract light and cause it to lose its glossy appearance. This paper presents the instrumentation methods required to measure accurate mechanical properties of soft polymeric coating materials that are commonly used in coatings.
Introduction
Single-probe testing devices have been around for many years but only recently have instruments been developed with a resolution adequate for accurately measuring the mechanical properties of polymeric coatings. The challenge of coatings, as opposed to bulk polymers, is that the test probe (or indenter) must not penetrate too deeply into the coating, otherwise the measured mechanical property will not represent the coating only, but will be a composite property of the coating and substrate. In addition, polymeric materials are very soft and so a large indenter displacement will correspond to a very small applied load. This means that the instrument used needs to have a very high load resolution and should be feedback-controlled to minimize the effects of creep.
Previous work(1-3) has shown that the single-probe method can provide significant information about the failure modes of certain polymers. Much work has also been done on automotive clearcoats,(4-7) which is a perfect example of where both aesthetic qualities and durability are paramount to the end-use application. Industrial automotive polymer varnishes are often exposed to harsh environmental conditions yet they are expected to maintain a high-gloss finish for at least five years. In the automotive polymer field, one often hears the terms “mar resistance” and “scratch resistance” used to describe the properties of a particular material. Mar resistance characterizes the ability of the coating to resist damage by light abrasion.
The difference between mar and scratch resistance is that mar is related only to the relatively fine surface scratches that spoil the appearance of the coating. Mar resistance depends on a complex interplay between viscoelastic or thermal recovery, yield or plastic flow, and fracture. Polymers are challenging because they exhibit a range of mechanical properties from near liquid through rubbery materials to brittle solids. The mechanical properties are rate and temperature dependent, and viscoelastic recovery can cause deformed material to change with time. In the case of automotive clearcoat varnishes, for example, the car is manufactured with a very good quality gloss finish.
The car is taken to an automatic car wash and cleaned. Because many car washes have insufficient soap and the rinsing is too short, particles of dirt present in the water actually cause surface scratching of the car body. These scratches are not visible to the human eye (the human eye can resolve scratches with a width of about 10 µm or greater), but when there are many of them, they reduce the gloss of the surface and make it look dull. Modern automotive clearcoats are designed so that small surface scratches actually “heal” over a time period of a few hours, this being caused by complete viscoelastic recovery of the polymer. The same principle is also used in many types of aesthetic coatings where surface scratches would reduce the appearance, e.g., nail varnish, consumer electronic device coatings, paints, etc. In order to simulate such small scratches and actually get a quantitative value for viscoelastic recovery at this scale requires instrumentation with sub-nanometer depth resolution and nano-Newton load resolution.
 Credit: CSM Instruments Credit: CSM Instruments
|
| Figure 1 Click to enlarge |
Methodologies
The three most common test methods for assessing the mechanical properties of polymeric coatings are indentation (to measure hardness and elastic modulus), scratch testing (to measure coating integrity, scratch resistance and viscoelastic properties) and wear testing (to measure frictional properties and wear rate). The principle of each method is explained and its particular importance to polymers.
Indentation Testing
Most people are familiar with conventional hardness testing, where an indenter of known geometry (usually Brinell, Rockwell, Vickers or Knoop) is pushed into the sample and the size of the resulting impression is measured through an optical microscope. The hardness is measured by dividing the applied load by the calculated residual contact area. This works well for bulk materials where the applied loads are generally high and the residual imprint is easily located under the optical microscope. However, with soft polymeric materials, their viscoelastic properties cause the residual imprint to recover after loading and it is therefore very difficult to get meaningful data. Additional problems arise when one wants to measure the hardness of a thin polymer film without any effect from the substrate on which it is deposited.
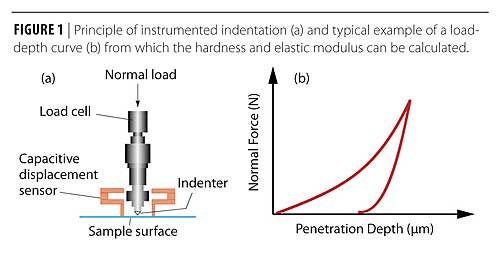
Because of the aforementioned limitations of conventional indentation methods, instrumented indentation has been developed over the last few years. The methodology is the same, i.e., an indenter pressed into a surface, but with the instrumented technique the load and depth of the indenter are continuously monitored over the entire loading-unloading cycle. This provides a load-depth curve, which is a “fingerprint” of the mechanical properties of the tested material, from which the hardness and elastic modulus can be calculated (the modulus is computed from the initial tangent of the unloading curve). This means that imaging the residual imprint is no longer a requirement of the method and thus very low loads can be applied to very small material volumes to give quantitative property values. Because instrumented indentation instruments are completely software controlled, they are able to make single-cycle, multicycle and Dynamic Mechanical Analysis (DMA) measurements and the loading/unloading rates can be accurately controlled. Instrumented indentation is covered in ISO 14577 and ASTM E 2546-07.
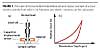
In the case of polymeric materials that are very time-dependent, significant additional information can be gained concerning the materials’ response to elastic and plastic deformation. Because polymers tend to be much softer than other engineering materials, the applied loads are commonly in the milli-Newton range and penetration depths in the nanometer range. The basic principle of an instrumented indenter (or Nano Hardness Tester) is shown in Figure 1a,where the load is applied by a load cell and the resultant displacement is measured by a capacitive sensor. A typical load-depth curve is displayed in Figure 1b.
Scratch Testing
 Credit: CSM Instruments Credit: CSM Instruments |
| Figure 2 Click to enlarge |
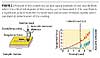
The scratch test is similar to instrumented indentation, except that the sample is displaced during application of the load. By careful control of the instrument, this allows the user to make a constant load, progressive load or incremental load scratch with a predefined length and loading rate. State-of-the-art instruments have active force feedback control to ensure that the load is correctly applied even over curved or rough surfaces. During scratching the frictional force (or tangential force) between the indenter and sample surface is recorded and an acoustic emission sensor captures any noise that might be produced when the tested coating starts cracking (this is most useful for brittle coatings, such as a weather embrittled exterior varnish). The basic principle of a scratch tester is shown in Figure 2, as well as a typical result.
Most interesting for polymers is that such instruments also provide pre-scan and post-scan profiling of the surface. The pre-scan consists of scanning the indenter over the surface with the lowest possible applied load to give the topographical profile. The scratch test itself is then launched along the same path during which the penetration depth (PD) is measured. After the scratch test is completed, the indenter is then scanned back along the scratch with the same low applied load as for the pre-scan. This final post-scan gives the residual depth (RD), which is a measure of the viscoelastic relaxation of the material. In order to take into account the original sample surface, the true PD and RD data sets are recalculated after having subtracted the pre-scan. If viscoelasticity is to be investigated as a function of time then the post-scan can be performed at predefined time periods after the scratch test.
In scratch testing, the indenters used tend to be spherical in geometry, and various different sizes can be used to increase/decrease the contact pressure and therefore the severity of the scratch. With regard to aesthetic polymer coatings, the relationship between scratch morphology and visibility is very complex since many variables are involved including basecoat color, lighting, orientation, duration of inspection, psychological factors, as well as size and type of damage. Some previous work has focused on evaluation of mar and scratching by optical characterization methods,(8) whilst others have investigated the effect of scratches on user perception by using statistical means.(9)
With the latter, the main objective was to address several fundamental questions such as what are the types (plastic or fracture) and sizes of scratches that can be seen by the human eye at a given condition. In this case, a range of constant load scratches was made using loads below and above the fracture threshold for that particular polymer. A selection of typical users of the product was then shown the test panel for different lengths of time and asked to count all visible scratches. Conditions were chosen to simulate the worst case scenario for visibility: a black basecoat and light intensity equivalent to the midday sun. Scratch testing on polymers is specifically covered by ISO 19252 and ASTM D 7187, which is focused on “Test method for measuring scratch/mar behavior of paint coatings by nanoscratching”
 Credit: CSM Instruments Credit: CSM Instruments |
| Figure 3 Click to enlarge |
Wear Testing
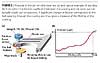
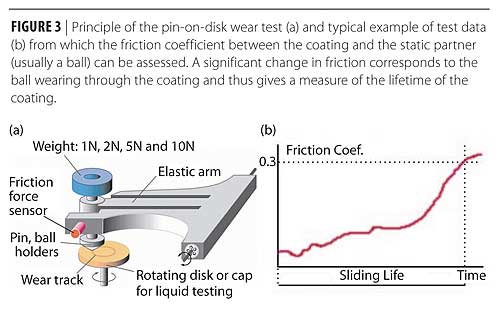
The pin-on-disk wear test is performed using an instrument known as a Tribometer, a schematic of which is shown in Figure 3a. The sample is mounted on a chuck that can be rotated at a predetermined speed. A ball or other static partner is mounted in contact with the rotating sample via an elastic arm that can move laterally and therefore measure the friction between sample and ball with a sensor. The data acquisition system records the frictional force as a function of time or number of revolutions, although it is often recalculated so that actual friction coefficient (µ) is displayed on the same axes. A typical example is shown in Figure 3b.
Once a test is complete, the actual wear rate of the sample and partner can be calculated by one of two ways: the first is to use a profilometer to measure the profile across the wear track and calculating the sectional area removed. If this is multiplied by the wear track circumference then the volume of material removed can be calculated, and thus the amount removed as a function of time, the wear rate (usually quoted in mm3/N/m) found. The second method is to weigh the sample before and after testing with a highly accurate balance and calculate the material removed, although this method is more problematic because the debris produced during the test must be completely removed to prevent significant error.
 Credit: CSM Instruments Credit: CSM Instruments |
| Figure 4 Click to enlarge |
This is often difficult with polymers because the debris tends to stick to both surfaces. Most Tribometers now offer both rotation of the sample and/or linear reciprocating movement of the sample. The choice will depend on the end use application. Useful standards for this test include ASTM G 99, ASTM G 133 and DIN 50324.
Applications
Indentation Testing
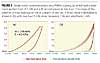
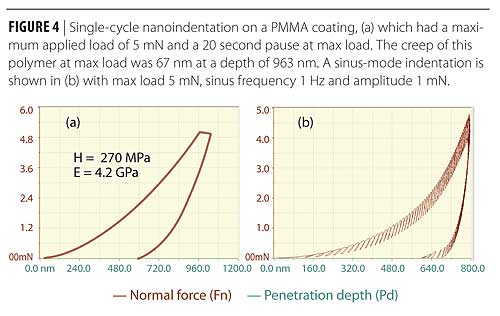
The beauty of instrumented nanoindentation is that the loading and unloading portions of the test cycle are fully user-programmable, as well as any intermediate portions such as a pause at a certain load or depth. A standard test on a polymer might consist of a load-unload cycle with a pause at the maximum applied load to investigate the creep properties of the material. A typical example of a test on a PMMA coating is shown in Figure 4a where the maximum load is 5 mN with a 20 sec pause before unloading. From this curve, values of hardness (H) and elastic modulus (E) have been calculated as 270 MPa and 4.2 GPa respectively. The creep of the material at maximum load was 67 nm at a depth of 963 nm.
In order to obtain further mechanical properties of this polymer that relate to its viscoelasticity, it is best to use DMA or a dynamic indentation test procedure. A small amplitude force oscillation is superimposed onto the applied load signal and the resultant displacement amplitude is measured. From the phase shift between force and displacement, several mechanical properties (including H and E) can be measured as a continuous function of depth in a single indentation. An example of a dynamic test result on the same PMMA coating is shown in Figure 4b where a sinus frequency of 1 Hz has been used with amplitude 1 mN.
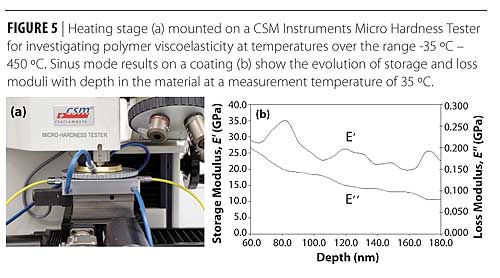
Viscoelastic polymers will show some elastic (energy storage) and some viscous (energy loss) behavior. The stress induced in such a material subjected to a sinusoidal strain will be out of phase by a certain angle. The magnitudes of the elastic response and the viscous response are therefore used to define the storage (E’) and loss (E’’) moduli. The storage modulus can be regarded as being nearly equal to the stress relaxation modulus. The loss modulus tends to be small in regions where the storage modulus shows a plateau but will increase when a transition occurs. This approach assumes linear viscoelastic behavior, i.e., the storage and loss moduli are independent of the imposed strain amplitude (this assumption is valid for most polymers provided that the strain amplitude does not exceed approximatey 0.5 – 1.0 %).
 Credit: CSM Instruments Credit: CSM Instruments |
| Figure 5 Click to enlarge |
Control of the sample temperature is crucial when measuring storage and loss moduli as they are both temperature dependent. Modern instruments often have optional heating/cooling modules to allow accurate control of the sample temperature (Figure 5a). For example, a test might consist of maintaining constant frequency while the temperature is ramped over the region of interest. In this way, specific transitions can be monitored, e.g., where the polymer changes from a hard condition to a viscous/rubbery condition (the glass transition temperature, Tg).
Dynamic indentation testing can also be used for investigating creep and fatigue properties. In a typical dynamic creep test, the indenter is oscillated at a predetermined amplitude and frequency during the holding segment of the load-depth cycle. Time-dependent deformation occurs when the indentation displacement increases while the mean stress (measured hardness) decreases. In a typical fatigue test, large amplitude oscillations are used to obtain fatigue deformation and damage. Changes in contact stiffness will represent formation of damage and can be monitored until failure occurs. The number of cycles to failure can then be determined from the elapsed time.
 Credit: CSM Instruments Credit: CSM Instruments |
| Figure 6 Click to enlarge |
Scratch Testing
The most common type of scratch test consists of progressive loading up to a maximum value. Optical microscopy is then used to correlate a particular event (such as coating delamination) with one of the measured signals: Penetration depth (Pd), Residual depth (Rd) and Frictional force (Ft). Examples of scratch tests on three typically different, yet common, polymeric coatings are shown in Figure 6.
Optical microscopy usually provides significant additional information as to the method of failure of the coating and an idea of the severity of the resultant plastic deformation. For example in Figure 6, material (a) fails in a distinct and brittle manner, producing large amounts of debris that will diffract light and make the surface look rough.
 Credit: CSM Instruments Credit: CSM Instruments |
| Figure 7 Click to enlarge |
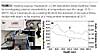
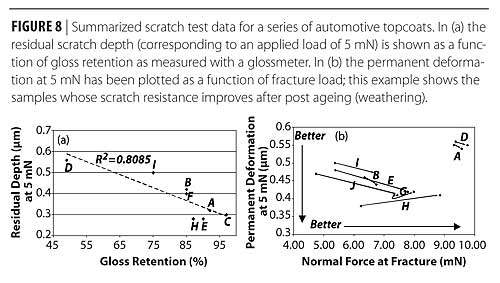
Some results on automotive coatings are shown in Figures 7 and 8 and come from a study that consisted of selecting 10 different materials that were all high-bake (140 ºC) polymer topcoats. They consisted of a pigmented basecoat (thickness = 12 µm), which was applied first, followed by the clearcoat (thickness = 45 µm) and subsequent baking. The base ingredients of each sample consisted of acrylic, melamine, urethane, silane and carbamate. The samples were evaluated as “unweathered” and “weathered”, the latter consisting of 400 h in a Xenon Arc weatherometer using borosilicate inner and outer filters. Such filters give a better equivalent spectra to sunlight and 400 h is approximately equal to three months in service. This is also the period of time in which customers provide the manufacturer with feedback on the quality of their vehicles.
 Credit: CSM Instruments Credit: CSM Instruments |
| Figure 8 Click to enlarge |
The results presented in Figure 7 show progressive load measurements over the range 0 – 20 mN on two different topcoats. The pre- and post-scan modes of the CSM Instruments Nano Scratch Tester were used in order to plot the penetration depths during the scratch tests and thus evaluate the level of viscoelestic recovery after the tests. Clearly, sample A shows a greater relaxation than sample B and much less plastic deformation along the sides of the scratch path. The greater the deformation, the more gloss is lost from the surface of the coating.
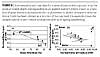
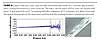
A typical correlation between residual scratch depth and gloss retention is shown in Figure 8a where eight of the tested samples appear to form a linear relationship for tests carried out at a constant load of 5 mN. Note that these results are for unweathered samples.
Figure 8b demonstrates that for some samples, the scratch resistance improves after weathering. In this example, two points are plotted for each sample with an arrow denoting the transition after the weathering period; in certain cases (samples E, H and J) the applied load required for coating fracture is significantly increased. Such a phenomenon could be explained by a hardening of the coating as a result of the weathering process, or chemical modifications due to UV exposure.
In polymers such as automotive topcoats, there are three fundamental deformation mechanisms: elastic deformation, plastic deformation and fracture. There are also complex, time-dependent relaxation phenomena (visco-elastic and visco-plastic) for polymer coatings. Elastic deformation does not result in permanent damage and will not affect the appearance of the coating. Plastic deformation and fracture are the two damage mechanisms that will have an effect on the coating appearance, and these two mechanisms are related in a very complicated fashion but usually compete and constrain each other. When fracture occurs, elastic energy built up during the loading process is released. The majority of the energy is used to produce new material surfaces as cracks propagate into the coating. Plastic deformation changes the shape of the material with only minimal change in surface area. During plastic deformation, energy is dissipated and heat is generated.
 Credit: CSM Instruments Credit: CSM Instruments |
| Figure 9 Click to enlarge |
The energy dissipation of plastic deformation impedes elastic energy built up and prevents fracture. It is difficult to evaluate mar resistance based on a single quantity because of the two different deformation mechanisms involved. In addition, the two deformation mechanisms result in different morphology and visual effect. Many currently used ‘mar’ tests do report a single number for mar performance with no regard for the mechanism of damage. Such tests ignore the different visual impact that different scratch morphologies may produce.
In the scratch test, the indenter can be driven through all three regimes of deformation, from elastic to plastic and finally to fracture. The mechanical thresholds between different deformation regimes are obviously the most important in evaluating mar resistance of materials. The threshold from plastic deformation to fracture indicates the magnitude of resistance against fracture damage. The fracture thresholds are easily obtained from a scratch test, by finding the first abrupt fluctuation where fracture occurs.
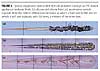
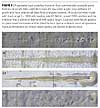
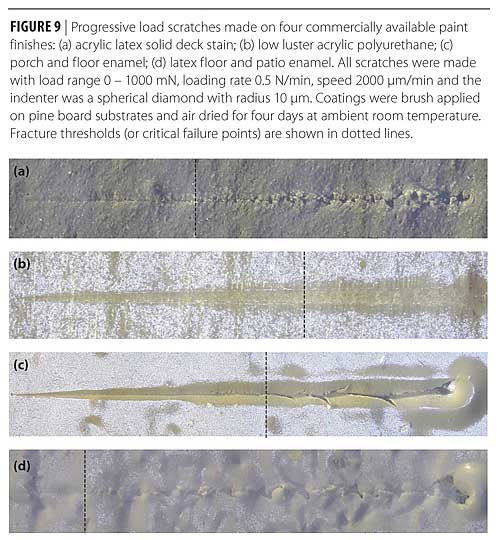
The onset of fracture will vary significantly depending on both the coating and the substrate, which is why it is always recommended that a coating be tested on the substrate which is intended for the end-use application. Examples of differing fracture thresholds are illustrated in Figure 9, which shows progressive load scratches on four commercially available paint finishes. As these paints are all destined for application to wood substrates, the tests themselves were performed on pine boards that had been brush coated and air dried. The dry time is always important when assessing polymeric materials as they will cure and harden over quite significant time periods (some automotive finishes are only considered “hard” 6 months after deposition!). In these four examples, the differences between them are very apparent: sample (a) and (d) fail by repeated rupture of the coating, whereas sample (c) tends to crack and sample (b) only fractures with very small cracks which are hardly visible at this low magnification. If these four samples were subjected to gloss tests or consumer studies then sample (b) would probably be the best in terms of visible damage to the surface.
 Credit: CSM Instruments Credit: CSM Instruments |
| Figure 10 Click to enlarge |
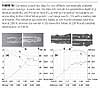
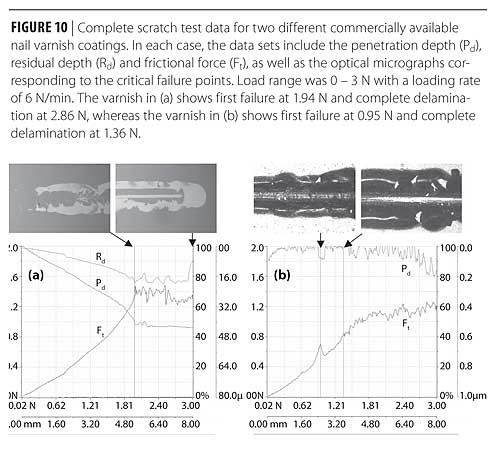
Most of the polymeric coatings so far mentioned have been relatively soft but some commercially available polymeric finishes can show quite brittle properties. Figure 10 shows two different nail polish coatings: sample (a) is noticeably brittle in nature and the micrographs confirm that delamination occurs immediately without any transition phase where cracking might occur. In addition, the delaminated area extends around the scratch, which suggests that there might be significant residual stress in this coating-substrate system. The results graph for sample (a) shows that some viscoelastic recovery has occurred after scratching (seen as the difference between the Pd and Rd signals). For sample (b) the optical micrographs show that this varnish has a very different deformation mode, characterized by significant plastic deformation along the edges of the scratch. It can also be observed that sample (b) fails at a much lower load (and at a much lower penetration depth) than sample (a).
All these examples demonstrate the power of the scratch test for measuring relevant mechanical quantities during formation of damage, as well as the high accuracy and reproducibility of this quantitative method.
Wear Testing
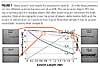
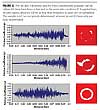
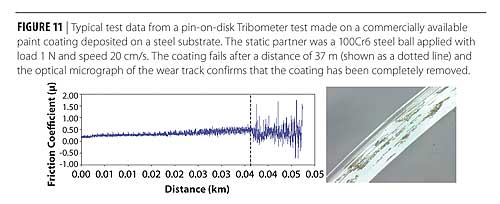
The advantage of a wear test, when compared to indentation or scratch testing, is that it can give a measure of the lifetime of a particular polymer coating-substrate system. In many coating applications, the resistance to wear can be more important than the load required to permanently damage the material. A typical set of data is shown in Figure 11, for a pin-on-disk test made on a paint sample. The graph of friction coefficient versus distance shows a steady value of friction until the coating fails (i.e., is completely worn away). The onset of failure corresponds, in this case, to a distinct change in the friction signal, due to breakdown of the coating and formation of a tribological transfer film, which is a mixture of the coating, substrate and static partner materials mixed together. The coating properties being tested and the substrate on which it has been deposited will influence the friction signal when the coating is worn through: in some cases this signal will rise dramatically, in others it may drop. Whichever the change, the coating breakdown will nearly always manifest itself as a sharp change from the steady sliding state.
 Credit: CSM Instruments Credit: CSM Instruments |
| Figure 11 Click to enlarge |
In the example shown in Figure 11, the coating has failed after a sliding distance of 37 m and subsequent optical microscopy of the wear track shows that the coating has been almost completely removed. A profile across this wear track would enable the worn sectional area to be calculated and thus the wear rate of this coating material. The choice of applied load and geometry of the static partner will determine the lifetime of the coating. If one wants to simulate harsh conditions then a higher load and smaller static partner radius may be used in order to increase the contact pressure and make the coating fail sooner. On the other hand, one might want to evaluate the evolution of the friction coefficient over a long period of time without damaging the coating, in which case a lower load and/or larger contact geometry might be chosen.
In addition to evaluating the frictional and wear properties of the coating, it is sometimes interesting to evaluate the said properties as a function of atmosphere, temperature and in dry/liquid environments. CSM Instruments Tribometers are equipped to handle samples that are completely submerged in a particular liquid and have the capability to perform tests up to 1000 ºC. Atmospheres can also be pumped into the machine if required, e.g., Argon, N2, etc. High-vacuum Tribometers are also available for evaluating coatings, which may be used in space or vacuum conditions and are capable of vacuums down to 10-7 Torr.
 Credit: CSM Instruments Credit: CSM Instruments |
| Figure 12 Click to enlarge |
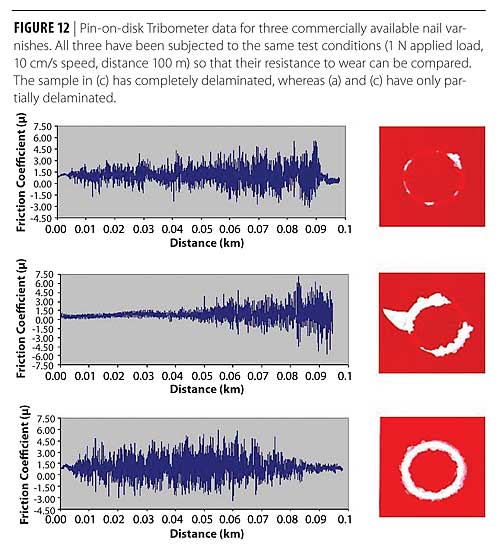
A selection of wear test results on three different nail coating samples are shown in Figure 12. All three samples were prepared with the same thickness, were deposited on the same substrate and were tested with identical measurement parameters in order to be able to directly compare their resistance to wear. The criterion in this set of tests was to investigate the resistance of the coating after a sliding distance of 100 m with 1 N applied load and a speed of 10 cm/s. For a wear track with a diameter of 10 mm, this total distance corresponds to 1592 rotations (or laps) of the sample and the test duration was approximately 17 minutes.
In this example, the friction traces do not show a distinct point where the coating has broken down, but the subsequent optical microscopy images show clearly how much of this red colored coating remains in each case. Sample (a) has only slightly delaminated at the end of the test, whereas sample (c) has completely delaminated. Sample (b) shows almost complete delamination and some quite jagged edges along the wear track which suggest that this particular varnish is rather brittle in nature.
Conclusions
This paper has presented the latest state-of-the-art instrumentation methods available for characterizing the mechanical properties of polymeric coating materials. Several examples of tests performed on common commercially available coatings have been presented in order to highlight the applicability of each type of test. In most end-use applications of coatings, the appearance remains one of the main criteria and it has been shown that the mechanical properties of such materials can be directly correlated to their aesthetic quality. By understanding how the material deforms, the researcher can develop a coating that will be most suited to the in-service conditions that it will encounter. Understanding the adhesive properties of the coating-substrate combination will allow a better choice of coating for a particular substrate type.
For more information, contact Dr Nicholas X. Randall at Tel: 781/444.2250; Fax: 781/444.2251; e-mail nra@csm-instruments.com or visit www.csm-instruments.com.
Looking for a reprint of this article?
From high-res PDFs to custom plaques, order your copy today!

