Infrared Spectroscopic Analysis of Modified Rosin Ester Resins
The advantages of IR spectroscopy include rapid and accurate analyses due to fast and reproducible sample preparation. Longer tests lengthen production cycles, raise costs and lower output. This paper discusses the development of quick, easy, reproducible sample preparations that involved little waste for both MIR and NIR analyses of hard, modified resin materials. The goal was to develop qualitative tests that would be able to distinguish quality of resin with respect to functional groups within and between vendors, to identify chemical differences between the materials, and to investigate the feasibility of determining the effect of chemical content on physical properties.
 Credit: Sun Chemical Credit: Sun Chemical
|
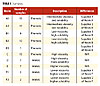
| Table 1 Click to enlarge |
Natural resins or rosins are modified to produce certain desirable characteristics such as viscosity and solubility. The resins studied here had been phenolic or maleic anhydride modified. NIR has been used to monitor resin modification, to quantify viscosity and cloud point physical characteristics, and to measure acid and hydroxyl number chemical characteristics.(1) Other methods have been used to analyze these types of materials, including density and refractive index,(2) analysis by mass spectrometer (as methyl esters of the native rosin acids),(3) pyrolysis- and simultaneous pyrolysis methylation-gas chromatography/mass spectrometry techniques,(4) matrix-assisted laser desorption/ionization mass spectrometry(MALDI-MS),(5) and matrix-assisted laser desorption/ionization time-of-flight mass spectrometry (MALDI-TOF-MS).(6)
Experimental
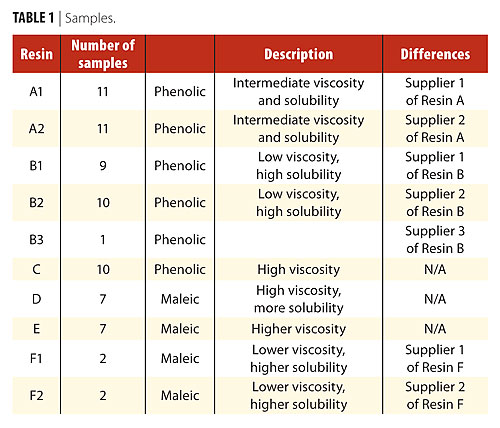
Seventy samples of modified resin raw materials representing six different raw material classes from various vendors were analyzed. These are listed in Table 1. All of the samples were maleic and phenolic modified, but those in the table marked “Maleic” had spectral bands due to unreacted maleic anhydride.
A quick, clean method of preparing several grams of samples was developed. Though using a mill or other grinder would probably produce more uniform samples, the resinous material would be hard to clean from a mill. To create fast yet relatively clean sample preparations, the resins were crushed by hand in weighing paper using a pestle or similar device until powdered. In a few minutes, the samples could be crushed enough to produce relatively reproducible spectra, though the entire sample was not completely powdered, and particles about 1 mm3 remained.
The spectrometer used for the MIR analyses was the Thermo Nicolet Magna 550 with a Golden Gate diamond crystal attenuated total reflectance (ATR) device. Using the powdered resins and the diamond anvil yielded easy and reproducible sample preparation technique and reproducible results. TQ Analyst (Thermo Fisher Nicolet) was used for the MIR chemometric analysis. A discriminant analysis of all 10 samples was done on second derivative (segment 5 gap 1) 3800-2550 and 1800-600 cm-1 regions of the MIR spectra with multiplicative scatter correction (MSC) with TQ Analyst. Ten principal components (PCs) were deemed optimal by the algorithm, but three worked well. One third of the spectra were used as validation samples, though none of the B3 or F samples were used because there were so few of those. The same math treatments were used to develop a classification based on distance. This calibration was developed without the A2 samples. The correlation to the physical data was done with TQ Analyst using constant pathlength, second derivative with Norris derivative filter with segment 5 and gap 5.
For the near-infrared (NIR) spectra, the Foss XDS (NIR) spectrometer was used with the XDS rapid content analyzer (RCA). The crushed samples were put in vials, and then shaken and tapped to encourage the smaller particles to go to the bottom of the vials to make the spectra more reproducible. The spectra were taken by reflection through the bottom of 7-dram shell glass vials. Unscrambler® and Vision® software were used for the data analyses. The spectral math treatment used was second derivative (segment = 9, gap = 0) to remove particle size variation. The segment size, in nanometers, defines the smoothing segment and the gap in nm defines the gap used for the derivative. Multiple spectra were taken of each sample. No rigorous analyst reproducibility testing was done, but samples prepared by three different analysts showed no analyst-related distinctions in identification and qualification. An identification and qualification method was created for the NIR spectra using Vision software. The method used residual variance in principal component space 1100-2500 nm, standard normal variate (SNV) and second derivative math pretreatment using segment = 10, gap = 0, with probability level 0.90, and cumulative variance 95%. Unscrambler software was also used for analyzing the NIR spectra. Using second derivative with segment = 9 gap = 0, eight principal components were required for principal component analysis (PCA).
Solutions were made of each of the resin lots and analyzed using a Novocontrol-Thermotronic Automatic resin cooker, Model D56414. These test solutions can then be measured for viscosity. The procedure is as follows: Into a tared Thermotronic test tube with spinbar, weigh 20 grams of crushed resin (chunk size of no larger than 5 mm using a mortar and pestle) and 40 grams of alkali refined linseed oil, the same lot used for all samples to minimize variation. These materials are weighed to the nearest hundredth of a gram. Using a P-5 setting puts the resin in complete solution at 425 °F. These solutions were cooled to ambient temperature and subsequently measured for tan delta, delta, and viscosity (0.25 sec-1 and 30 °C) using a TA cone and plate rheometer with geometry of 4 cm in diameter and a 4 degree cone angle. The bubble seconds were measured at 25 °C using Gardner bubble tubes of a test cook of two parts linseed oil and one part resin.
Results and Discussion
These resin materials consist of rosins generally with fused aliphatic rings with C=C bonds and acid functionality that have been reacted with phenols or maleic anhydride to form phenolic or maleic-based resins. Esterification and maleation reactions do not always go to completion, leaving carboxylic acid, hydroxyl or anhydride functionalities. The number of hydroxyl and acid groups present varies among resin types and is important in their characterization.
 Credit: Sun Chemical Credit: Sun Chemical |
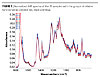
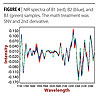
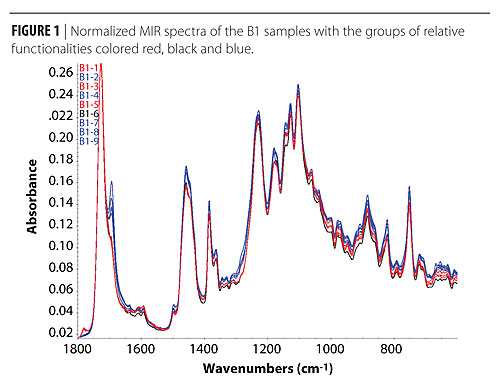
| Figure 1 Click to enlarge |
The first step in developing spectroscopic identification/qualification and quantitative tests is to examine the spectra for consistency related to the sample preparation. The second step is to determine whether differences between samples can be detected and whether they are significant. Aside from some small variation in the spectra due to variations in sample presentation to the instrument, there were clear differences among the spectra in the subsets of samples, of what was supposed to be the same material from the same vendor. These differences indicated varied chemical content and quality of material. For example, the B1 sample MIR spectra are shown in Figure 1 and indicate the samples can be divided into groups of distinct chemical composition. Samples 1, 3, and 5 formed one group, samples 2, 4, 7, 8, 9 formed a second group, and sample 6 formed a third type of sample. The groups differed in relative concentrations of anhydride (bands around 1781 cm-1), acid (bands around 1693 cm-1), and hydrocarbon (bands around 1458 cm-1) among other differences. This indicated that this vendor No. 1 was providing materials of different composition. The next step would be to determine whether these differences significantly affect the final product specifications and quality.
 Credit: Sun Chemical Credit: Sun Chemical |
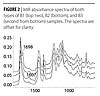
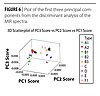
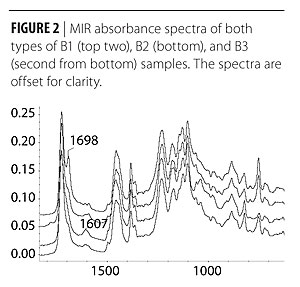
| Figure 2 Click to enlarge |
Vendor No. 2 provided the B2 materials that were supposed to be the same as the B1 materials, but they were different from the three types of B1 materials, having even less relative amount of acid (IR spectral band around 1693 cm-1) and no anhydride, among other differences. There was one B3 sample from a third vendor, and the spectra indicated it had relatively more ester and aromatic functionality, less acid, and no anhydride than the other B1 and B2 samples (Figure 2).
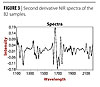
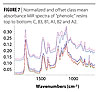
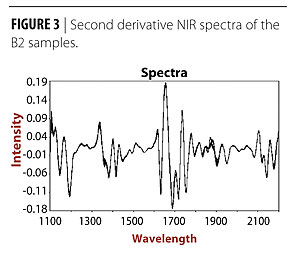
The NIR spectra showed distinct differences among the B2 samples. The second derivative spectra in the region 1100-2200 nm are shown in Figure 3 and illustrate the general differences in the NIR spectra of all of the sample groups.
 Credit: Sun Chemical Credit: Sun Chemical |
| Figure 3 Click to enlarge |
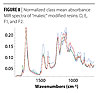
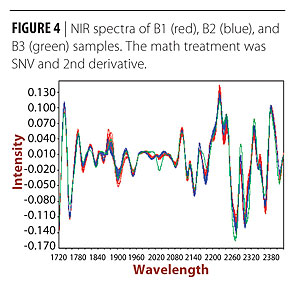
Despite these differences within the B2 group, there were some regions where the B1, B2, and B3 spectra could be clearly distinguished. The regions that show the most differences are shown in Figure 4.
The MIR spectra of the A1 and A2 samples that were supposed to be the same resin from two different vendors also indicated these samples formed distinct groups. The differences were small and appeared to be mostly due to acid (bands around 1695 cm-1), aromatic (bands around 750 and 1500 cm-1), aliphatic (3000-2860 cm-1 region) and ester (1175 and 1728 cm-1). A classification based on distance was developed using all of the classes without the A2 samples and, when used to classify the A2 samples, it correctly failed them all, but found the A1 samples to be the closest. This illustrates that the MIR spectra could be used for qualification.
 Credit: Sun Chemical Credit: Sun Chemical |
| Figure 4 Click to enlarge |
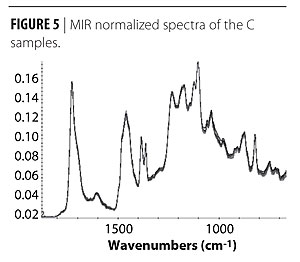
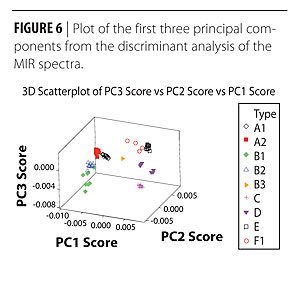
The C sample MIR spectra were all very similar to each other as can be seen in Figure 5 and in the tight cluster of the C spectra in the 3-dimensional plots of the principal component (PC) scores from the discriminant analysis (Figure 6).
Figure 6 shows the score plot for the first 3 PCs of the MIR discriminant analysis of all 10 samples. All of the resins could be distinguished one from the other. The resins with multiple vendors, A, B, and F, could be further distinguished by vendor. A discriminant calibration was developed using 1/3 of the samples for validation, and all of the samples were correctly identified by resin and vendor. Five additional samples of A1 and seven of B1 resins provided months later also were correctly classified and qualified. If there was poor sample contact with the ATR crystal, the IR spectra showed low absorbance, and were not correctly classified. A final analysis procedure would need to include actions for that possibility, such as setting minimal absorbances.
 Credit: Sun Chemical Credit: Sun Chemical |
| Figure 5 Click to enlarge |
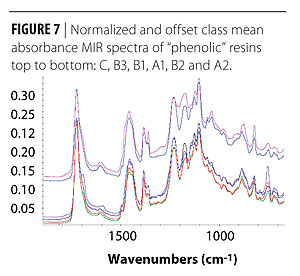
Class means were calculated for the calibration, and these clearly show the spectral differences between the resins. Figure 7 shows the “phenolic” sample class means: The differences between the As and Bs is related to acid content as can be seen by absorption bands around 1693 and 1175 cm-1.
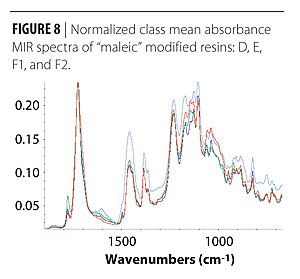
The “maleic” modified resins class mean spectra are shown in Figure 8.
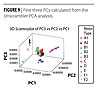
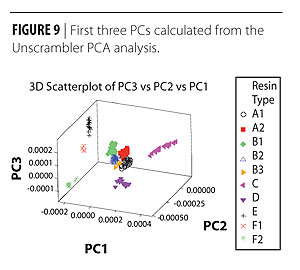
All of the materials were correctly identified and qualified using the Vision and Unscrambler® software methods discussed in the Experimental section. The results from the first 3 PCs using the Unscrambler calibration are plotted in Figure 9, and show all of the groups could be discriminated. Spectra of materials with preparation inconsistent with that described in the Experimental Section were not correctly identified and qualified.
 Credit: Sun Chemical Credit: Sun Chemical |
| Figure 6 Click to enlarge |
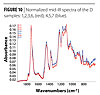
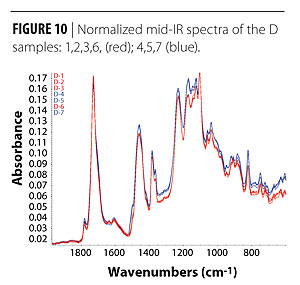
The D samples also could be further divided into two qualities that differed by more phenolic resin (D-4, -5, -7) with bands of greater relative intensities around 1705, 1498, 1230, 1170, and 820 cm-1, or more natural rosin (D-1, -2, -3, -6) with bands of greater relative intensities around 1460, 1225, and 1105 cm-1 (Figure 10).
 Credit: Sun Chemical Credit: Sun Chemical |
| Figure 7 Click to enlarge |
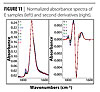
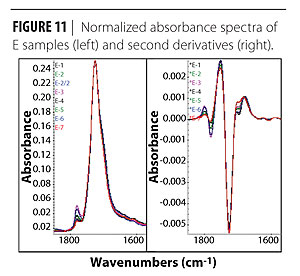
The spectra of the set of E samples showed a range of anhydride content, but did not fall into distinct groups. There were anhydride, acid, and ester content differences. This can be seen more clearly in the second derivative spectra of these samples that show varied relative intensities of the anhydride bands around 1780 cm-1, the ester bands around 1727 cm-1, and the acid bands (now resolved) around 1700 cm-1 (Figure 11).
The F1 and F2 samples varied by anhydride content as well, with F2 having greater anhydride content. They appeared to be distinct sets though there were only two samples each of F1 and F2, which may not be enough to determine a trend.
Identification of Resin Type and Physical Property Class
 Credit: Sun Chemical Credit: Sun Chemical |
| Figure 8 Click to enlarge |
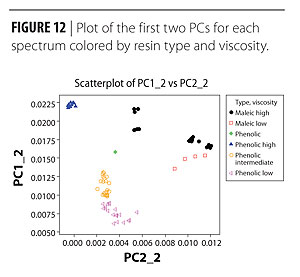
The first two principal components of the MIR spectra with the resin type are shown in Figure 12, and indicated FTIR-ATR can be used to differentiate resins by type and viscosity property class, “phenolic intermediate” viscosity (samples A1 and A2), “phenolic low” viscosity (samples B1 and B2), “phenolic” unknown viscosity (sample B3), “phenolic high” viscosity (samples C), “maleic high” viscosity (samples D and E), and “maleic low” viscosity (samples F).
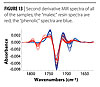
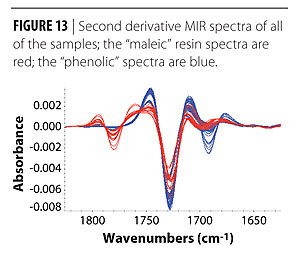
Though the spectra of these materials can be clearly separated into types and viscosities of resins, chemometrics on broad spectral regions enhances this. Figure 13 shows the carbonyl region of the spectra, and shows the variation in these modified natural products and that these are not pure materials.
 Credit: Sun Chemical Credit: Sun Chemical |
| Figure 9 Click to enlarge |
Correlation of Spectra with Physical Property Data
Some physical property data were supplied with the A samples. These included bubble seconds, dilution, Gardner color, Chemotronic value, Tan Delta and viscosity. (The Chemotronic value, as expressed in degrees Centigrade, is actually what is known as a cloud point. The cloud point describes the compatibility of the rosin-based resin in specified test solvents commonly used in the lithographic printing industry. This number is a useful descriptor for QC and Research purposes.) Of these tests, the ones relating to viscosity, bubble seconds, tan delta and viscosity, were of most importance to the final product application.
 Credit: Sun Chemical Credit: Sun Chemical |
| Figure 10 Click to enlarge |
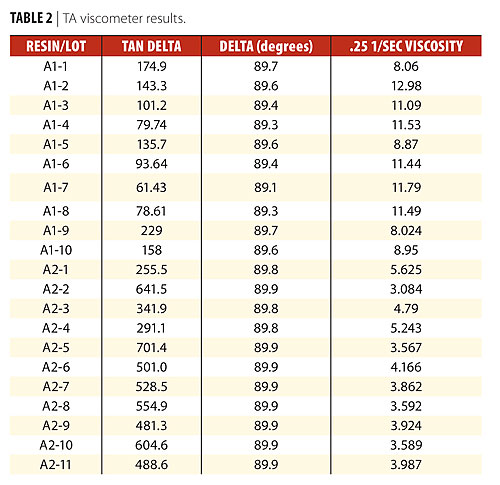
Tan delta represents the elastic contribution and delta the viscous contribution to the viscosity. A pure elastic material has a delta and a tan delta equal to zero. A purely viscous material has a delta of 90°, but tan delta approaching infinity (very large numbers). Midway between pure elastic and pure viscous contributions the delta is 45° or a tan delta of 1. So a material has a larger viscous contribution than the elastic one if delta is between 45 and 90° (or equivalently tan delta larger than 1 up to infinity. Hence, the range of tan delta to show larger viscous contribution than the elastic one is from 1 to infinity, whereas its range to show larger elastic contribution than the viscous one is only from zero to 1. Obviously these ranges are not equal since the tangent function is not a linear function. Thus, in this case though the tan delta values appeared to vary significantly, when these values were converted to delta values, they were all greater than 89 degrees, indicating the materials were nearly purely viscous (Table 2).
 Credit: Sun Chemical Credit: Sun Chemical |
| Table 2 Click to enlarge |
It is important to determine the real value of the physical data to the product quality. Delta ranges from 0-90 degrees, with 0 indicating purely elastic, and 90 indicating purely viscous. So the small differences in the delta values indicated there may be very little viscosity differences among these samples.
 Credit: Sun Chemical Credit: Sun Chemical |
| Figure 11 Click to enlarge |
When using spectroscopy to monitor production or products, broad ranges of materials can be made to yield robust calibrations. The ranges can be made broad by taking samples at different times throughout the production, changing the raw materials ratios, or including products developed for different applications that represent extended composition ranges. The lots of raw materials supplied by a vendor should be very consistent and may not provide the range of values that might be required to develop robust quantitative calibrations. Even when using chemometrics for evaluating different raw materials, the variety of functional groups other than the ones of interest make it difficult to combine them into one robust calibration.
 Credit: Sun Chemical Credit: Sun Chemical |
| Figure 12 Click to enlarge |
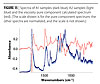
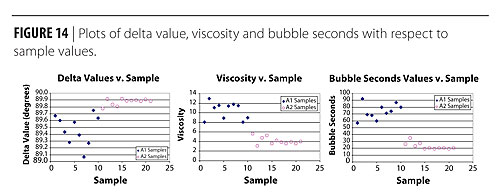
Plots of the physical data values for the A1 and A2 samples are shown in Figure 14. There was more variation in the A1 than the A2 sample data, and there were distinct differences in the bubble seconds and viscosity data, but a little overlap in the delta values. This indicates that only the bubble seconds and viscosity could be used to distinguish these two materials. This indicates that the spectral variation would only be well-correlated to the bubble seconds and viscosity, but not to the delta values. The spectra showed small but distinct differences between these groups, but the variation in the spectra of the A1 group was larger than the A2 group, so the reason for the variability would need to be determined. “Pure component spectra” composed of the spectral information that correlates with the values for a given component in all of the standards are determined when the spectra are correlated to the lab values, and can be generally used to understand the chemical causes for the physical changes.
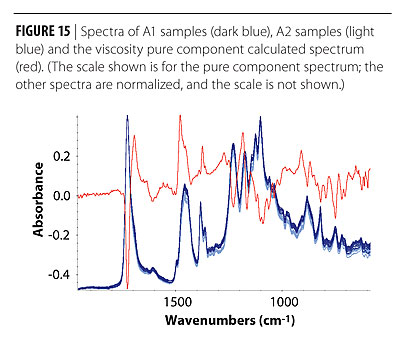
A comparison of the viscosity pure component spectrum with those of the A1 and A2 sample spectra indicates that viscosity increased with acid functionality and decreased with ester functionality. See Figure 15. The value of these correlations has to be judged on the basis of the accuracy of the lab values, and the variations in the spectra, the number of samples, as well as the many other variables that could affect the measurements or samples. This particular correlation may not hold up over a larger number of samples, but showed feasibility for further investigation.
 Credit: Sun Chemical Credit: Sun Chemical |
| Figure 13 Click to enlarge |
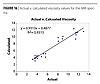
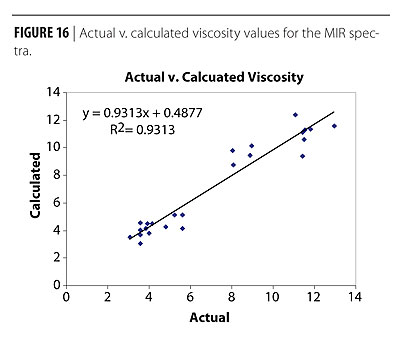
The correlation plot using three factors is shown in Figure 16, and shows reasonable feasibility correlation and the separation of the values into at least two distinct groups. However, a full-sized correlation with validation samples would need to be done with a larger number of samples if a calibration for viscosity or better understanding of the relationship between chemical content and viscosity is needed.
Conclusions
Sample preparation methods for both NIR and MIR spectra of hard resins that were fast, reproducible and resulted in little waste were developed. Both NIR and MIR could be used to identify and qualify these materials. Each resin type could be distinguished from the others. Within each resin type, each could be classified with respect to which vendor supplied the material. In some cases of a given resin type from a vendor, two clearly different qualities could be distinguished.
 Credit: Sun Chemical Credit: Sun Chemical |
| Figure 14 Click to enlarge |
 Credit: Sun Chemical Credit: Sun Chemical |
| Figure 15 Click to enlarge |
Chemometric analysis of the MIR spectra provided significant information about the resin samples. There were clear differences among spectra in the subsets of samples, indicating lot-to-lot variations in the quality of material. The differences in relative content of anhydride, alkyl, ester, phenolic resin and natural rosin, and acid could be distinguished, and this information could be used to identify the quality of supplied materials. These materials could be qualitatively correlated to whether they had only “phenolic” or “phenolic”/”maleic” content as well as to the phenolic or maleic content and viscosity level. The correlation of the MIR spectra to some of the physical properties provided some information on the effect of the functional groups on the physical properties.
 Credit: Sun Chemical Credit: Sun Chemical |
| Figure 16 Click to enlarge |
Acknowledgements
We thank Adam Verillo for supplying the materials and posing the question of a good method for analysis, Carl Weisbecker for help in searching references, and Saeid Savarmand for advice on the viscosity data analysis.
Looking for a reprint of this article?
From high-res PDFs to custom plaques, order your copy today!


