Infrared Analysis of Coated Vinyl Materials

Many modern processes, from food safety to materials preservation, involve the application of a coating to a substrate. These coatings serve to protect the substrate from damaging environmental effects, to protect substances in contact with the coating from contamination, or to control the release of the underlying material. Coatings are found on a range of substrates, for example the inside of soda cans to protect and preserve taste, on fabrics to enhance water or stain resistance, on drug tablets to control release and on vinyl flooring to protect against scratching, staining and damage from light exposure.
This article focuses on vinyl upholstery used in the marine and automotive fields. These applications require the material to withstand abrasive environments. In addition, vinyl products for marine upholstery must resist the corrosive salt water environment, mildew and mold, and the excessive UV light exposure inherent in spending time on the open water. Coating formulations for the vinyl are tailored to address these demands. During development, the coated vinyl will be subjected to simulated environments by varying temperature and humidity or exposure to sunlight to see how the coated material wears, fades and ages.
Once the coating formulation has been optimized, production must move from the laboratory to a pilot plant and finally to full manufacturing scale. Throughout this process, methods for rapid monitoring must be developed and implemented in parallel. The chemical composition of the coating is critical, but so are other parameters such as homogeneity and coating thickness. These play an important role in the level of protection and the longevity of the coated material.
Typically, the analysis of coat weight involves stripping the coating from a known area of the sample and using this information to determine the amount of coating on the surface. There are numerous problems with this technique, starting with user-to-user variation and the need to develop a chemical means to strip the coating. Further, stripping of the coating entails sacrificing some of the final product and cannot be used to assess homogeneity.
Infrared spectroscopy can be used as a non-destructive analysis tool for many coated samples. In cases where the substrate is highly reflective, mid-infrared spectroscopy (4000-400 cm-1) works extremely well. However, vinyl is not reflective and indeed absorbs much of the mid-IR light. In this case, the near-IR spectral range (10,000-4000 cm-1) is more effective, especially via Diffuse Reflection.
In a manufacturing QA/QC environment, the workflow must be automated and parsed into predefined steps (an SOP) to ensure multiple operators achieve consistent results. Infrared spectroscopy has advantages of simple sample handling, non-destructive analysis and considerable macro-building power to enable the SOP development.
Experimental
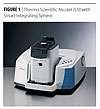
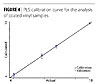
A Thermo Scientific Smart NIR integrating sphere accessory was mounted into a Thermo Scientific Nicolet iS10 FTIR spectrometer equipped with NIR optics, as shown in Figure 1. The accessory contains an internal gold flag for use as the background reference. A sample spinner was used to analyze a large piece of vinyl, thus giving a more representative average spectrum for the sample.Spectra were collected in about 30 seconds using the Thermo Scientific OMNIC spectroscopy software. A partial least squares (PLS) quantitative model was developed using the Thermo Scientific TQ Analyst chemometrics software package. A series of samples with various coat weights were analyzed and a calibration curve was constructed. Replicates of each coat weight were collected to observe and account for measurement variation and demonstrate the repeatability of the method. The same vinyl substrate was used for each coat weight, thus removing any variation from the vinyl material. The vinyl samples were prepared with coat weights of 5.1, 9.6, 11.9 and 17.3 g/m2, as determined from a primary (weight-based) method. Spectral differences were correlated via TQ Analyst to the variation in film thickness.
Results
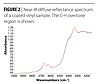
A spectrum from a coated vinyl sample is shown in Figure 2. The PLS analysis of the data focused on the C-H combination bands seen in the 4600-4200 cm-1 region of the spectrum, highlighted in the figure. Because the same vinyl substrate was used, the differences in spectra can be attributed to the properties of the coating. In this case, the same coating was used, so the spectral changes relate directly to the coating thickness applied to the vinyl.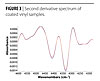
The Nicolet iS10 is primarily a laboratory instrument. The calibration can now be shifted to an industrial spectrometer, such as the Thermo Scientific Antaris II. The combination of laboratory-based instrumentation specific to the QC lab and manufacturing-based instrumentation provides the flexibility required to develop many such analysis methods.
Conclusions
Coatings are a critical aspect of the overall performance for vinyl products used in environmentally challenging conditions. Creating a non-destructive, fast and reliable test for coat weight ensures every product meets specifications and performs uniformly. All of these criteria are met by the NIR method outlined here. The PLS quantitative model provides an excellent basis for method development.The investment in the instrument and training would be quickly recouped. The elimination of solvents and disposal costs, the rapidity of measurement, the product consistency resulting from more extensive testing, the higher user-to-user consistency and the non-destructive format of the analysis will combine to provide an excellent return on the investment. In addition, the ability to “push out” a laboratory-generated solution to the manufacturing floor gives great flexibility and future capabilities to the facility.
Looking for a reprint of this article?
From high-res PDFs to custom plaques, order your copy today!


