

The examination of coating adhesion and coating failure analysis are critical methods used to determine a coating’s life expectancy and performance. Adhesion failure involves separation of the coating from the substrate and can be caused by mechanical or thermal stress, corrosion, or chemical degradation.1 The separation of coating materials may be found in many different formats: cracking, delamination, spallation, chipping or plastic deformation. It is common to see multiple types of failure features occurring in one single application. The examination of coating adhesion and coating failure analysis require reliable and practical methods used for quantifying coating-to-substrate adhesion strength and to characterize failure mechanisms. Adhesion strength data and adhesion failure mechanisms are important information for preventing or stalling adhesion failures. Understanding these areas improves overall coating quality and performance.
According to Mittal, “adhesion strength” can be considered from two different perspectives: “fundamental adhesion” and “practical adhesion”.2 Fundamental adhesion involves intrinsic properties between two ideal smooth surfaces; it is the summation of all intermolecular or interatomic attractions at the interface due to chemical or physical interactions. Fundamental adhesion can be expressed as: W12 = g1 + g2 - g12, where g1 and g2 stand for the surface free energy of two specific surfaces, 1 and 2, and g12 stands for surface free energy of interfacial surface between surfaces 1 and 2.3 Fundamental adhesion is the thermodynamic work to break the chemical bonds or the specific energy needed to separate two surfaces and depends on the intermolecular interactions between the two contacting surfaces. Fundamental adhesion is the predominant factor that determines coating adhesion strength. This factor can be measured through surface free energy analysis via contact angle measurement by selecting suitable probe liquids and theories.4 From fundamental adhesion, coatings can be qualified as “good” or “poor” for their intended applications, and coating adhesion to the substrate may be improved by modifying surface free energy components. However, knowing fundamental adhesion provides no information on real work required to break the coating from the substrate.
Practical adhesion, on the other hand, is more of an engineering term. By definition, practical adhesion is applied forces, or work required, to detach the coating from the substrate. Practical adhesion can be influenced by the coating’s intrinsic fundamental adhesion along with many other factors, such as coating thickness, roughness of the substrate, mechanical properties of the coating and surface chemistry of the substrate. Measurement results of practical adhesion may also be affected by test methods. Differences in measured practical adhesion are in existence even when using the same test method with different testing parameters.5
There are many techniques or analysis methods used for practical adhesion determination. The most common methods include pull-off methods, stressed overlayer test, bending test, blister test, double cantilever beam test, shockwave test, microcantilever deflection test, scratch test, and indentation test. A brief review of these testing methods can be found in Chen’s paper.1 Using an appropriate adhesion test method is necessary to minimize plastic deformation in the coating-substrate system and maximize stresses that are responsible for adhesion failure.1 When adhesion is low, most test methods can be used to obtain reliable results with necessary calibration. As adhesion gets stronger, the choice of test methods is reduced. For high-adhesion coatings such as oxide coatings on glass, reliable measurements were mostly obtained through scratch tests. This article focuses mainly on the applications of scratch testing for practical adhesion evaluation.
As general guidance, ASTM C1624-05 provides a standard scratch test method for the determination of practical adhesion strength and for examining mechanical failure modes of hard ceramic coatings.6 In practice, the same operating principle, as for this kind of scratch test, has also been applied to soft coatings, such as polymeric coatings. For polymer coatings, mechanical properties may be strongly dependent on test temperature, and in some cases, humidity. Tests must be performed in a similar environment to guarantee reproducible results. When residual scratch depth is of interest, for certain self-healing polymer coatings that exhibit mechanical damage, it is recommended that 24 hours be allowed for viscoelastic recovery.7
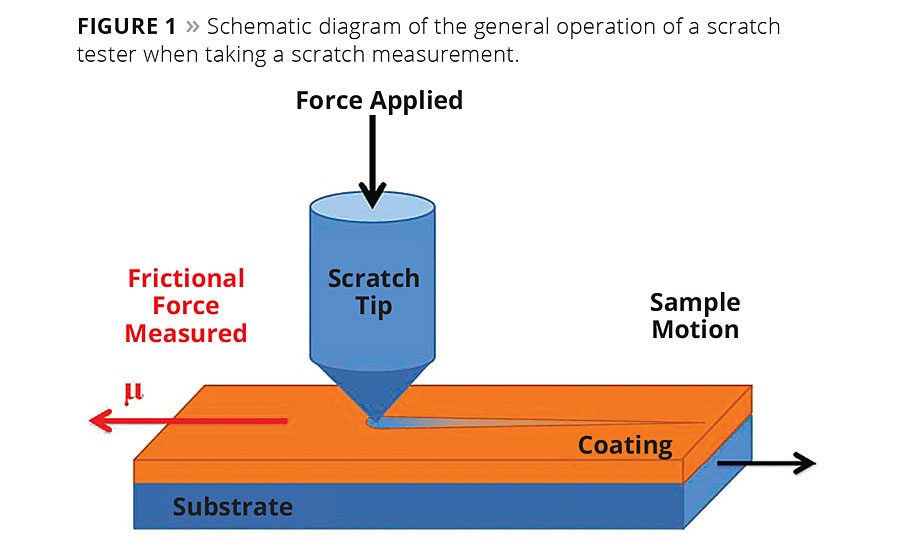
Figure 1 shows a schematic diagram of the general operation of a scratch tester when taking a scratch measurement. During a scratch test, a stylus made of diamond or other hard materials is drawn linearly across the coating surface while either a constant or a progressive normal load is applied. As a result, the stylus scratches into the coating, reaches and passes the coating to the substrate interface. Coherent and adhesion failures may be introduced into the coating and substrate system. Examining the data obtained directly from the scratch tests and post-scratch microscopic analyses yields useful information about the coating itself and the coating-substrate system. A typical scratch length should be long enough to allow scratch events to evolve and occur while the spacing between any two scratch tracks should be large enough to avoid interactions among scratches and any influence from previous scratches.
The constant load scratch test maintains the same normal force on the stylus as the stylus moves at a constant displacement rate relative to the sample surface. In contrast, the progressive load scratch test has a linearly increasing normal force on the stylus as the stylus moves at a constant displacement rate relative to the sample surface. When comparing these two testing methods, the constant load test has better discrimination of different loading levels and non-uniformity of a coating, and greater statistical confidence in failure events for a given load. The disadvantage of a constant load test is that it needs more time and space for multiple tests under different loading levels and may miss failure events between intermediate loading levels. The progressive load test with a single scratch test could reveal different failure modes when using a range of loads. In doing so, it has better specimen utilization and is less time consuming. With the progressive load test there are two experimental variables, load and location, which change at the same time. Thus, it will offer less scratch failure features in a single scratch in comparison to constant load scratch. Repetitive scratches are necessary to confirm the scratch failure or to investigate sample uniformity.
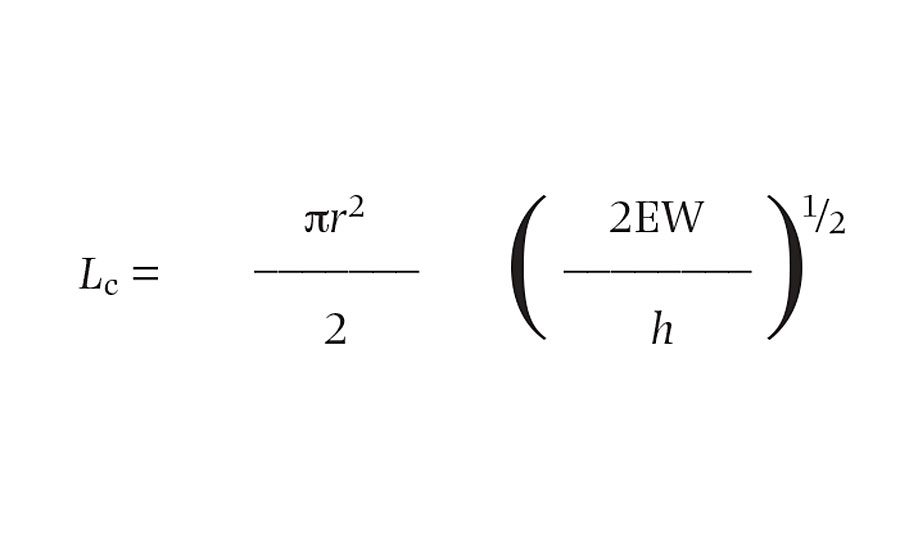
Several important signals are recorded and used to determine coherent and adhesion failure events during a scratch test, such as normal force, normal displacement, lateral force, lateral displacement, friction coefficient, residual depth, acoustic emission, etc. During the scratch test, the coating may begin to show signs of detachment from the substrate at a certain normal load. When this occurs, scratch data usually shows a sudden decrease of tangential force and increase in penetration depth. The normal force when interfacial adhesion failure occurs is called the critical load of interfacial adhesion failure (Lc). The critical load is one of the most important parameters determined during a scratch test. For multilayer coatings, several critical loads could be found from changes in tangential force and penetration depth in the test graph. The critical load of interfacial adhesion failure is a good indicator for interfacial adhesion strength of the coating to the substrate. Normally, a higher critical load represents higher interfacial adhesion. However, the true relationship between interfacial adhesion and critical load is relatively complicated and may be affected by many factors such as the fracture toughness of the materials involved, film thickness, etc. When tensile stress normal to the film surface drives delamination, the critical load Lc at which delamination occurs takes on the following relationship with practical work of adhesion:
pr2 2EW 1/2
Lc = _______ ( ________ )
2 h
where r is the probe-material contact radius; h is the film thickness; E is the Young’s modulus of the film coating and W is the practical work of adhesion.8
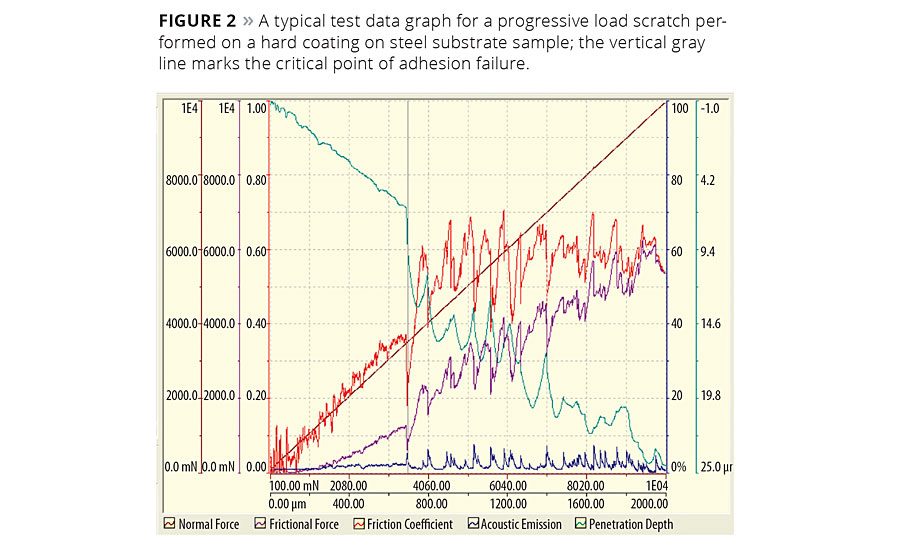
Figure 2 represents a scratch test data graph for a progressive load scratch test (load from 0.1 to 10N) performed on a single hard coating on steel substrate. In this figure, several typical scratch characteristics can be easily identified from the curves. When the normal load is less than 3520 mN, the friction force, friction coefficient and penetration depth show a smooth linear increase, and acoustic emission signal is low and flat. At the normal load of 3520 mN, a sudden increase in penetration depth from about 6 µm to 13 µm can be seen. Meanwhile the friction force and friction coefficient both increase abruptly as the normal force increases. The acoustic emission signal jumps up as well. These phenomena are signs of coating delamination or interfacial adhesion failure. After this point, as the applied normal force continuously increases, failure events occur at the interface with increased frequency and severity. All data show violent fluctuations due to starting and stopping of coating adhesion failures. The start and stop of the coating adhesion failures is a process in which accumulated energy on the scratch tip overcomes the coating adhesion strength. This causes coating delamination and releases energy. This process repeats itself and retains similar characteristics to stick-slip in friction. A closer look at the graph reveals that acoustic discrete peaks always correspond with the sudden drops of frictional force and friction coefficient. This suggests that coating detachments release elastic energy in acoustical format. The critical load of interfacial adhesion failure, for this particular coating-substrate sample, was determined from the start of the adhesion failure at a normal force of 3520 mN.
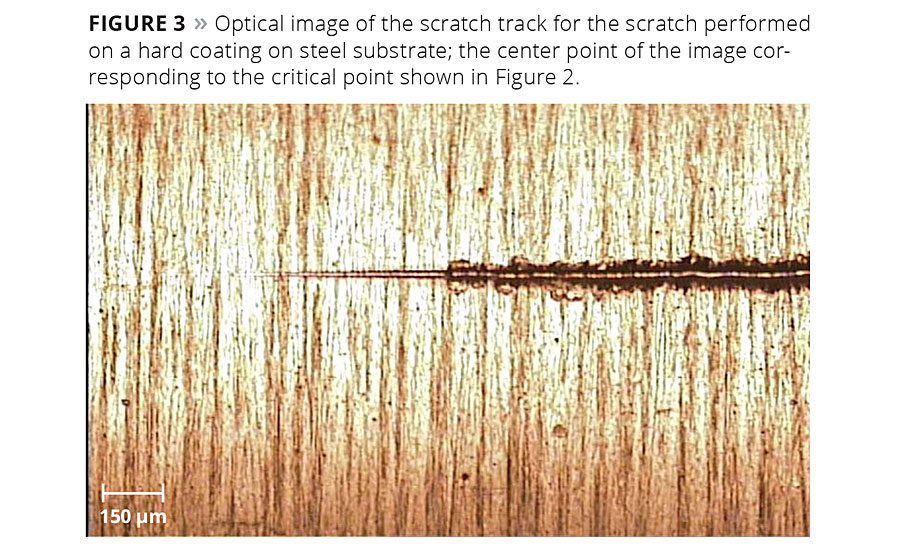
However, not all dramatic changes in the data graph detected during a scratch test can be related to interfacial adhesion failures. They may also be a result of other events such as surface topography, roughness changes, property non-uniformity, coating coherent failures, etc. Direct and complementary methods of assessing scratch failure are optical microscopy, scanning electron microscopy (SEM) and scanning probe microscopy (SPM) analysis. Normally a travelling optical microscopy system is an integral in-line component of the standard scratch test system.6 SEM, SPM and other analytical techniques could be resorted to before and after the scratch tests. The scratch data graph and microscopic analysis can be used in tandem to investigate coating adhesion failures. Figure 3 is an optical image of the scratch performed on the same coating sample shown in Figure 2. It is obvious that before the critical point of failure (center point of the image) the scratch track is thin and contains smooth edges. After the point of critical failure, coating adhesion failure begins and the scratch shows signs of spallation along the scratch track.
Depending on the nature of the film and substrate, the detachment of coatings show various modes, or combinations, such as different types of cracking, buckling, spallation, chipping and plastic deformation.9 On a brittle substrate, a brittle coating usually shows tensile cracking, followed by spalling and chipping of both the coating and the substrate. Whereas a ductile coating shows plastic deformation and conformal cracking, followed by spalling and bucking failure in the coating as the substrate cracks. On a ductile substrate, a brittle coating shows tensile and Hertzian cracks and progresses to chipping and spallation as the substrate is deformed. However, a ductile coating on a ductile substrate shows deformation on both coating and substrate, and produces tensile and conformal cracking with predominant buckling failure of the coating. Comprehensive descriptions, graphics and photos of failure modes can be found in ASTM C1624-05.
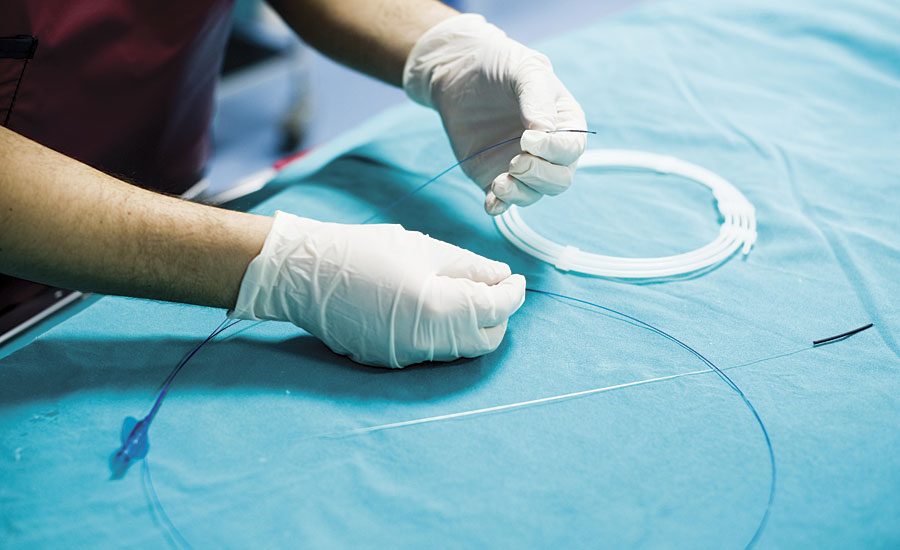
Optical inspection is essential for medical device applications of coatings. Many medical devices, especially those that have direct contact with the human body, such as guide wires, catheters or stents, have a thin layer of coating to increase its biocompatibility and other therapeutic functionalities. If coating adhesion failure occurs on the surface, not only is the functionality of the devices damaged, but the detached particles, based off size and amount, can cause more serious health consequences, including death. Many times, major medical recalls for devices such as guide wires are due to the coating being easily damaged and detached. For instance, small particle detachment debris may trigger an inflammatory response, even if the bulk materials are biocompatible.10 Delamination and detachment of PTFE coatings used for cardiac guide wires may cause clots, which may result in a stroke or heart attack.11 It is recommended that optical microscopy and SEM investigation be conducted after scratch testing of coated medical devices. These investigative techniques help with understanding characteristics of the detached coating materials, such as morphology, particle shape and size, size distribution, and amount of detachment debris at the site. This kind of analysis is beneficial for safe applications of the coatings to the medical devices.
Experimental Case Studies
In most of the industries that use coatings, such as medical devices, semi-conductors and electronics, coating thickness varies from a few nanometers to hundreds of micrometers. Therefore, examining coating adhesion may be performed at nano, micro or macro scale. In this section, experimental techniques of micro and nano scratch tests will be discussed through three representative cases. Micro scratch tests reported here are performed with a combination of the microindentation and the microscratch tester (manufactured by CSM Instruments SA, Switzerland). The nano scratch tests are performed with a Nanomechanical Test System (manufactured by Hysitron, Inc., USA). Optical microscopy is done with optical microscopes that are available on the microscratch tester and the nanomechanical test system. SEM and EDS analyses are performed with a JEOL 6610LV SEM (manufactured by JEOL, Japan) equipped with a Bruker XFlash 6|30 Energy Dispersive X-Ray Spectrometer system (manufactured by Bruker, Inc., USA). SPM analysis is carried out with the in-situ SPM imaging capability of the nanomechanical test system.
Microscratch Analysis of Diamond-Like Carbon Coating on M2 Steel
Diamond-like carbon (DLC) is a class of amorphous carbon materials that has been widely used as a coating material. In recent years DLC has been used in the medical device industry due to its superior mechanical properties and good biocompatibility.12 One of the extraordinary advantages for using a DLC coating is its high wear resistance. DLC-coated articulating implants show essentially no wear of the coating up to 101 million articulations on a simulator corresponding to about 101 years of in vivo articulation.13 However, the same superior mechanical property, i. e. high hardness, conversely makes it difficult to bond to the substrate being coated. In many cases, an adhesion promoter interlayer is used to improve adhesion of DLC to the substrate.14
DLC coating adhesion failure, especially for medical applications, is still ongoing in the research field. Typical causes for DLC coating failure may be mechanical, chemical, biological or combinations thereof.13-18 Lee et al. investigated buckling delamination at the interface between a DLC film and a stainless steel substrate under microtensile loading to simulate human body conditions.16 Spallation of the DLC film and failure happened in a semi-circular shape after initial cohesive cracks in the substrate developed and reached the interface. Hauert systematically studied interface crack growth that may be caused by hydrogen embrittlement, galvanic, crevice or pitting corrosion at the adhesion-promoting interlayer. He found testing in saline solutions to be insufficient for mimicking the test in vivo, as proteins play an important role, especially for crevice corrosion.17 It is also shown that immersion of the DLC coating in biofluid for one month may reduce interfacial strength by up to 75%.18
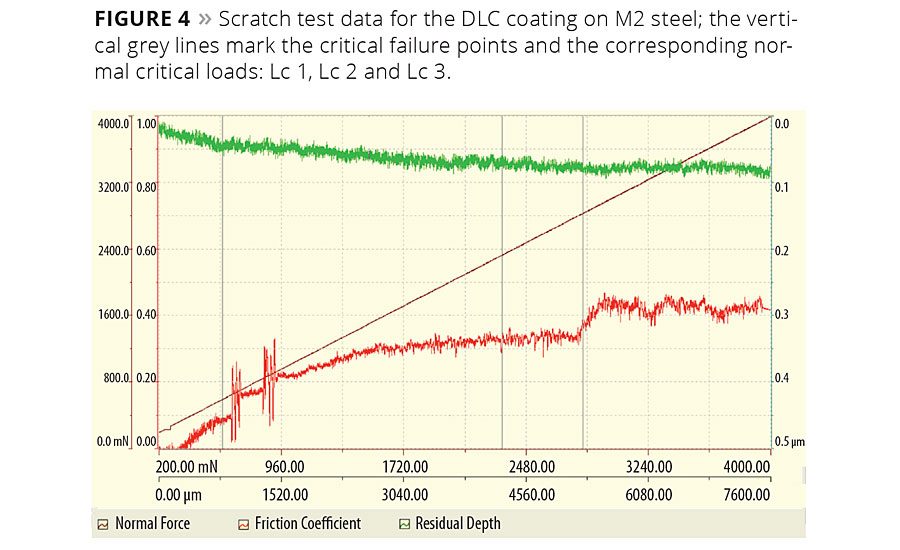
Urged by broad applications of DLC films, a DLC film coated onto a M2 steel sample was scratch tested using the microscratch tester made by CSM Instruments. The scratch data is presented in Figure 4 and the optical micrographs of the scratch track segments are shown in Figure 5. As seen from Figures 4 and 5, the DLC film coating exhibits distinctive scratch failure characteristics along the scratch track. Three critical loads Lc 1, Lc 2, and Lc 3 at 0.59 N, 2.33 N, and 2.83 N correspond to the onsets of cohesive cracking, adhesive spallation and gross adhesive spallation, respectively. Changes in coefficient of friction and normal displacement of the test data correlate well with optical features at the three critical points of coating failure (Figure 5).
Nanoscratch Analysis of Thin Organic Coating on Metal Substrate
With advancements in coating technology, ultrathin films (as low as several nanometers) are widely applied by industries. A recent and fast-developing field is the application of graphene, which is used for smart medical devices in sensing applications, electronic circuits and graphene-based energy sources.19 Evidently, nanoscale characterization technologies are becoming more essential and more important for the future. Nanoscratch testing relies on the same principle as microscratch testing. An obvious difference of nanoscratch and microscratch is nanoscratch works well with films having thicknesses in the nanometer scale rather than the micron scale. Certainly nanoscratch sets itself apart from microscratch by increased load and displacement control and sensing capabilities. Li et al. studied the critical load of interfacial adhesion failure for ultrathin DLC coating with thicknesses between 3.5 nm and 20 nm.20 They found critical load increases with increased film thickness due to better load-carrying capacity. Other studies on adhesion, for three types of 20-nm ultrathin DLC films, concluded that the nanoscratch test system has very good sensitivity for detecting ultrathin overcoat cracking, delamination and brittle fracture.21
Nanoscratch systems are capable of carrying out nanoscratch tests at pre-selected scratch lengths by using ramp, constant load or with other control parameters. As shown in Figure 6, during a nanoscratch test, four parameters -normal force, normal displacement, lateral force and lateral displacement -are measured and recorded as a function of time. From these parameters, comprehensive information about a material’s nanoscratch properties can be characterized. Commonly characterized nanoscratch properties include friction between the sample surface and scratch probe, critical load of interfacial failure, and scratch resistance.
In addition to determining critical load of interfacial adhesion failure, nanoscratch tests can be applied to evaluate a material’s resistance to scratch. It can also be used to simulate mar resistance by quantifying the minimum load for generating visible scratches. Mar resistance can be identified as changes in surface gloss, measuring scratch width and scratch depth under a selected load. The resistance to mar can be particularly important for applications such as clearcoat automotive finishes. Friction measurement through nanoscratch is deemed very useful in studying thin film friction characteristics under extremely light loads or very high contact pressure. Nanoscratch is regarded as an invaluable tool for research on friction mechanisms and debris generation in nanotribology.
Some nanoscratch testers are equipped with in-situ SPM capabilities. Others may have atomic force microscope (AFM) added to help facilitate the analysis. SPM is a generic term for many different kinds of microscopy techniques based on raster scanning of a probe over a surface. This is used to detect physical and chemical properties of the material surface. AFM is one of the SPM techniques. STM (scanning tunneling microscope) and AFM have very high resolution - high enough to obtain atomic-scale images of the surface.22 They can be used under high vacuum, in air or in solution. In-situ SPM and AFM, on a nanoscratch tester, can be used to investigate pre and post scratch surfaces. This test can be used to characterize scratch tracks as well as the scratched surfaces. Figure 7 is a 3D rendering of a SPM image obtained for a scratch performed on a thin polymer film on metal substrate. The scratch track in the center of the image and the surface morphology can be clearly seen.
SEM/EDS Analysis on Scratch Failure of PTFE-Coated Stainless Steel Guide Wire
Other complementary techniques for analyzing scratch failure of coatings are SEM and Energy Dispersive X-ray Spectroscopy (EDS). Working in tandem, SEM and EDS analyses can reveal a tremendous amount of useful information on scratch failure processes, mechanisms, as well as a material’s anti-scratch properties. With the SEM system, micrographs can be taken for morphological inspection to help understand how the scratch surface forms and changes. SEM micrographs of scratch surfaces can reveal much more details than the optical microscope, which is available on a scratch tester. This is due to the SEM’s larger depth of field, higher resolution and greater magnification. In addition to SEM observations, an EDS system can further assist in identifying and quantifying the chemical compositions of the micro areas of interest. This is accomplished by measuring the characteristic X-rays produced by atoms present in the coating and substrate materials. SEM and EDS analysis are even more critical for ultrathin coatings that are transparent under optical microscopy.
Polytetrafluoroethylene (PTFE)-coated stainless steel guide wires are popular in many medical applications. PTFE coatings are applied to the wire surface for smooth surface finishing, reduced friction, increased lubricity and durability of the guide wire. PTFE coating adhesion to the guide wire is critical not only for the desired functionalities but also for the health and safety of the patient for whom the guide wire is to be used. An undesired issue is flaking of the coating material due to adhesion problems. Depending on the particle size and amounts, flaking could lead to an embolism by causing the blockage of a passage or clogging of blood vessels. Therefore scratch testing and SEM and EDS microanalysis of the PTFE coatings can be vital in the examination of the coating for safety reasons.
In general, PTFE-coated guide wires may consist of one single coating or a multiple coating system (for example, basecoat with topcoat). These coating systems are usually made in an aqueous or solvent-based system that may be dispersed with surfactants, mar aids, deformers, pigments, adhesion promoters, etc. Due to high cure temperatures to sinter the polymer, most additives off gas during the cure step. As PTFE sinters, the one-coat system builds cohesive strength via entanglements, and the two-coat systems intermingle to adhere to one another. Adherence of topcoat to basecoat and one-coat systems to the substrate are important parameters in the medical coating community. Coating hardness is a function of crystallinity, molecular weight, entanglements and process temperatures. When curing PTFE, the objective is not to degrade the polymer at too high of temperatures and not to under cure the polymer, as this affects the degree of sintering and coating mechanical properties. Nano-scratch on PTFE-coated samples allows the operator to fine tune the process parameters, meet their cure objectives, and key in to ideal process settings to optimize cohesive and adhesive sites, which may lead to a stronger and safer system.
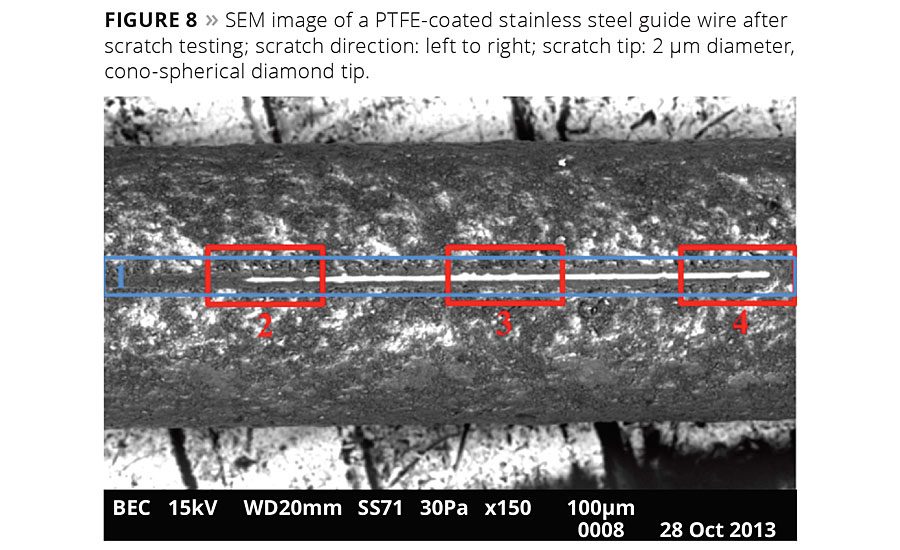
Figure 8 is an SEM image of a PTFE-coated stainless steel guide wire after scratch test. The blue color boxed Zone 1 includes a scratch before interfacial adhesion failure. The red color boxed Zone 2 is transitional and contains initial adhesion failure. The red color boxed Zone 3 shows a steady scratch delamination. The red color boxed Zone 4 contains the end of the scratch. The bright scratch track in Zones 2-4 indicates non-existence of the PTFE coating and exposure of the stainless steel substrate.
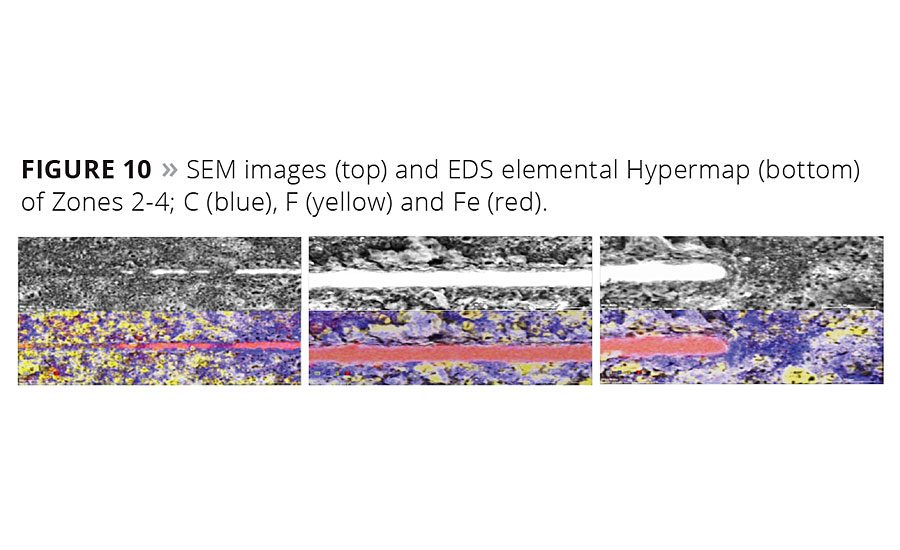
Figure 9 shows the elemental profiles of Zone 1 with the EDS line scanning across the entire scratch. The EDS compositional analysis has verified the morphological interpretations of the SEM image; the coating has indeed delaminated in Zone 2 where element Fe from stainless steel substrate increases, and C and F from the PTFE coating decreases. Zoomed-in SEM images and EDS elemental Hypermaps of Zones 2-4 presented in Figure 10 provide further details of the elemental distributions of the coating and substrate materials along the scratch.
Summary
Scratch testing is one of the most broadly used, fast and effective methods to evaluate adhesion strength, characteristics and failure mechanisms. During a scratch test, a stylus or scratch tip penetrates into a coating under a constant or progressive load while it moves across the coating sample. The normal load at which the coating fails due to delamination or other separation mechanisms is called the critical load of interfacial adhesion failure. Critical load can be identified by monitoring acoustic emission from the sample, looking for changes in coefficient of friction and scratch normal displacement, or post facto visual inspection and microscopic analysis on the scratch track. The critical load of interfacial adhesion failure is related to the practical adhesion strength of the coating to the substrate. The interfacial adhesion strength can be calculated based on the scratch test results such as the critical load, crack length and delamination area by choosing different analysis models. A scratch test with proper optical inspection and microanalysis of adhesion failure events is critical to understanding adhesion failures and to improve coating design, quality and performance.
In addition to the introduction and overview of microscratch and nanoscratch testing, three representative cases of coating in medical device applications have been studied. It is concluded that for coating applications in medical devices, microcratch and nanoscratch are useful and quantitative approaches for examining coating-to-substrate adhesions. The optical inspection and microanalysis of the scratch track and coating debris using optical microscopy, SPM, SEM and EDS can obtain very helpful information on size, shape and number distribution of the debris particles, which may be critical for evaluating the safety of the coated medical devices. This article offers practical and useful information for investigating coating adhesion and failure analysis of medical devices.
References
1 Chen, J.; Bull, S.J. Journal of Physics D: Applied Physics, vol. 44, No.3, 2011, p 34001.
2 Mittal, K.L. Adhesion Measurement of Films and Coating: A Commentary, Adhesion Measurement of Films and Coatings, Edited by K. L. Mittal, VSP Publishing, Utrecht-Boston, Koln, Vol. 1, 1995, p 2.
3 Gerberich, W.W.; Cordill, M.J. Reports on Progress in Physics, Vol. 69, No. 7, 2006, p 2157.
4 Yang, D.; Farel, R. SurFACTS in Biomaterials, Vol. 17, No. 1, 2012, p 15.
5 Kutilek, P.; Miksovsky, J. Acta of Bioengineering and Biomechanics, Vol. 13, No. 3, 2011, p 87.
6 ASTM C1624-05, Standard Test Method for Adhesion Strength and Mechanical Failure Modes of Ceramic Coatings by Quantitative Single Point Scratch Test.
7 ASTM D7027-13, Standard Test Method for Scratch Resistance of Polymeric Coatings and Plastics Using an Instrumented Scratch Machine.
8 Volinsky, A.A.; Moody, N.R.; Gerberich, W.W. Acta Materialia, vol. 50, No. 3, 2002, p 441.
9 Bull, S.J. Tribology International, vol. 30, No. 7, 1997, p 491.
10 Willert, H.G.; Semlitsch, M. Journal of Biomedical Materials Research, vol. 11, No. 2, 1977, p 157.
11 http://www.surfacesolutionsgroup.com/delamination/ accessed on Nov. 18, 2014.
12 Dearnaley, G.; Arps, J. H. Surface and Coatings Technology, vol. 200, No.7, 2005, p 2518.
13 Hauert, R.; Thorwarth, K.; Thorwarth, G. Surface and Coatings Technology, vol. 233, 2013, p 119.
14 B. Ramamoorthy and B. C. Yelodse, Intelligent Information Management, vol. 1, No. 3, 2009, p 179.
15Weisss, H. Surface and Coatings Technology, vol. 71, No. 2, 1995, p 201.
16 Lee, S.H.; Kim, J.G.; Choi, H.W. et al., Journal of Biomedical Materials Research, Part A. vol. 85, No. 3, 2007, p 808.
17 Hauert, R.; Falub, C.V.; Thorwarth, G. et al., Acta Biomaterialia, vol. 8, No. 8, 2012, p 3170.
18 Maguire, P.D.; McLaughliln, J.A.; Okpalugo, T.I.T. et al., Diamond & Related Materials, vol. 14, No. 8, 2005, p1277.
19 Ang, P.K.; Lee, W.C.; Loh, K.P. et al., Asia Pacific BioTech News, vol. 17, No. 1, 2013, p 34.
20 Li, X.; Bhushan, B. Journal of Materials Research, vol. 14, No. 6, 1999, p2328.
21 Deng, H.; Scharf, T.W.; Barnard, J.A. Journal of Applied Physics, vol. 81, No. 8, 1997, p 5396.
22 Inaba, M.; Jeong, S.K.; Ogumi, Z.The Electrochemical Society Interface, Fall, 2011, p 55.


Report Abusive Comment