


Parts 1 and 2 of this article showed that certain reactive surfactants can be used to produce latexes with substantially improved water resistance and repellency, better storage stability, and with better adhesion to metal substrates than latexes prepared with non-reactive surfactants or with other reactives. In Part 3, we show that these same surfactants can be used to build-in freeze/thaw (F/T) stability to latexes and improve the open time of coatings based on them.1 A method to improve the hiding power of latex coatings by using a phosphate ester-based reactive surfactant and, thereby, reduce TiO2 usage is also discussed.
Article Index:
Problems with Low-VOC Coatings
As a result of the drive to reduce VOCs in paint formulations, the use of propylene glycol and other short-chain glycols has been reduced or eliminated. These glycols act as both freeze/thaw stabilizers and coalescing agents. To improve coalescence, formulators have moved to latex resins with a lower Tg. Lower-Tg resins, by their very nature, are softer and more susceptible to freeze/thaw damage; and therefore, freeze/thaw stability becomes even more compromised. Glycol content reduction also results in faster drying of the coating, thus reducing its open time.
In order to keep the performance of the formulation equivalent, the glycol function has to be provided by one or more non-VOC materials. The products on the market that address these deficiencies are generally surfactants. Not only does adding a surfactant add cost relative to the glycol that it replaces, but it can also introduce a number of problems. Free surfactants in coatings reduce adhesion to surfaces, especially, metal, reduce water resistance, affect thickener efficiency, and often reduce washability.
The better solution for imparting freeze/thaw stability and for lengthening open time for low-Tg latex-based formulations is to manufacture the latex with reactive surfactants that give good freeze/thaw stability (many do not).2 A reactive surfactant contains functional groups that participate in the latex polymerization, thereby incorporating the surfactant into the latex particle. Theoretically, less total surfactant may be needed to obtain freeze/thaw stability because the reactive surfactants are bound onto the latex particle surface where it needs to be to prevent ice crystal damage. Non-reactive surfactants can dynamically adsorb onto and desorb from the particle surface. Therefore, at any given time a certain amount of surfactant will be in the bulk phase and ineffective at preventing ice damage. Additionally, bound surfactants will not interfere with the thickeners.
Presumably, the same effect is in operation in extending open time. Surfactants on the surface of the latex particles keep the particles separated longer, slowing coalescence and, therefore, slowing drying.
Study 5: Freeze/Thaw Stability
Latexes, with and without reactive surfactants, were prepared at four Tgs: 5, -5, -15, and -35 °C. Anionic and nonionic surfactant types and levels were varied in latex synthesis and in post-addition to paint. All surfactants were based on styrenated phenol, with approximately 15 moles of ethylene oxide added. A seed latex was used to control particle size.
Study Purpose
The goal was to determine the efficacy of reactive surfactants to impart freeze/thaw resistance to latexes and paints for architectural coatings. Variables include:
- Surfactant type;
- Concentration;
- Polymerizable vs. non-polymerizable;
- Tg of the latex; and
- Particle size of the latex.
Various methods are used to impart F/T to neat latexes. These include surfactant addition, increases in latex Tg, as well as increases in the particle size of the latex. Polymerizable surfactants are known to improve F/T over their non-polymerizable counterparts.2
The methods of improving F/T in paints are similar. Paint formulators have more options, however. These include PVC (amount, type and surface area pigments) and solvent addition among others.
In this study, the effect of surfactant addition to latexes (during polymerization and post addition) that vary in Tg and particle size on F/T performance in latexes and paints was examined.
Materials
The surfactants used in this study included:
- E-Sperse® RS-1617 – POE (15) {DSP, 2 AGE} nonionic reactive, Ethox
- E-Sperse RS-1618 – POE (15) {DSP, 2 AGE} sulfate reactive, Ethox
- E-Sperse 704 – POE (20) {DSP, 0 AGE} sulfate, Ethox
- E-Sperse 1689 – POE (10) {TSP, 0 AGE} nonionic, Ethox
POE is poly(oxyethylene), followed by the number of ethylene oxide units. DSP is distyrenated phenol. TSP is tristyrenated phenol. AGE is allyl glycidyl ether; it provides the allyl reactive group.
Experimental Procedure for Latex Synthesis
All latexes were produced following the same procedure that was given previously in Parts 1 and 2. Methyl methacrylate (MMA) and butyl acrylate (BA) monomer ratios were varied to obtain the appropriate Tg. Note that the calculated Tgs of the latexes were 5, -5, -15 and -35 °C. Based on actual Tg measurements performed using a Perkin Elmer DSC, the actual Tg for the series (5, -5, -15 and -35 °C) is 17, 7, -3 and -23 °C, respectively. We can add 12 °C to every calculated Tg to determine the actual Tg.
The particle size of the latexes was held constant by using a seed latex. Even so, the particle size of the latex particles often changed (increased) when different nonionic surfactants were employed during the polymerization. This was due to a small amount of agglomeration measured via the Microtrac, increasing the volume average (Mv) but not the number average (Mn) of the particles.
The surfactant ERS 1689 is known to impart very good F/T performance to latexes and is similar to products sold for this use. It was not used during polymerization reactions, but was only blended into the finished latex after the reaction. This strategy was employed to decrease the number of latex reactions necessary for this study. Consequently, many more combinations were examined in a reasonable period compared to adding the ERS 1689 to each individual latex during the reaction.
Initially a DOE was set up to track the results. Due to the “on/off” nature of the F/T data (the reaction either passed all five cycles or passed none for the vast majority of blends), the DOE software (Design Expert) was incapable of generating a smooth curve that represented actual results. Thus, the data is best examined via the results in tabular form. Unfortunately, this required more data points than would be otherwise needed, as the exact cutoff point was required. Also, due to the increased number of experiments, blend data collection (using ERS 1689) was favored over separate reactions (using the polymerizable nonionic – E-Sperse RS-1617) since it took considerably less time. As a result, there are some holes in the data for nonionic polymerizable surfactants (at 5 °C and -35 °C Tg), but there is enough data to elucidate trends.
Paint Formulation
The ingredients were added to a stainless steel beaker in the order listed using a high-speed disperser (Table 1). A good grind was obtained. Next the letdown was made (except latex) using low speed on the same disperser. Very small volume mixtures of the paint base with latex were then made (~25 g). The paint was mixed for a further 15 min.
Note that in this formulation there are no thickeners other than the Cellosize QP4400. A quick study performed by adding thickener to a few latex paints indicated that thickeners did not play a significant role in F/T. This reduced the complexity of formulating and allowed considerably more paint formulations to be made in a shorter period. The viscosity of the paint without the added thickeners was reasonable.
Experimental Procedure for Freeze/Thaw Test
In order to rapidly assess a large number of latexes and paints for F/T, the latexes were put into clear plastic 35x10 mm petri dishes with covers. The samples were placed into a -18 °C freezer. The samples froze within three hours and thawed within one hour. This allowed five freeze/thaw cycles within a 24-h period. Failure was noted as the time where the latex or paint was not fluid, even after attempted stirring. Filterable solids, gloss and hiding were not measured.
It is expected that there may be some variation in F/T resistance as a function of the size of the sample and thus rate of freezing and melting. ASTM recommends a ½-pint container size. Variables such as particle size, latex morphology and type of surfactants employed also have an effect. The type of paint formulation, including ingredients, will also have an effect. The conclusions drawn here for smaller sample sizes are expected to correlate to trends for larger sample sizes. Effects on a particular formulation of interest should be examined separately.
F/T Resistance Comparison of Surfactants– Latex Only
Latexes at Tg = 5 °C (calculated)
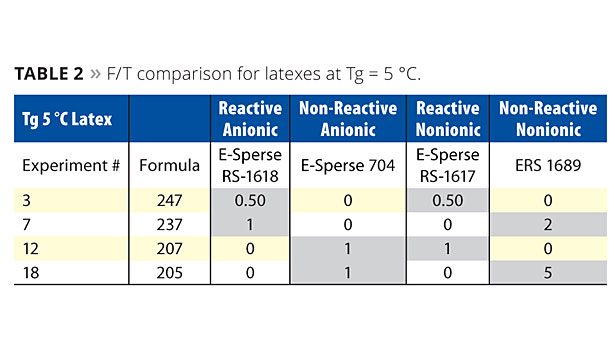
Table 2 shows the F/T comparison of latexes made at Tg = 5 °C. The surfactant concentrations for each data set are highlighted in grey. These data points represent the lowest concentration of surfactant that allowed the neat latex to pass five freeze/thaw cycles. Three trends are noticed at Tg = 5 °C:
1. Latexes with only polymerizable surfactants required less overall surfactant than the others (experiment #3 vs. others).
2. Latexes with at least one polymerizable surfactant enabled F/T at lower concentrations than those that had none (#7 or #12 vs. #18).
3. Polymerizable nonionics were better than non-polymerizable nonionics (#12 vs. #18), since less was needed to provide F/T.
Latexes at Tg = -5 °C
The F/T data for latexes at -5 °C Tg are shown in Table 3. At this Tg, based on the data provided, the following was noted:
1. Latexes made with only polymerizable surfactants required less overall surfactants than the others (#20 vs. others).
2. Polymerizable nonionics were better than non-polymerizable nonionics (#2 vs. #26, and #63 vs. #31) since less was needed to provide F/T.
3. Overall, more surfactants are needed at -5 °C Tg to produce F/T than at 5 °C Tg.
Latexes at Tg = -15 °C
The F/T data for latexes at -15 °C Tg are shown in Table 4. At this Tg, based on the data provided, the following was noted:
1. There appears to be no advantage of the E-Sperse RS-1618 over E-Sperse 704 at this Tg when using ERS 1689 as nonionic (#39 vs. #44).
2. The data indicates that using polymerizable surfactants only required less overall surfactants than the others (#61 vs. others). This is similar to the 5 °C Tg latex data.
Latexes at Tg = -35 °C
The F/T data for latexes at -35 °C Tg are shown in Table 5. At this Tg, based on the data provided, the following was noted:
1 There appears to be no advantage of the E-Sperse RS-1617 over ERS 1689 at this Tg (#50 vs. #52). This may be due to difficulties in polymerizing a large quantity of polymerizable surfactant, making it behave as a non-polymerizable surfactant.
2. There appears to be an advantage of E-Sperse RS-1618 over E-Sperse 704 at this Tg (#52 vs. #57).
3. Overall, more surfactants are needed at -35 °C Tg to produce F/T than at any of the previous Tgs.
F/T Resistance Comparison of Surfactants– Latex Paints
Flat Latex Paints at Tg = 5 °C
Table 6 shows the F/T comparison of latexes made at Tg = 5 °C. Again, the surfactant concentrations for each data set are highlighted in grey. These data points represent the lowest concentration of surfactant that allowed for a flat latex paint to survive five freeze/thaw cycles.
At this Tg, the paint data immediately reveals the following:
1. There is significantly less surfactant needed to produce F/T in flat latex paints than in the neat latex. This is expected since it is proposed that latex/latex interactions cause F/T failure. With highly stabilized pigments interfering with latex/latex interactions, failure is less likely. Note that at higher gloss levels (lower PVC), F/T should not be as good as with flat formulations, all other ingredients held constant.
2. There appears to be an advantage of E-Sperse RS-1618 over E-Sperse 704 at this Tg (#4 vs. #14) since no nonionics were needed for F/T in #4.
3. Latexes with only polymerizable surfactants required less overall surfactants than the others (#1 vs. others).
Flat Latex Paints at Tg = -5 °C, -15 °C, and -35 °C
The F/T data at these Tgs is shown in Table 7. At these Tgs, the paint data immediately reveals the following:
1. Increasing levels of surfactants are needed to stabilize latex paints as the Tg of the latex decreases.
2. Based on experiments at Tg -15 °C (#64 vs. #71 and #37 vs. #43), as well as at -35 °C Tg (#47 and #51), E-Sperse RS-1617 is significantly more efficient at producing F/T than ERS 1689 at lower Tgs.
3. Note that lower levels of both polymerizable surfactants (less than 1%) were not investigated at -5 °C Tg as was done for 5 °C Tg.
Particle Size Effects on Freeze/Thaw
The effect of particle size was examined in latexes and paints. In Table 8, the F/T data for two latexes (289 nm vs. 157 nm) are noted. The data is identical for the neat latex, however, the F/T characteristics in paint are improved for the large-particle-size latex (Table 9). This can be expected since the larger-particle-size latex has much less surface area than the smaller-particle-size latex (at the same solids level). The surfactant on the surface is expected to be much denser for the larger latex, improving F/T. Apparently the results are only a small function of particle size, as the pure latex F/T did not improve.
Conclusions
Latex data
1. The exclusive use of polymerizable surfactants (bound surfactants) greatly exceeds the F/T characteristics of non-polymerizable surfactants (free surfactants), allowing less to be used.
2. Polymerizable surfactants, whether anionic or nonionic, were for the most part significantly better than non-polymerizable surfactants in imparting F/T characteristics in latexes as a function of loading.
3. E-Sperse RS-1617 (polymerizable nonionic) is much more efficient at producing F/T than ERS 1689, a nonpolymerizable nonionic with a similar structure.
4. Greater surfactant amounts of any type are required for lower-Tg latexes.
5.There is no measurable effect of particle size on latex F/T.
Paint data
1. F/T is obtained at lower surfactant concentrations in latex paint formulations than in latexes themselves.
2. Greater surfactant amounts of any type are required for lower-Tg latexes.
3. Larger particles confer greater stability to F/T.
4. The exclusive use of polymerizable surfactants (bound surfactants) greatly exceeds the F/T characteristics of non-polymerizable surfactants (free surfactants), allowing less to be used at Tg = 5 °C.
5. Polymerizable surfactants, whether anionic or nonionic, were for the most part significantly better than non-polymerizable surfactants in imparting F/T characteristics in latex paints as a function of loading.
6. E-Sperse RS-1617 (polymerizable nonionic) is much more efficient at producing F/T than ERS 1689, a non-polymerizable nonionic with a similar structure.
Study 6: Open Time/Wet Edge
The Eastman company defines the period in which irregularities in a freshly applied coating can be repaired without resulting in brush marks as the open time. The period in which a coating can be applied over an existing paint film without leaving lap marks is regarded as the wet edge time.3
Various methods are used to impart wet edge and open time (WE/OT) to latex paints. In the past, ethylene or propylene glycol has been used. Since these contribute to VOCs, new materials have been developed that do not contribute significantly to VOCs. Examples include Optifilm® from Eastman and Zonyl® surfactants from Dupont. Croda has also developed biobased WE/OT additives.
In this study we examine the effect of surfactant addition to latexes (during polymerization and post addition) on their ability to impart WE/OT to gloss and quality flat paints.
Note that the study was done with acrylic latexes. Different results may be obtained with vinyl acrylic or vinyl acetate ethylene (VAE) latexes since they are more hydrophilic.
The data was graphed using Design Expert. The perturbation plots were generated using coded values, indicating trends for each variable as a function of the concentration employed.
Materials
The surfactants used in the study included:
• E-Sperse RS-1618 – POE (15) {DSP, 2 AGE} sulfate, Ethox
• E-Sperse 704 – POE (20) {DSP, 0 AGE} sulfate, Ethox
• E-Sperse RS-1617 - POE (15) {DSP, 2 AGE} nonionic, Ethox
• ERS 1689 – POE (10) {TSP, 0 AGE} nonionic, Ethox
Experimental
Procedure for Latex Synthesis
See Part 1 or 2 of this paper series for latex synthesis procedures. The calculated Tg was -5 °C and -15 °C (measured Tg was 7 °C and -3 °C respectively). This covers the sweet spot range for low- to zero-VOC coatings. The calculated Tg designation will be used throughout the rest of this study.
Paint Formulation
See Study 5 above for paint formulation and procedures.
Wet Edge and Open Time Testing
The WE/OT testing was done in accordance with ASTM method D7488-11. The data was plotted using Design Expert software. The right and left side of the test for wet edge were plotted separately.
Results and Discussion
Impact of Surfactants on Wet Edge and Open Time of Paints
The fit of the curves and the measure of significance of the data are given in Tables 10 and 11. R2 is the fit of the data and Prob > F is a measure of the significance of the data. Higher R2 is better and lower Prob > F is better.
The significance data for the gloss WE/OT testing was poor. We are working on additional test methods that we hope will perform better. The fit and significance data for the quality flat WE/OT testing was much better. The left side indicated good fit and significance, as did the open time testing.
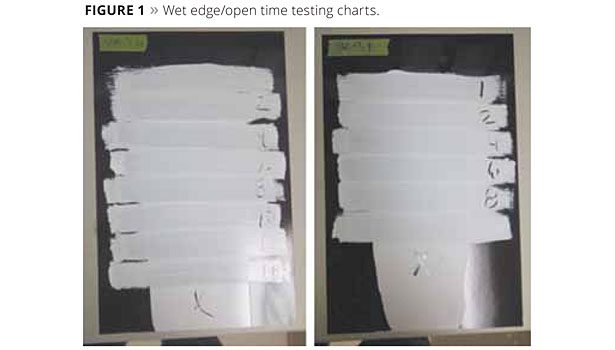
An example of the testing is shown in Figure 1. The WE time is determined by the appearance of the line on the left or right side of the chart. The OT is determined by the observance of the X in the middle of the paint after recoat. The edge dries faster than the middle (Figure 2).4 Therefore, the WE appears sooner than the OT.
The WE/OT data for the gloss and flat paints are shown in the Perturbation plots shown in Figures 3 and 4. The data is plotted from a zero reference point to the maximum used. Note that larger values represent greater increases in WE/OT.
The left side WE data is shown in Figure 3. This indicates that WE data is positively influenced by raising the Tg. It also indicates that E-Sperse 704 is neutral, while the other ingredients produce negative effects. The worst is ERS 1689. It is not readily apparent why this is the case.
The OT of the flat paints is positively affected by E-Sperse RS-1617, while the other ingredients have little effect (Figure 4). It is proposed that E-Sperse RS-1617 works well since it is incorporated into the polymer and on the surface. Just like freeze/thaw, the surfactant molecules hold the latex particles apart longer than the non-polymerizable surfactants, delaying coalescence and thus increasing open time.
Conclusions
• The data for the gloss paints were inconclusive for both wet edge and open time.
• The data for the quality flat paints indicate that:
- Wet edge is positively influenced by increasing Tg;
- Wet edge is negatively influenced by 1689; and
- Open time is positively influenced by E-Sperse RS-1617.
Study 7: Improved TiO2 Hiding
Study Purpose
The goal was to determine the efficacy of polymerizable phosphate surfactants to allow the agglomeration of latexes onto TiO2 to enhance hiding in latex paints through better spacing.
Introduction
There is significant interest in the marketplace to improve the hiding of TiO2 in coatings so that less may be used. TiO2 is randomly distributed throughout a paint film. This randomness allows for some formation of agglomerated pigment particles, reducing their scattering efficiency. Methods to decrease this phenomenon should improve hiding.
US patent 7,960,026 B2 discloses a process to make an organic/inorganic composite particle to aid in spacing of the TiO2. The process requires a TiO2 particle, a plurality of polymer latex particles in contact with the TiO2 surface (primary composite particle), and a polymer layer encapsulating the primary composite particle. This is accomplished by producing latex particles with phosphate groups on its surface and contacting a TiO2 particle, preferably with alumina on its surface. Finally, latex monomer is polymerized in the presence of this pre-composite particle to form a coherent shell. Presumably, the phosphate groups on the latex particle have strong affinity for the alumina on the surface of the TiO2 particle.
Only phosphate monomers are used in the patent. No mention is made about polymerizable phosphate surfactants. The purpose of this study was to test whether polymerizable phosphate surfactants could serve a dual purpose of latex stabilization and enhanced interaction with the TiO2 surface. Better encapsulation would ensue, since traditional surfactants would not interfere with the absorption process, forming a superior pre-composite particle.
TiO2 products are often treated with silica and alumina for various durability properties (Figure 5). In this work, R-741, a predispersed TiO2 product in water from DuPont, was used for simplicity. This is the same product as R-931, but dispersed in water. It has a particle size of 550 nm and has a high alumina content.
Materials
The surfactants and TiO2 used in the study included:
• E-Sperse RS-1685 – POE(15) {DSP, 2 AGE} Phosphate, Ethox
• E-Sperse RS-1618 – POE (15) {DSP, 2 AGE} Sulfate, Ethox
• R-741 – Dispersed TiO2 – 64% solids, DuPont
Experimental Procedure for Latex Synthesis
See the detailed procedure in Study 1. Note that the calculated Tg of the latexes was -5 °C. The MFFT of the latex was measured at <2 °C. The particle size was adjusted by changing the concentration of the seed latex. The seed latex is a preformed latex of very small particle size. This helps ensure the predictability of the final particle size, as the number of particles is set at the beginning of the polymerization:
1. For latexes 184 and 185 in Table 12, 45 g of the seed latex was used to obtain a particle size of ~200 nm.
2. For latexes 186 and 187, 200 g of the seed latex was used to obtain a particle size of ~130 nm.
Experimental Procedure for TiO2 Composite
To a 400 ml beaker, 110 g of latex was added. Under agitation, 40 g of R-741 TiO2 was added to the latex in a dropwise fashion. This mixture was stirred for a further 1 h, and allowed to equilibrate overnight. Latex/TiO2 blend ratios were obtained from a typical satin paint formulation.
Results and Discussion
Latex Particle Size
The particle sizes of the latexes are shown in Table 12. The particle distributions were monomodal.
Latex Stability
The pre-emulsions were easily formed and were stable in all cases. In-process foaming was low. All monomers were easily reduced to less than 150 ppm. The stability of the latexes, as measured by filterable solids, is presented in Table 13. The phosphate latexes (184 and 186) were much less stable than the sulfate latexes.
Particle Size of TiO2 and Composites
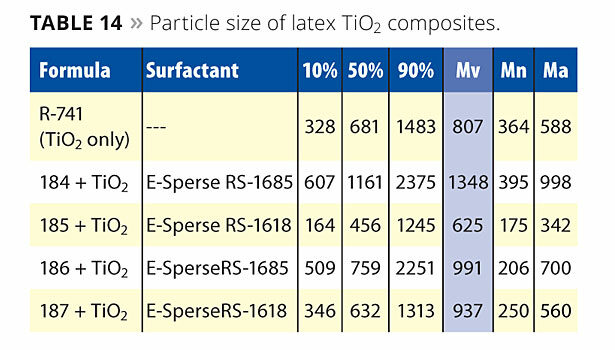
The particle sizes of the latex composites are listed in Table 14. The data is somewhat difficult to interpret in this form. All of the composites have a larger Mv (volume average) than the R-741, indicating some degree of agglomeration. The exception is the 185 composite.
The Mn (number average) for the composites is only larger for the 184 composite. This indicates that some significant portion of free latex still exists and is not bound to the surface. It is possible that there is insufficient TiO2 surface to accommodate all the particles in the small-particle-size latexes (186 and 187). A theoretical calculation can be performed to elucidate this phenomenon.
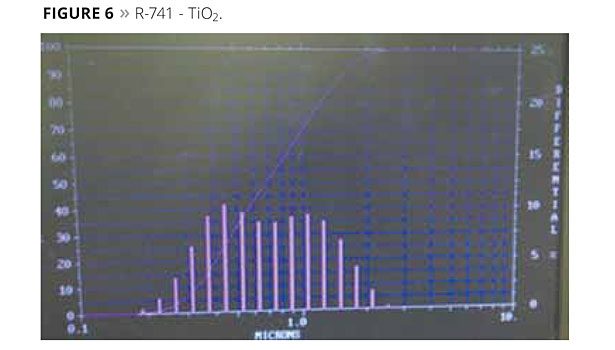
The particle size distributions of the TiO2 and composites are shown below in Figures 6-10. The X-axis is a log scale centered at 1 µm (1000 nm), the left Y-axis is the cumulative Mv line, while the right Y-axis indicates a scale for the histogram.
The particle size of the R-741 (TiO2) in shown in Figure 6. It appears bimodal. The right mode compares favorably with the literature data of 550 nm obtained from the DuPont literature. The dispersion was not perfect since there appears to be a significant volume of doublets at 1100 nm. The composite particles size distributions (TiO2 and latex) are also shown in Figures 7 to 10.
Figure 7 demonstrates that the phosphate-modified latex has effectively adsorbed to the surface of the TiO2 since there is no peak associated with the particle size of the latex (202 nm). Figure 8 demonstrates that the sulfate-modified latex has not adsorbed to the surface to the TiO2 since there is a large peak associated with the particle size of the latex (196 nm).
The particle size of the composites formed with the smaller particle sized latexes is shown in Figures 9 and 10. In this case, there is less differentiation. While the phosphate latex does not appear in the distribution, the sulfate particle size is not significantly present either. The phosphate composite has a more narrow distribution (aside from some gross coagulation) than the sulfate composite. It is hypothesized that the small-particle-sized latexes may not be stable in any case in the presence of the TiO2 due to a larger surface area that the surfactant must cover, and some coagulation ensued. This may be worth looking into as an alternate route to encapsulation.
Hiding Power
The hiding power of test paints containing the composite TiO2 + latexes 184-187 blends was assessed by measuring the opacity of 1-day dried latex + TiO2 blend paint films cast on BYK PA-2811 charts (3 mil, wet applied). The opacity was measured as follows:
Opacity = LB/LW x 100
where L = lightness, as measured by the L,a,b system with an HP-200 colorimeter; LW is the lightness measured over the white portion of the chart; and LB is the lightness measured over the black portion of the chart. Higher values indicate better hiding. Three measurements were taken for LB and LW on each chart (Figure 11).
The average of these values was used to obtain the opacity. Table 15 shows that the opacity obtained with the polymerizable phosphate surfactant (E-Sperse RS-1685) was superior to the polymerizable sulfate surfactant (E-Sperse RS-1618).
Conclusions
Based on particle size measurements, the data indicates that composite particles were formed with the latex prepared with the phosphate reactive surfactant, at least when the larger particle sized latexes were employed.
The hiding power of the paint containing the TiO2/phosphate composite blend was significantly higher than a similar one with the sulfate-based latex. This could lead to paints with lower TiO2 usage to maintain the same hiding power, or better-hiding paints.
References
1 For some leading references, see: Zhao, C; Porzio, S; Smith, A; Ge, H; Scriven, L.E. Direct Observation of Freeze-Thaw Instability of latex Coatings via High Pressure Freezing and Cryogenic SEM, JCT Research, Vol. 3, No. 2, April 2006, 109-115. Ghosh, S; Rousseau, D. Freeze-thaw stability of water-in-oil emulsions, Journal of Colloid and Interface Science, 339 (2009) 91-102. Ghosh, S; Coupland, J.N. Factors affecting the freeze-thaw stability of emulsions, Food Hydrocolloids22 (2008) 105-111.
2 Zhao, C; Cunningham, T; Zhuo, L. US Patent 6,933,415, Low VOC Aqueous Coating Compositions with Excellent Freeze-Thaw Stability.
3 Winnick, M. A.; Feng, J.J. Coat Technol., 1996, 852 (68), 39.


Report Abusive Comment