Continuous-Imaging Fluid Particle Analysis in Coatings Research, Development and Production Applications: A Primer

Particle Counting and Analysis
Any discussion of this topic must begin with a basic understanding of exactly what we mean by a "particle". For the purposes of this article we will define particle as "a minute quantity or fragment, a relatively small portion or amount of something" (Merriam-Webster). Typical measurements of the particles that are of interest to the scientist (or engineer) are particle size distribution (particle count), size, shape and quantity per unit volume (dilution).While frequency (particle count per unit volume) seems to be fairly straightforward at first, it can be easily complicated by overlapping particles and "clumping" of particles. This potential problem is easily fixed by diluting the subject matter to separate the particles and presenting them in a single cell layer, enabling a straightforward "binary" analysis (particle is either present or it is not). The issue of how we characterize particles presents us with a much more difficult problem, however. For the purpose of analysis, it is usually desirable to quantify particle size as a "single number", which can be plotted against another variable (frequency, dilution, temperature, etc.) on a simple graph. The simplest measure of particle size would be its diameter, but even this is not as straightforward as one would think due to variations in particle shape. In a perfect world, all particles would be of the same shape, allowing a single number to be used to quantify size. But in the real world, particles exhibit a variety of shapes, and the problem becomes how to characterize the distribution of particle shapes. A fair amount of research and applied mathematics have been applied to this very problem1 and is beyond the scope of this article. The generally accepted industry norm for particle size is to calculate its Equivalent Spherical Diameter (ESD). This permits a single number to quantify the size of particles of any shape.
While ESD is a known, established method for characterizing particle size, many applications will also require some quantization of shape to differentiate between particle types that may have an equal ESD within a sample. If it was always possible to obtain uniform samples that contained only one type of particle, this would not be an issue. Real-world problems typically consist of analyzing a sample that contains many different particle types in the same fluid. One simple measurement that can be determined relatively easily is the particle's aspect ratio, which is the ratio of its maximum length to its minimum length. For example, two particles having the same ESD could have an aspect ratio of 1:1 (spherical) or an aspect ratio greater than 1:1 (cylindrical). Since the aspect ratio of two different particle types contained in the sample can differ, this measurement is an easy way of segregating these two particle types even though they may plot with the same ESD.
Other properties can be used to distinguish between particles in a sample. Two properties used in automated analysis systems are light scatter and fluorescence. Light scatter is a function of the optical characteristics of the particle and varies between different materials and sizes. Light scatter can be measured by directing a laser at the sample and quantifying the amount of light that is either slightly deflected (forward scatter), or is scattered to the side (side scatter) by the sample particles. Fluorescence is a function of the chemical composition of the particle, and can also be used to differentiate particles within a sample. Fluorescence occurs when the particle is illuminated by a narrow wavelength light source, typically a laser. By sorting the light emitted by the particles through narrow band filters, multiple photomultiplier tubes (PMTs) can be used to detect particles with different fluorescence emissions.
In many of these automated systems, adjustment of the electrical gain of the PMTs can also be used to help narrow down the types of particles detected and analyzed. The signals from the PMTs are used as "triggers" to the electronics system, which determine when a passing particle in the fluid is sampled and recorded. This greatly reduces the amount of data that needs to be analyzed versus taking continuous samples over some preset time interval. For example, in a sparse sample, measurements are only taken and recorded when a particle of the desired properties is present and not when "empty liquid" is passing through the flow chamber, greatly reducing the amount of data collected for analysis.
Historical Methods Used
The first use of the microscope to observe and record microscopic life in the 1600s greatly changed the ability of scientists to study objects and phenomena occurring at a level below the limits of the unaided eye. This is certainly true in particle analysis, and the microscope remains even today the most common instrument used for this activity. The major drawback of standard microscopes for particle analysis is the time required, both for sample preparation, and for counting and measuring properties of the particles. Additionally, since this time is required for sample preparation and analysis, the microscope can only be used to observe one static sample at a time. While this is fine for basic research in an early-discovery phase, it is unacceptable once the requirement is present for looking in detail at a process. First of all, the second phase of verifying a cause-and-effect relationship found in the discovery phase requires analyzing a statistically significant quantity of the particles being analyzed. This process is too time consuming for manual methods, and requires that some level of automation be brought to the measurements. Secondly, since this is an analysis of a process, sampling needs to be accomplished over a time period of the process. Indeed many of these processes require continuous analysis over time, an extreme example being the continuous monitoring of particles in a process for purposes of quality control. Surely, other methods are required to achieve these goals.Scientists have devised various methods and instrumentation for the automation of particle counting and analysis that can go beyond the limitations presented by the standard optical microscope. Some of the earliest instruments used for automated particle counting are based upon the Coulter principle and are referred to as "Coulter Counters". Many of these are still in use today, as they allow for rapid quantification of particle frequency and size distributions in a heterogeneous sample. The major drawback of these systems is that they are "coulter volume" based for sizing (so can not distinguish particle types), and do not provide any information on the optical properties of the particles.2
More recently, the flow cytometer has become widely used for automated particle analysis. Flow cytometers measure particle light scatter as well as fluorescence. Light scatter introduces the ability to determine some sense of morphology to the particles, and fluorescence aids in distinguishing between particles that either fluoresce or do not fluoresce in relatively narrow wavelengths. Flow cytometers work very well with relatively uniform sample particle sizes, typically within the 0.5 to 20 micron range in ESD. However, in order to obtain samples of relatively uniform particle size, pre-processing of the sample from its natural state is usually required. Another major drawback to these systems is that they use a sheath fluid apparatus in order to produce laminar flow of the sample through the flow chamber. The sheath fluid apparatus is rather complicated, requires increased set-up time, is limited to particle sizes under 100 microns, and is very expensive to replace.
Another method that has been used in parallel to these instruments being developed is simple imaging of particles in flow. Early studies using this technique made use of photographic film and a "triggered" image capture using either a flash light source or fast shutter with which to "freeze" the particles in flow. As computer technology has evolved, the film has been replaced by digital image capture hardware. With a digital image, many measurements can be made automatically through well-understood image analysis techniques originally developed in the remote sensing (reconnaissance and mapping) and medical research fields. Early on, although these measurements could be automated by the computer, they took time (non "real time") due to the computer-intensive nature of digital image processing. This limited the use of these techniques to well funded laboratories that could afford very powerful computers or specialized image processing hardware. The continued exponential growth in speed and reduction of cost of computing hardware has made this type of image analysis available to a much larger group of scientists.
A New Technique
Continuous-Imaging Particle Analysis
A new instrument for fluid particle analysis has been developed by Fluid Imaging Technologies Inc. called the FlowCAM® (Flow Cytometer And Microscope). This instrument combines the capabilities of a flow cytometer with a digital imaging microscope. The basic architecture is shown in Figure 1. Like a flow cytometer, the basic architecture can be divided into three interrelated subsystems: the fluid system, which delivers the fluid under study into the flow chamber; the optical system containing light sources, detectors, and other optics; and the electronic system, which controls the overall apparatus and does the actual processing of the images and data gathered by the various detectors.The FlowCAM can be configured in a variety of different ways depending upon the needs of the scientist. In its simplest configuration, continuous imaging, the instrument uses only the digital imaging subsystem to continuously image the sample as it flows through the flow chamber. Illumination of the sample is accomplished by the electronics triggering a flash LED light source and the frame grabber at preset intervals. The computer then processes and stores the images to disk. In order to save storage space, the entire image field is not stored. Instead, a sub-image is made by creating a "bounding box" around each particle in the image field and storing only the particle images on disk. As each particle image is acquired, data about the particle such as length, width, ESD, area and aspect ratio is calculated and stored indexed to the image itself.
In other configurations of the FlowCAM, the instrument can use either a fluorescence or forward light scatter voltage from a PMT as a triggering mechanism to collect data and images as the sample flows through the flow chamber. Essentially, this amounts to a flow cytometer with selected image capture based upon parameters (such as size, fluorescence or scatter) input by the scientist. As in continuous-imaging mode, sub-images of particles are collected with each trigger generated by the PMT, and associated data for each particle (size, aspect ratio, fluorescence strength, etc.) is stored indexed to the particle image. The data collected for each image also contains the location of the particle within the imaging field of view, which enables eliminating redundant data that might be collected if a particle were to become attached to the flow cell.
Regardless of the configuration, data from the sample flow can be gathered continuously over time with the only limitations being the speed of the processor and the overall limit for data storage imposed by the disk drive(s). This means that the instrument can not only be used in the laboratory for analyzing discrete samples, but can also be used in-situ to continuously monitor a process.
Once data is collected from a sample or process, it can then be presented to the scientist for review in two different modes: image collage or interactive scattergram. In image collage mode, the scientist can review collage images containing multiple particles in order to visually classify particle types and morphology.2 In interactive scattergram mode, the data is presented in a similar fashion as it would be on a flow cytometer. A two-dimensional plot of particles is displayed on a graph containing two variables. The simplest plot could be particle ESD versus fluorescence, with each dot on the plot representing a single particle. Other plots could be generated, such as particle size versus aspect ratio (this plot would easily show and distinguish between two different types of particles contained in the sample). Once the scattergram is displayed, the user can then interact with it by defining a box around a particular group of particles on the scattergram. This will then bring up for display an image collage containing all those particles within the box (Figure 2). This is extremely useful in isolating for display images that only contain a particular type of particle within a heterogeneous sample.
There are a number of characteristics that make the FlowCAM unique versus other instrumentation used for particle analysis. Firstly, unlike traditional flow cytometers, the FlowCAM does not use sheath fluid hardware. This greatly decreases set up and maintenance time for its use, and allows for a wide range of particle sizes to be studied, between 1 micron and 3 millimeters using different sized flow cells. Secondly, the FlowCAM uses a proprietary, patented optical element with the objective lens in order to increase the system's depth of focus. Since imaging depth of field decreases with increasing objective lens power, this added optical element greatly increases the clarity of imaging the instrument is capable of at higher magnifications. Additionally, the enhanced depth of field allows it to be used at higher flow rates (up to 10 milliliters/sec) than other instruments. As noted above, the FlowCAM also can be used for continuous analysis of a fluid flow, rather than only discrete samples typical of other methods. Finally, since imaging is an integral part of the FlowCAM, measurements such as length/width (not just ESD), area and aspect ratio are easily calculated on the fly, and the images are available for both visual and computational post-processing.
The FlowCAM has been extensively tested, and its performance validated for a number of parameters against traditional manual methods.2 These tests have validated the contribution of the depth-of-field-enhancing optics to accuracy in particle sizing, the accuracy of particle sizing and counting, the ability to accurately distinguish between particle types based upon size distribution, and the ability to continuously monitor a sample stream and detect changes in the sample's content.
Toner Particle Analysis Example
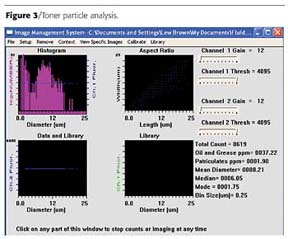
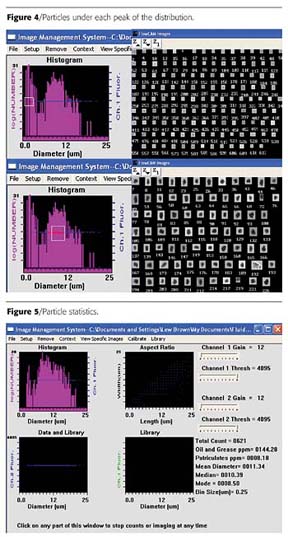
In this first example, the client wanted to automatically measure the size distribution of toner particles, both in the research lab and on the production floor. They had previously used a Coulter Counter for this analysis, but were interested in the possibility of also looking at shape and what its effect might be on toner performance. The prior technique had consistently yielded a mean ESD result of around 8 microns for "good" toner. A sample was processed through the FlowCAM, with overall results shown in Figure 3.Consistent with prior results, a mean ESD of 8.21 microns was calculated. However, the mode of 1.75 microns, and the shape of the actual histogram clearly indicate a "bi-modal" distribution. To further investigate this, the FlowCAM interactive scattergram was used to look at particles under each "peak" of the distribution. Particles contained in the smaller ESD peak (around the mode) turned out to not be toner particles, but an additive that was part of the toner mix. The client was able to see this by looking at the images, as shown in Figure 4.
The question at this point was whether the mean ESD measurement really desired was for the overall distribution (including additive) or just for the toner. The client desired to know the mean only for the toner particles. By simply changing the minimum acceptable particle ESD from 1 to 3 microns in the software, the particle statistics were instantly recalculated, with the results shown in Figure 5.
As can be seen, when the lower part of the distribution is "clipped off" by raising the minimum acceptable particle size to 3 microns, the mean ESD increases to 11.34 microns and the mode jumps to 8.5 microns.
While this is a relatively simple example, it does show the advantage of using imaging to perform the analysis. The client was able to look at the images under the lower peak of the original histogram and determine visually that the particles contained there were additive, not toner. By eliminating those particles from the distribution, a more accurate value for mean ESD was obtained. The additional benefit of using FlowCAM for this application is that the client can now use the images to study how particle shape may affect toner performance.
Fibrous Coating Filler Example
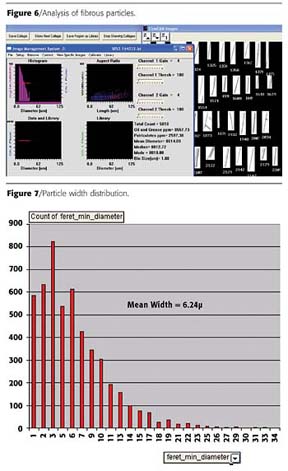
In this example, the particles to be studied were fibrous particles used as filler in a noise-reducing coating applied to acoustic ceiling tiles. The length of the particles was not all that important (and varied quite greatly due to the nature of the manufacturing process), but the width of each particle was known to be critical to product performance. The client's prior method for analyzing the particles was to use an optical microscope with an operator who would measure the width of the particles. Fifteen minutes were required on average for the operator to get a statistical sample measuring particle width for 100 of the particles. Due to the amount of time and expertise required to process each sample, this analysis was limited to the R&D laboratory only, and could not be used in production. Because FlowCAM uses digital images for measurements, and can measure length and width for each particle, it was seen as a good potential candidate to automate this analysis, with possible applicability beyond R&D and into production. A sample of this material was analyzed using FlowCAM, with typical results as seen in Figure 6.The mean ESD calculated for this sample was 14.09 microns, while the measured results from the manual microscope analysis showed a mean width of around 6 microns. For a particle of this shape, ESD does not characterize the particles (and especially the critical measurement of width) in a meaningful fashion. However, as mentioned above, FlowCAM measures length and width for each particle prior to calculating ESD. All measurements for each particle are contained in an Excel spreadsheet generated by FlowCAM's software. By simply plotting the FlowCAM measured width for each particle versus frequency using built-in Excel tools, the same results can be graphed in a manner similar to how the client desired, as shown in Figure 7.
This width distribution overlaid almost identically with the manually created one, with the mean being within .1 micron of the manually measured result. The FlowCAM was able to process over 5,000 particles in under a minute versus 100 particles in 15 minutes using the previous manual method. This yields a statistically more valid and repeatable result in much less time without requiring a skilled operator. For this particular process, this means that the analysis of these particles can be performed more frequently in the R&D lab, with the potential of actually being applied on the production floor. Once again, a great deal of additional insight is provided by being able to view images of the particles, which has led to several suggestions of additional types of particle analysis that can be applied not only to this coating product, but to several other products this client also produces.
Conclusions
A new analytical instrument, the FlowCAM, has been developed that has opened up new applications for scientific studies involving automated particle analysis. The key benefits of the technology used in FlowCAM are the ability to analyze continuous flow, the ability to analyze particle shape, and, most importantly, the fact that digital images of particles are acquired and saved for further analysis in post-processing. Because of the flexibility of the FlowCAM's architecture, it can be applied to a wide variety of applications of particle analysis, with potential future growth both in the instrument's capabilities and the types of problems it can address. For this reason, the instrument is truly an enabling technology to the scientist, researcher, product developer, QC and manufacturing personnel concerned with particle analysis in the coatings industry.Lew Brown is the manager of Marketing and Sales for Fluid Imaging Technologies. He may be contacted at 207/882.1100 or lew@fluidimaging.com.
References
1 Rawle, A. The importance of particle sizing to the coatings industry, Part 1: Particle size measurement. Advances in Colour Science and Technology, Jan 2002, Vol 5 No 1.
2 Sieracki, C. K.; Sieracki, M. E.; Yentsch, C. S. An imaging-in-flow system for automated analysis of marine microplankton. Marine Ecology Progress Series, Jul. 1998.
Looking for a reprint of this article?
From high-res PDFs to custom plaques, order your copy today!


