Quantifying and Modeling DIY Architectural Paint Application and Appearance

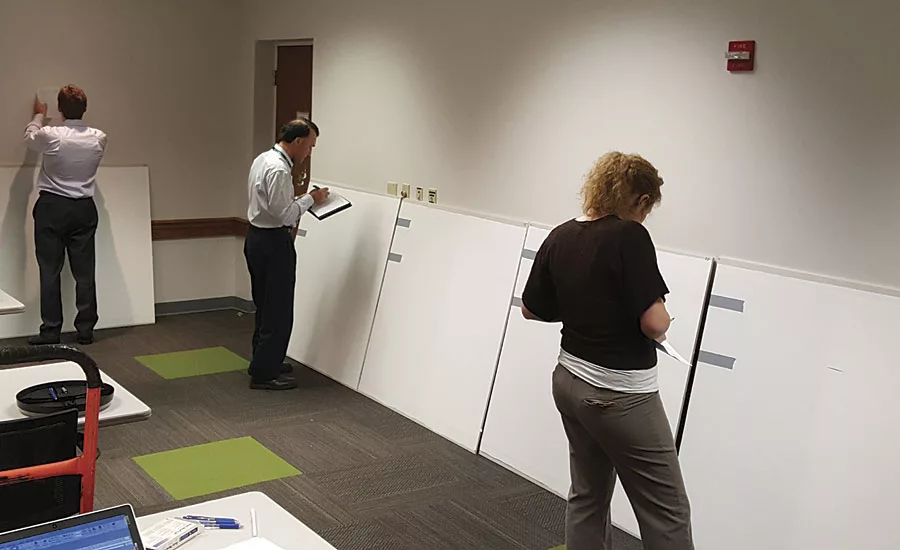
Panelists evaluating dry film appearance of commercial paints.

Paint transfer testing setup using a modified scrub machine (left picture: paint acceptance, right picture: paint transfer to sealed substrate).
During the past few years, the BASF Dispersions, Resins and Performance Additive Team has been engaged in original market research to better understand the Do-It-Yourself (DIY) architectural paint consumer market. The research included consumer focus groups across North America, which showed that DIY consumer satisfaction is largely determined by the experience with the paint, and that “Application” is a differentiating factor. Terms such as Easy, Smooth, Efficient and Spreadable were mentioned consistently across different focus groups. To better understand such qualitative descriptors and guide new polymer and performance additive product developments, the BASF R&D labs set out to establish correlations between what DIY’ers say about paint application with technical measurements.
DIY In-Person Rollout Study
An initial in-person rollout study was conducted with >50 DIY painters. Each participant painted three 4’x4’ pre-primed drywall boards with three different commercially available paints, each using a standard ½” nap roller. The commercial paints were all interior architectural satin paints (60° gloss ~20) in the $30-$50 price range, with different rheology profiles (Figure 1). The study was carried out as a blind randomized experiment with the paints labeled A, B and C. Technical measurements were taken while the painter was applying the paint, including peak and average force applied (using a force gauge mounted behind the drywall), painting time and weight of paint applied. After painting each drywall, the participants were asked a series of questions including their perception of how easy it was to apply the paint. Further, dry film appearance was rated based on lap marks, sag/drip marks, coverage and overall appearance by a BASF technical panel after the painted boards had dried. Finally, the painter was asked which paint they preferred overall.
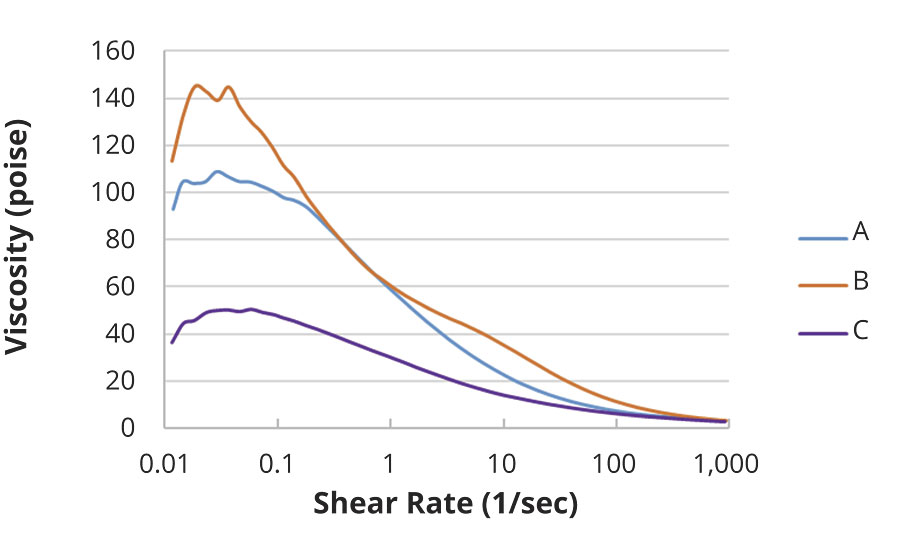
FIGURE 1 » Rheology profiles of commercial paints A, B and C.
The results of this initial study showed that the most significant driving factor for the ease of application and final dry film appearance is the amount of paint/weight applied (Figures 2 and 3). In other words, when a painter could apply more paint to the drywall board, they rated the paint higher in terms of how easy it was to apply, and the dry film appearance was rated significantly better. To our surprise there was a significant difference in the amount of paint applied between the three commercial paints, with the most weight applied by each painter when they were using paint C (Figure 4). Further, when the painter was asked which of the three commercial paints they preferred the most, almost half (48%) preferred paint C over the other two commercial paints. Table 1 lists viscosity measurements of all three paints. However, attempting to make conclusions on what paint attributes contributed to the performance of paint C compared to paints A and B was unsuccessful due to the small sample set of only three paints.
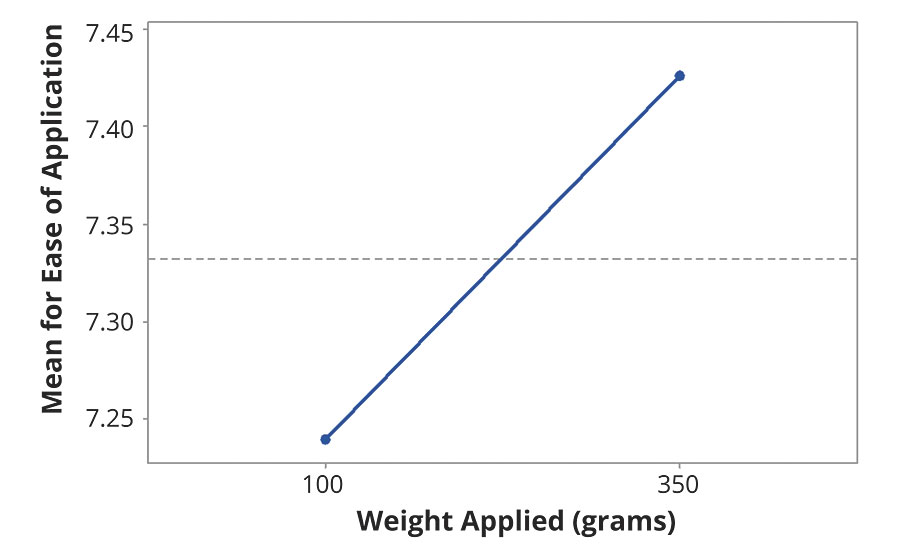
FIGURE 2 » Main effects plot for ease of application.
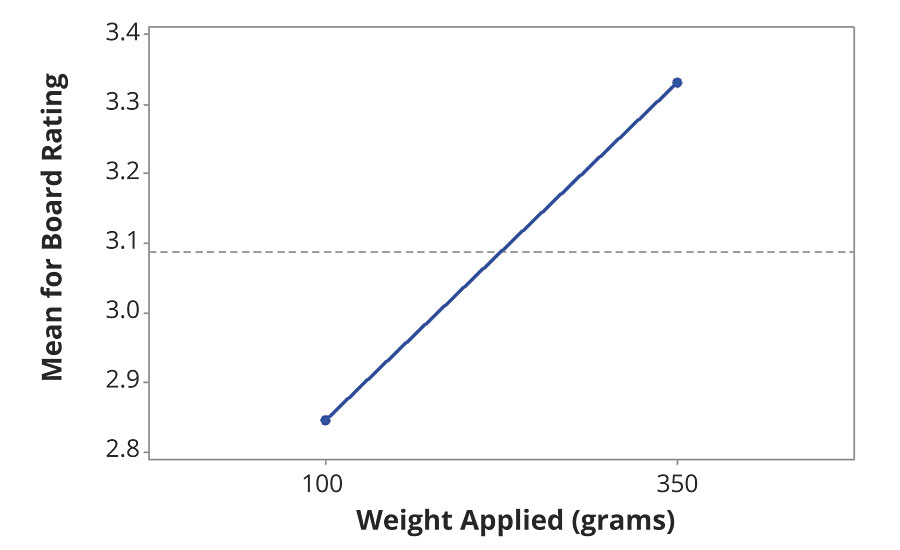
FIGURE 3 » Main effects plot for board rating.
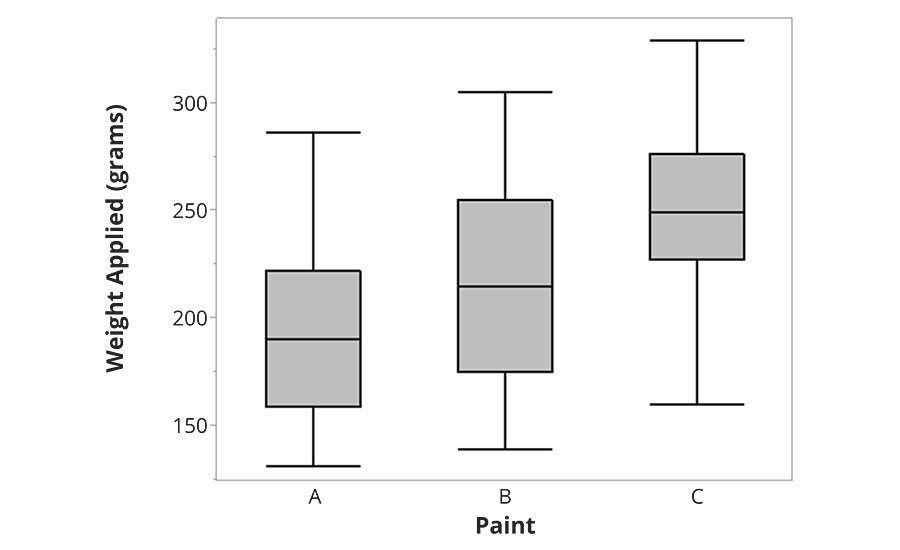
FIGURE 4 » Amount of paint applied between paints A, B and C.
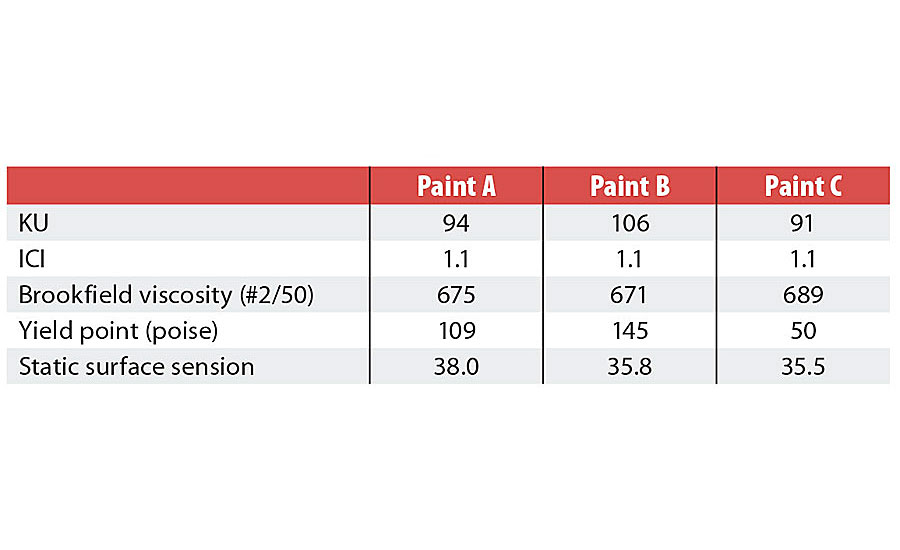
TABLE 1 » Paint A, B and C viscosity attributes.
Benchmarking Study of 20 Commercial Paints
To better understand which physical attributes contribute to DIY consumer satisfaction, a larger benchmarking study was conducted including 20 commercial interior architectural paints (60° gloss ~10; price range $20-$70). The following physical measurements were recorded for each paint: KU, ICI, static surface tensions, dynamic surface tensions (DST), rotational rheology and elongational rheology. Further, new test methods were developed to quantify the “smoothness” of the dry paint film, and to measure the amount of paint that is transferred from a paint tray to a roller and subsequently from the roller to a substrate. Each of the new test methods is briefly detailed below.
Dynamic Surface Tension
Applying paint is a process that involves rapid generation of new interfaces. The interfacial properties are determined by the rate of migration of the surface-active materials to the newly forming interfaces, which is a nonequilibrium phenomenon. Static surface tension is an equilibrium measurement that loses some of its relevance when the effects of diffusion of surface-active agents becomes significant. Therefore, BASF developed a test method to measure the DST of paints as a more predictive parameter for paint application “feel”. While DST has been used regularly in correlating printing performance of inks.1 it has not been used in coatings applications due to the high viscosity of paint formulations. The maximum bubble pressure method used to measure DST has a recommended upper viscosity limit of 50 cP. Therefore, DST data was generated from a series of diluted paints measured at intermediate to high bubble surface age values (25 ms to several minutes). The data was then used to extrapolate to practical relevant conditions of surface age and % solids. Figure 5 shows the DST of several commercial paints, which shows a wide range of differentiation. The DST at higher surface age (>1000 ms) started to approach and correlated well to the static surface tensions measured via the traditional Du Noüy ring method (Table 2).
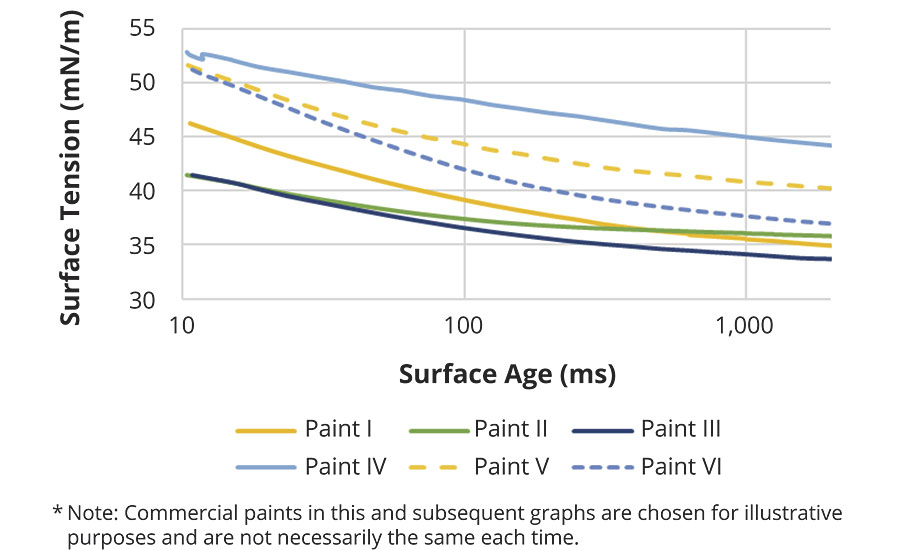
FIGURE 5 » Example of dynamic surface tension measurements for six commercial paints.
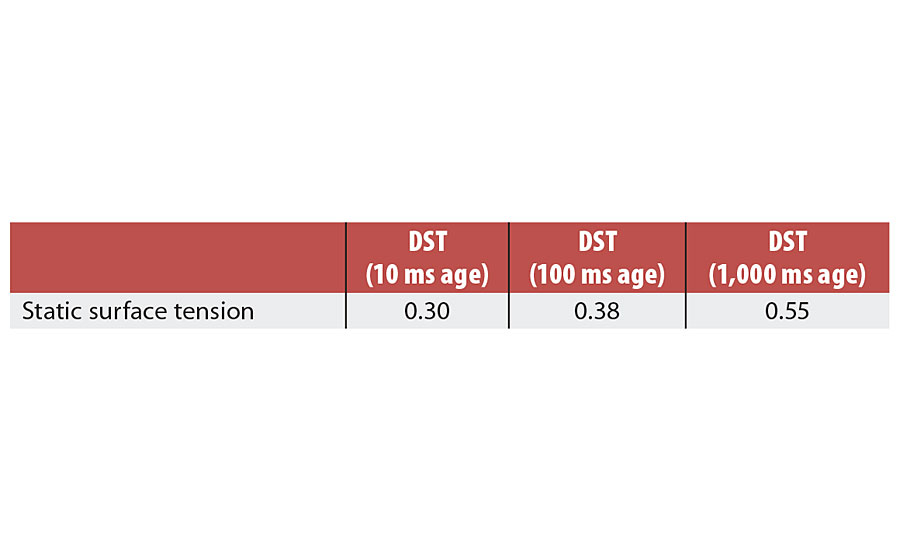
TABLE 2 » Correlation Factor (p) of static surface tension and dynamic surface tension (DST) at different surface ages.
Rotational and Elongational Rheology
The rheological properties of the commercial paints were measured via rotational “cone and plate” methods (positive and negative ramp), and by filament breakup rheometry using a HAAKE CaBER rheometer. While the cone and plate method calculates the viscosity of the paint at different shear rates (angular velocities) by measuring the torque on a narrow-angled cone in contact with the paint on a flat plate, the CaBER method measures the paint dynamics of capillary thinning. In the capillary thinning method, the paint is in contact with two plates that are rapidly separate over a short distance, while measuring the change in filament size. Similar to the DST, the latter process may be a more predictive parameter for paint application “feel”, as filament thinning is prevalent during paint transfer to and from a roller applicator. Figures 6 and 7 show some examples of the commercial paint rheology profiles.
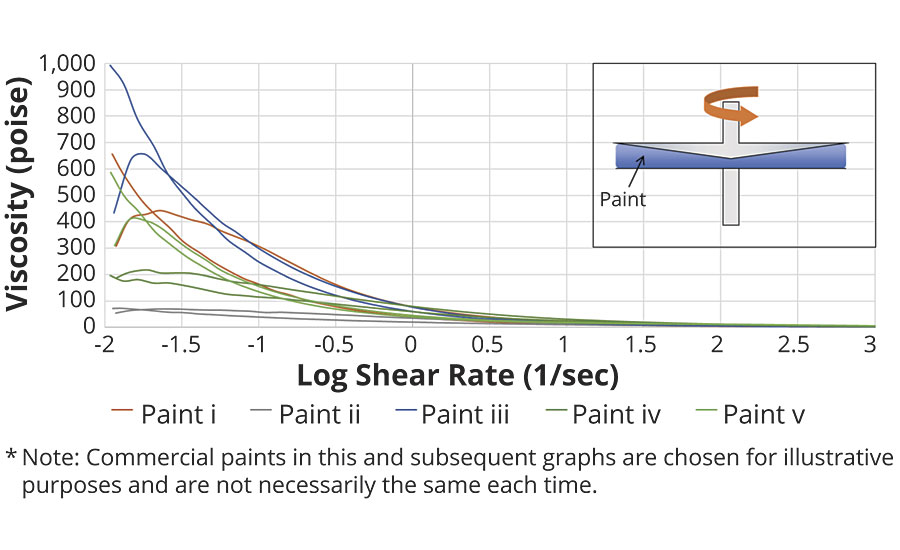
FIGURE 6 » Example of rotational rheology curves for five commercial paints.
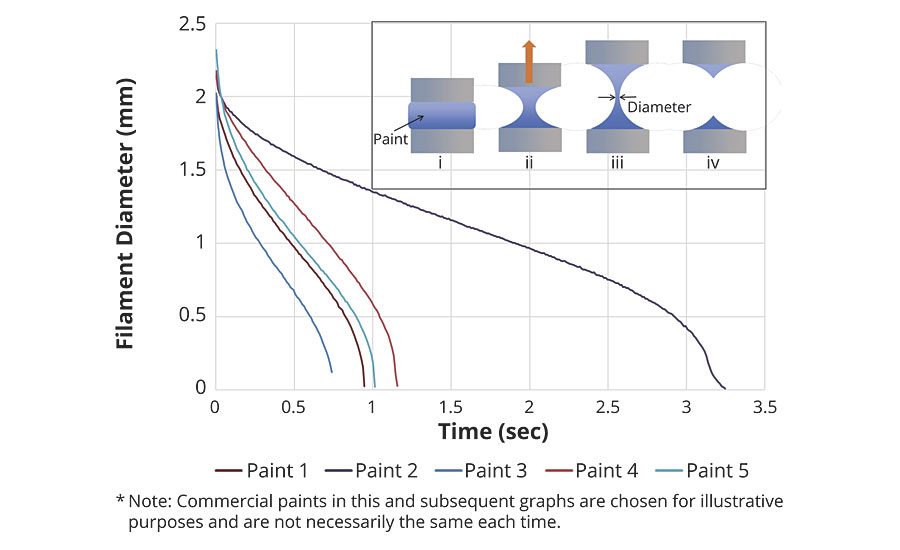
FIGURE 7 » Example of elongational rheology curves for five commercial paints.
Qualitative and Quantitative Smoothness Rating
After measuring the physical paint properties listed above, including KU, ICI, static surface tensions, DST, rotational rheology and elongational rheology for each paint, each commercial paint was roller applied to a 4’ x 4’ drywall board and the dry paint appearance was rated qualitatively by a panel of over 40 judges, based on smoothness, lap marks and coverage (Picture 1). Further, the smoothness of each paint was measured quantitatively by applying the paint to a clear polyester sheet with a nap roller, letting the sample dry and taking a back-lit digital image of the sample. These images were then used to calculate a roughness value using digital imaging processing software (ImageJ, Figure 8).2 Figure 9 illustrates that there is a good correlation between the visual smoothness rating by a panel of judges and measured surface smoothness using the method described above (correlation factor r>0.7). Further, the method using ImageJ gives a better correlation to visual smoothness ratings when compared to existing techniques such as profilometry or other surface image analysis techniques (Table 3).
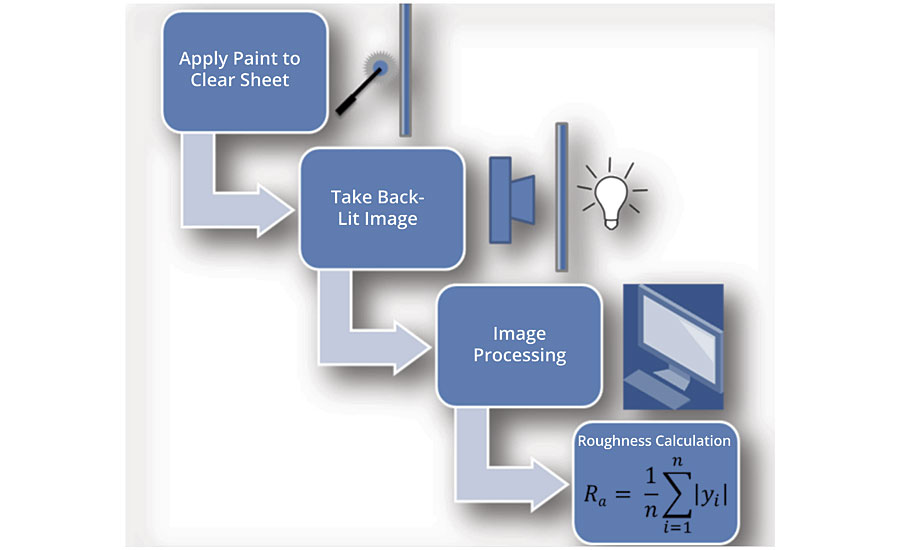
FIGURE 8 » Schematic of quantitative surface roughness measurement.
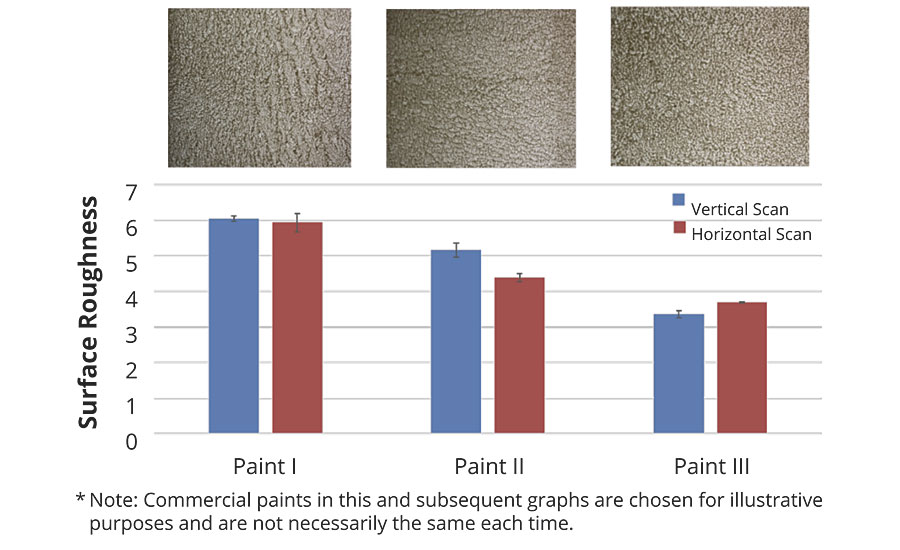
FIGURE 9 » Visual and measured paint smoothness.
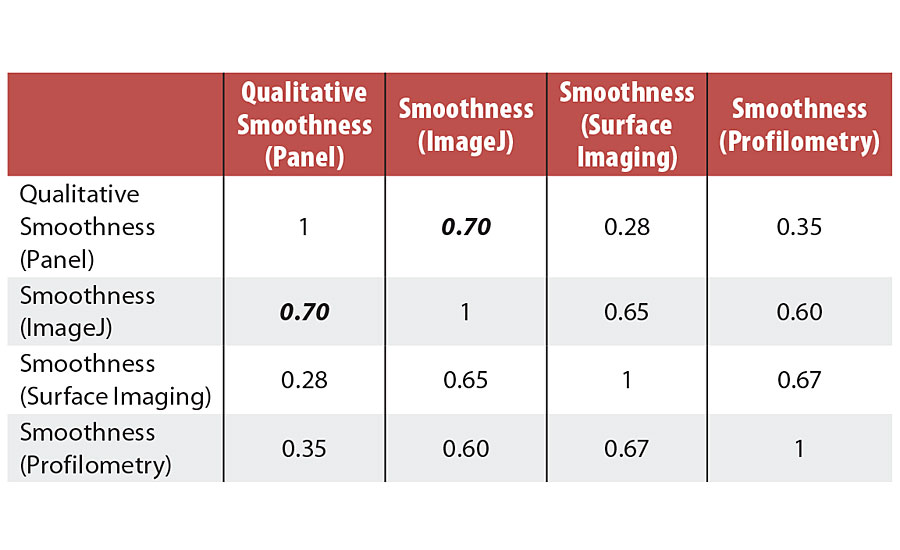
TABLE 3 » » Correlation (p) of qualitative smoothness rating and quantitative smoothness measurements.
Paint Transfer To and From a Nap Roller
Finally, a method was developed to quantify the acceptance of paint onto a nap roller and subsequently the transfer of paint from the roller onto a sealed substrate. For this method, a Washability and Wear Tester (scrub machine) was modified to accommodate a custom-fit paint tray and a modified weighted paint roller fitting a 4” roller cover. The paint tray is loaded with a predetermined amount of paint, then a preweighed and conditioned nap roller picks up the paint by rolling over it for a set number of cycles. The difference in weight is recorded as the amount of paint picked up by the roller. Immediately afterwards, a sealed scrub panel is placed under the loaded roller, and the roller applies the paint to the substrate by rolling it back and forth for a set number of cycles. Again, the difference in weight is recorded as the amount of paint released by the roller to the substrate (Pictures 2 and 3). Figure 10 shows some of the differences between the commercial paints in the amount of paint picked up by the roller (blue left x-axis; ~40g) and the amount of paint transferred to the substrate (red right x-axis, 3-6 grams).
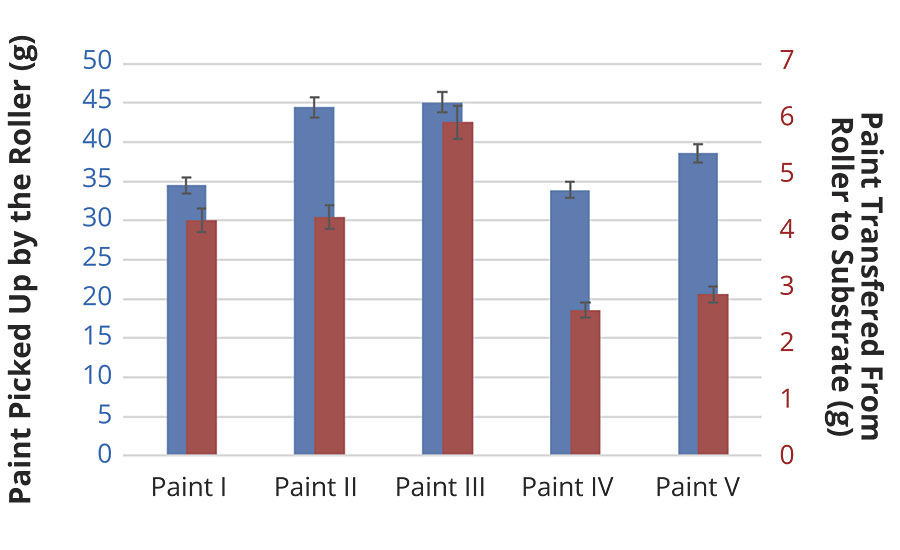
FIGURE 10 » Examples of paint transfer to and from a nap roller (paint pickup: blue left x-axis; paint transfer to the surface: red right x-axis).
Statistical Data Analysis
All the collected data was then used to develop a statistical model to predict paint transfer, paint smoothness and therefore DIY consumer satisfaction. The physical paint parameters (KU, ICI, static surface tensions, DST, rotational rheology and elongational rheology) were used as input factors (predictors), and the qualitative smoothness, quantitative smoothness and paint transfer data were used as response factors. Numerous empirical models were trained on the data; due to the nature of the data, the focus was on models that can handle i) more predictors than observations and ii) collinearity between the predictors. Partial Least Squares (PLS) models, a latent variable technique that is well suited to “reduce dimensionality”, were the most consistent in describing the data with a relative minimal number of components needed. However, to obtain decent predictability (Q2 ~ 0.6), outliers had to be identified and removed, i.e. certain samples did not fit the general behavior/chemistry of the majority. The models were then used for multiobjective optimization to predict the physical paint parameters that result in the highest paint transfer and best dry film appearance. The optimization predicted that a paint exhibiting the following will have optimum paint transfer and dry film appearance:
- High ICI
- High KU
- Elongational rheology profile with a fast reduction in filament diameter
- Newtonian rotational rheology profile (lower yield point with less shear thinning at higher shear)
Note that the predictions are made within the range of the data set. For example, the range of KU and ICI for the 20 commercial paint samples were from 91-110 and 0.6-1.6 respectively. Therefore, the model suggests a KU ~110 and ICI ~1.6. Also note, for this data set neither static nor dynamic surface tension were significant variables in predicting the paint transfer and dry film smoothness.
Choosing the Right Rheology Modifier Package
To identify a suitable rheology modifier package that would allow us to formulate the paint suggested by the model, the rotational and elongational rheology profiles of >20 different rheology modifier packages (in a standard all-acrylic latex paint formulation) were collected. Each paint formulation contained two different rheology modifiers, usually a low-shear plus a high-shear, or a mid-shear plus a high-shear rheology modifier, and was adjusted to a KU of 100 ± 3 and an ICI of 1.0 ± 0.1. The rheology modifiers used included nonionic associative (HEUR/HMPE), anionic associative (HASE) and nonassociative thickener (ASE) technologies. Not unexpectedly, the rheology profiles between the paint formulations with different thickener packages showed significant differentiation. For example, Figures 11 and 12 show the rotational and elongational rheology curves of Rheovis® AS 1237 in combination with Rheovis HS 1303 (orange curve) compared to of Rheovis AS 1188 in combination with Rheovis PE 1331 (blue curve). According the model developed above, the Rheovis AS 1188/Rheovis PE 1331 would be more desirable in this particular formulation, since it shows a more Newtonian fluid behavior on the rotational rheometer and has a faster filament reduction on the HAAKE CaBER rheometer.
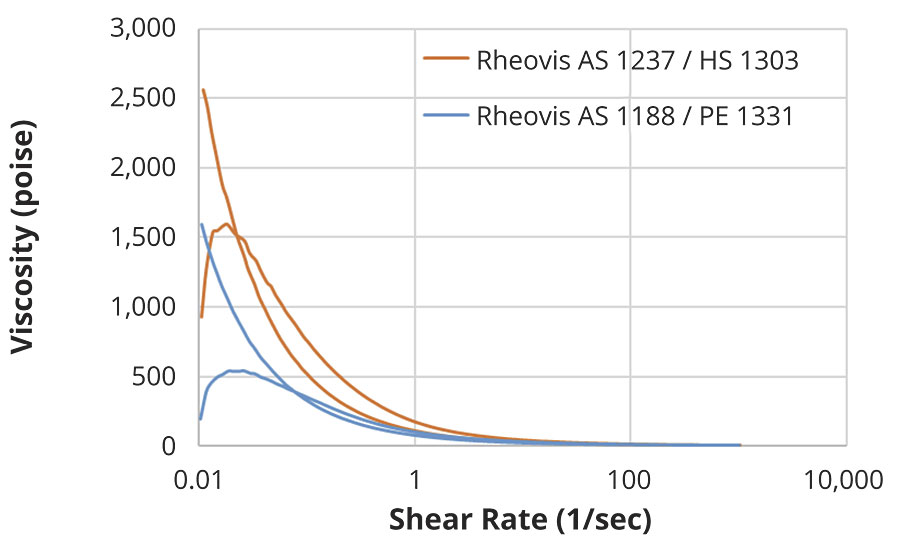
FIGURE 11 » Rotational rheology profile of an all-acrylic latex paint formulation with two different rheology modifier packages.
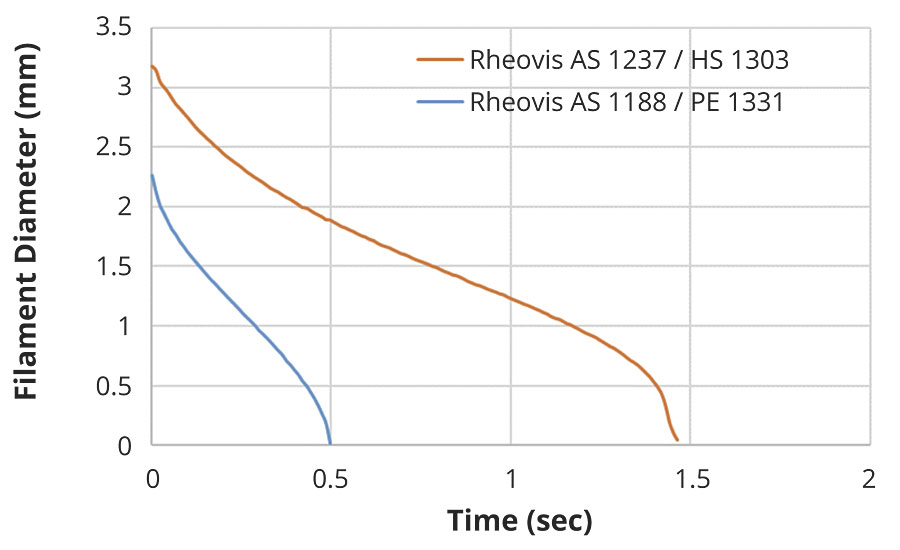
FIGURE 12 » Elongational rheology profile of an all-acrylic latex paint formulation with two different rheology modifier packages.
Model Paint Formulation and Rollout Study
The insights gained above were then used to formulate two paints at 23% PVC. The first paint was formulated to a low KU (90), high ICI (1.5), an elongational rheology profile with a fast reduction in filament diameter and a Newtonian rotational rheology profile. The second paint was formulated according to the model with a high KU (115), high ICI (1.5), an elongational rheology profile with a relatively fast reduction in filament diameter and a relatively Newtonian rotational rheology profile. Note that once the KU is increased, it becomes more difficult to achieve a fast filament reduction and Newtonian rheology profile. However, for the paint at a high KU and high ICI we chose a thickener package that gave the fastest filament reduction and most Newtonian rheology behavior possible (Figures 13 and 14).
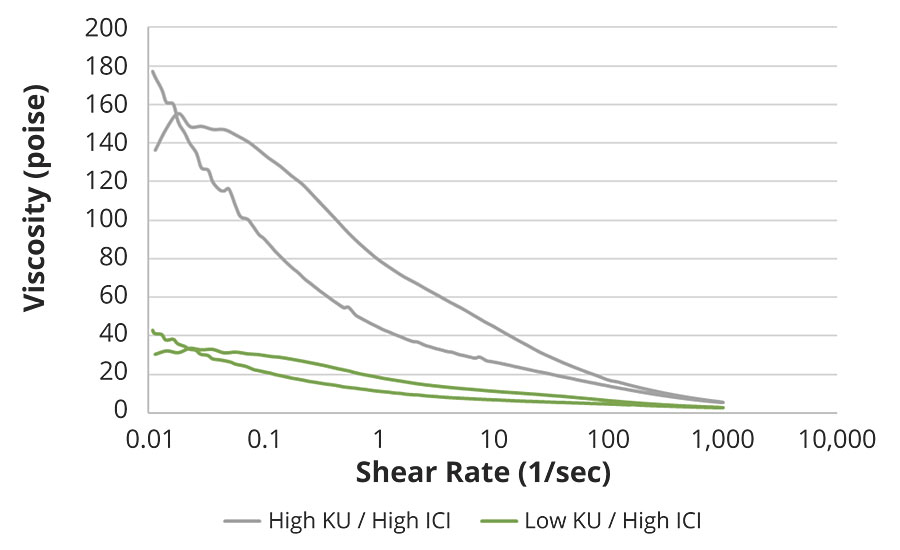
FIGURE 13 » Rotational rheology profile of BASF formulations with low and high KU viscosities.
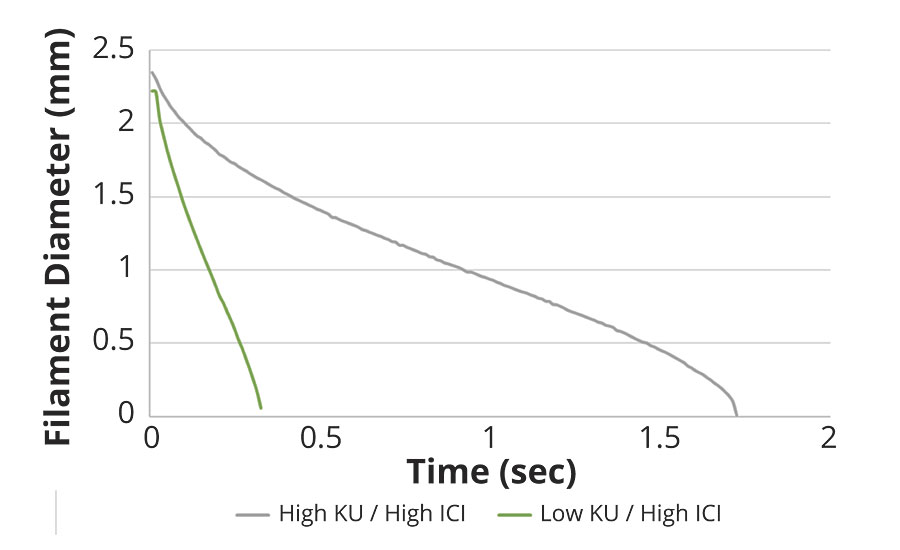
FIGURE 14 » Elongational rheology profile of BASF formulations with low and high KU viscosities.
The two formulated paints were then compared to three of the commercial paints. The most preferred paint from the initial DIY Live Rollout Study (Paint C) was included as one of the commercial paints as Paint 1. Using the paint transfer test described above, the BASF formulated paints show slightly less paint pickup and transfer compared to the preferred commercial paint (Paint 1), but significantly more than average commercial paints (Paints 2 and 3; Table 4). Further, the paints were evaluated subjectively based on application feel by a panel of four judges on a scale from 1-5 using similar methods as in the Live DIY Rollout Study (1 = worst; 5 = best). On average, the BASF formula with a high KU (115) and high ICI (1.5) ranked highest among the all paints tested here (Table 5). Finally, the smoothness of each paint was measured using the Quantitative Smoothness test described above. Figure 15 shows that the BASF formulas have a comparable surface roughness to the most preferred commercial Paint 1. Overall, these results show that the model developed from the benchmarking study serves as a good starting point to formulate a paint that results in a positive painting experience with high DIY consumer satisfaction.
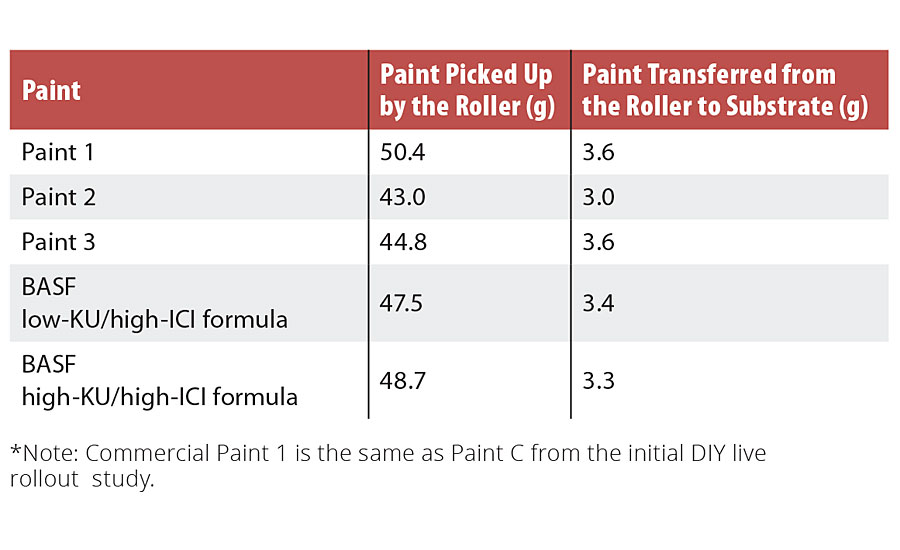
TABLE 4 » Paint transfer of BASF formulated paints vs. commercial paints.
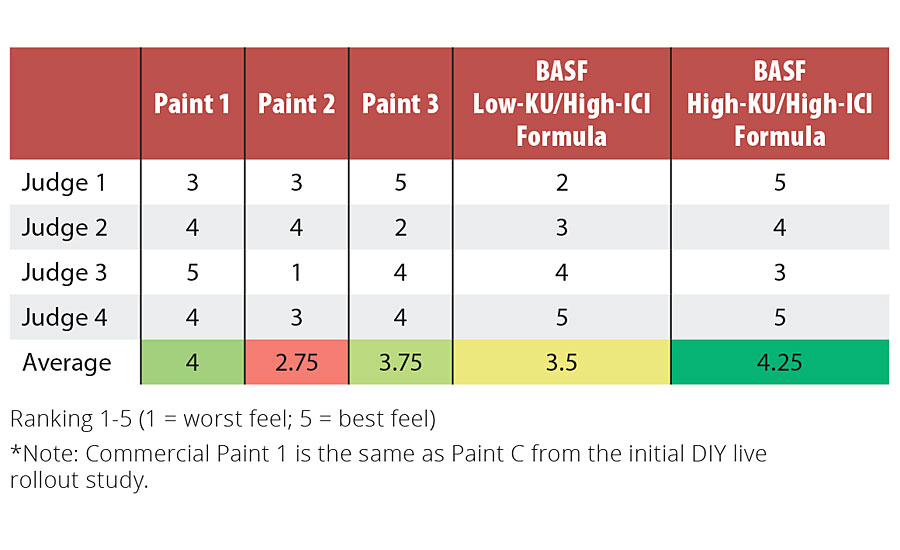
TABLE 5 » Application feel of BASF formulated paints vs. commercial paints.
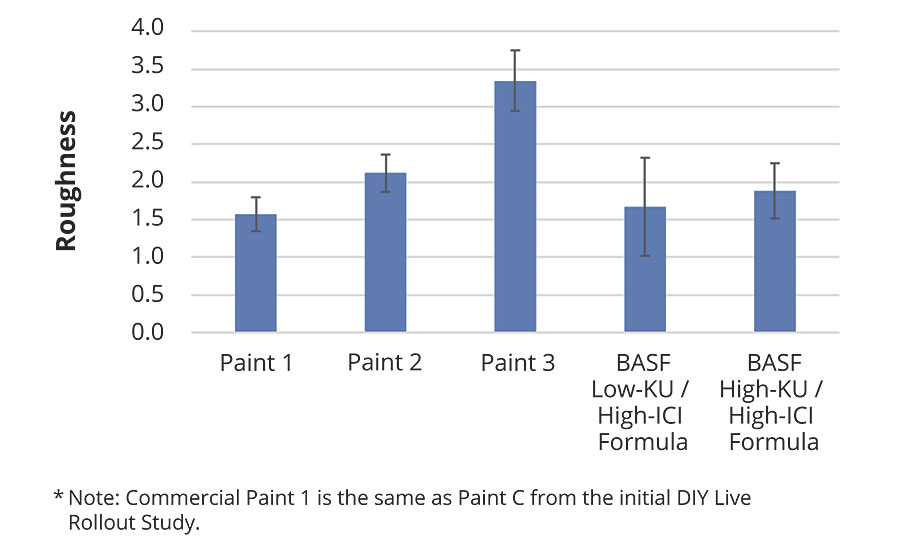
FIGURE 15 » Surface roughness of BASF formulated paints vs. commercial paints.
Conclusions
The live DIY consumer roll-out study along with a comprehensive benchmarking study of >20 commercial paints gave insights into physical paint parameters that result in DIY consumer satisfaction. The most significant parameters identified here include balancing a relatively high KU and ICI viscosity with fast reduction in filament diameter (elongational rheology), and a more Newtonian rotational rheology profile. Further, we demonstrated that BASF can leverage its comprehensive product portfolio including polymer dispersions, performance additives, pigment extenders and colorants to help paint manufacturers formulate paints that improve the DIY consumers’ overall painting experience. Finally, these results help guide future product developments, especially when it comes to synergistic effects between additives and dispersions to achieve some of the model terms and therefore DIY consumer satisfaction.
Acknowledgements
We thank Brandon Achord, Kyle Flack, Nicholas Foley, Kaliappa Ragunathan, Christina Nebel, Amy Ethier, Adam Cummings and Bill Rosano for supporting this work.
References
1 Bassemir, R.W.; Krishnan, R. Practical Applications of Surface Energy Measurements in Flexography, FLEXO (July 1990).
2 Ethier, A.; Cummings, A. Quantifying Paint Surface Smoothness: Presented at the 32nd Biennial Western Coatings Symposium and Show, Las Vegas, NV, Oct. 2015.
Looking for a reprint of this article?
From high-res PDFs to custom plaques, order your copy today!


-(1).webp?height=200&t=1668413861&width=200 "industry-news-or-company-news-(1) (1).jpg")