A Winning Formula: Sustainable Profitability through New Technology Development

At the start of a new decade, timely, affordable and scientifically sound answers are urgently sought for our planet, including, for example, rebuilding deteriorating infrastructure and outdated water management systems, and revolutionizing transportation and telecommunications. In 2020, polymer science will garner significant attention at technical conferences, and with the release of actionable market data that ChemQuest researched for the American Coatings Association’s U.S. and Global Market Analyses for the Paint & Coatings Industry (2019–2024). Which innovative materials are likely to be disruptive to markets? Are attractive synergies emerging in paint/coatings and adhesives/sealants for the upstream specialty chemicals’ value chain? This article examines current market dynamics, innovation drivers and various outcomes.
U.S.-Based R&D Investments
Profitably operating in future paint and coatings markets through competitive differentiation, amid economic and geopolitical challenges and severe supply chain pressures requires broad insight well beyond a practitioner’s respective four walls. Since the late 1980s, refining innovation processes and reliable key performance indicators (KPI) to launch new technologies into new and existing global markets against a backdrop of turbulent economic conditions has been at the forefront of my profession.
ACA’s 103-page, U.S. New Technology Development and Marketing Opportunities Chapter relates to current research trends and emerging technology in seven areas as follows:
-
Sustainability
- Bio-based materials
- Waste reduction
- Energy reduction
-
Regulatory
- Low/no VOC
- Isocyanate free
- NMP, BPA, formaldehyde free
- Metal-free
-
Corrosion
- Chromium alternatives
- Durability
-
Multifunctional
- Anti-microbial
- Anti-corrosion
- Anti-icing
- Antifouling
- Self-cleaning
- Self-healing
- Color
- Application
U.S.-based materials research and development is predicated on various types of research and funding models, and is conducted by academic institutions, independent laboratories, real-world manufacturing material research institutes, raw material suppliers, formulators and the U.S. Department of Defense. Market consolidation continues to shape R&D portfolios and investment. Primary business drivers for R&D investment are regulatory, cost and performance. Consumer drivers for R&D have become particularly important, especially related to sustainability and “green” coatings. ACA’s New Technology Development and Market Opportunities Chapter outlines megatrends, and future technology and coatings markets.
Market Dynamics
Some incumbent coatings manufacturers lament that in certain markets price growth is severely hindered by buyers who exercise unmitigated purchasing power to the point that even the presumed pass-through of the manufacturer’s increased costs of raw materials is delayed by six months or longer. Flat market value growth is sometimes attributed by those suppliers to lower volume sales over time.
Decreases in volume and pricing may each contribute to flat value growth as voiced by incumbent suppliers, but these are distinctly separate events with different remedies.
Initially, a product innovation that finds its position in the marketplace may result in both higher pricing and lower volume. The latter might be the result of improved productivity, e.g., higher transfer efficiency or improved performance at lower coat weights. If the product launch is true innovation that delivers intrinsic value, the resulting lost revenue on lower volumes sales should be partially (if not wholly) offset by higher pricing and market penetration. Ultimately, true innovation can’t be easily copied or substituted (ignoring IP protection). When a product can be substituted, the buyer regains leverage to be able to drive pricing down. The central question for the incumbent supplier is whether the product was truly differentiated in innovation?
If, however, the central complaint is flat value growth over time, reviewing the S-Curve of Business is in order.
What Is the S-Curve of Business?
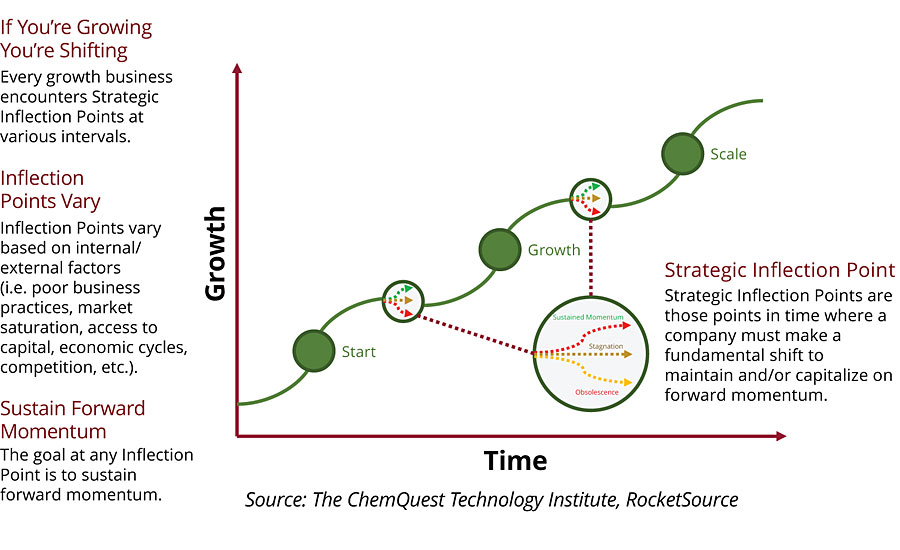
The “S” in the “S-Curve”, which stands for “Sigmoidal,” is a mathematical term related to the way the curve is derived. Think of it as an S-shaped curve for forecasting how a business will grow over its life cycle. Hindsight makes it easy to examine how your business grew, but interpreting and acting on a company’s performance fluctuations in real time using the S-Curve requires knowledge and planning. Specifically, the so-called inflection points of the S-Curve that demonstrate where your growth has stagnated are the most challenging to identify. In the moment, you may believe your competitors are at fault, leading to an ill-conceived counterattack that may temporarily feel good but won’t improve business performance and could jeopardize an otherwise disciplined market.
The Stages of the S-Curve
Every business starts the S-Curve model at the bottom with a new product or service to sell to the mass market or a niche. The business begins to grow as a product gains traction in the marketplace through increased sales and as brand recognition develops. As the business expands, growth continues. Internal and external factors eventually cause the growth rate to taper off. The causes vary: competition adjusts and targets your customers; your product portfolio reaches market saturation with limited opportunities for market expansion; or poor company management could be to blame.
That tapering-off point is also a turning point – a slight decline in growth may quickly accelerate generating negative growth. At this juncture innovating afresh to stay relevant can initiate a new upward growth curve (a true inflection point).
Well-planned contingencies that recognize and prepare for inflection points in advance allow a business to navigate an S-Curve’s ups and downs more effectively, as shown in Figure 1.
How to Navigate an Inflection Point
In short, innovate and optimize. When you reach a saturation point, processes and customer deliverables must be optimized for increased efficiency. Innovating by expanding your product portfolio can allow your company to adapt to external factors and generate new opportunities for growth.
An S-Curve for each new product in a company’s portfolio can wind up overlapping with its other products; the challenge is to continually innovate to create new S-Curves to stay ahead of the original S-Curve. This product development cycle isn’t new – it’s been true for the past 50 to 60 years, as depicted in Figure 2.
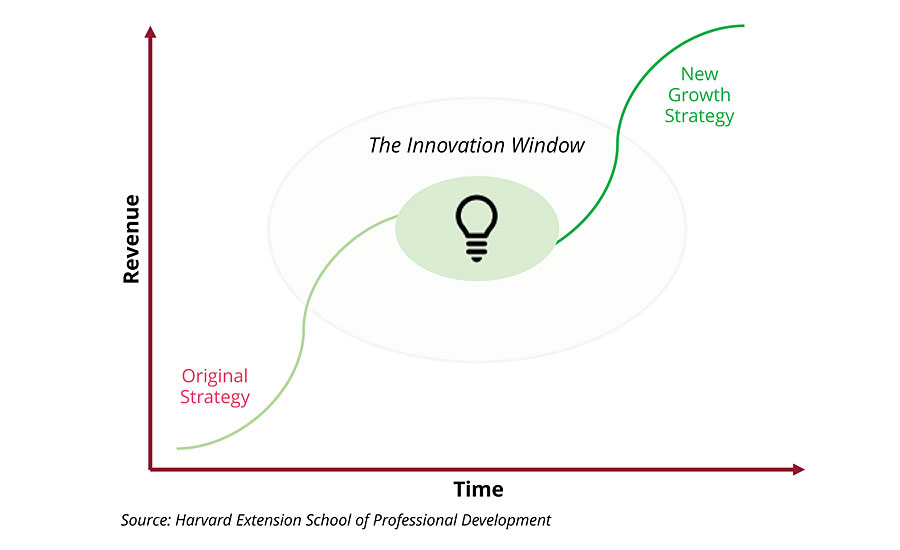
How can the trend of persistent flat value growth be reversed? The answer is straight-forward: innovate at a faster pace, create new S-Curves at a much faster pace, and always stay ahead to maintain leverage with your customers.
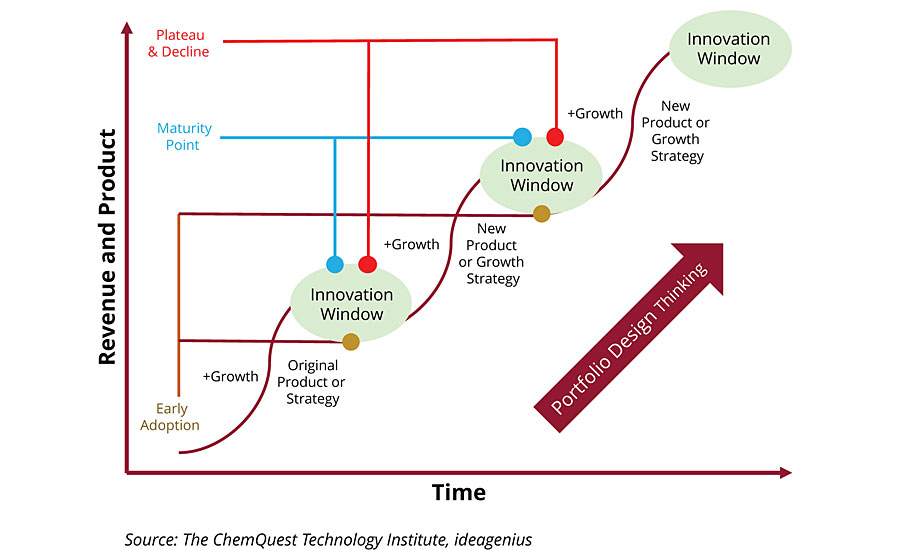
Reversing a market’s stronghold on pricing over the long term, which perhaps is the result of buyer consolidation, may require more insight and analysis for a remedy. Yet we should expect even high-performance materials to come down in price in time, depending on the competitive response and substitution effect. The supplier’s sales team should be able to sell the higher priced material to customers based on life cycle analysis and other means. The S-Curve demonstrates the timeline and process of product adoption, beginning with introducing the initial technology, gaining early adopters, then moving through the cycle of fast growth as newer innovations are launched along the way, until the initial technology reaches the point of maturation and inevitably declines. The challenge for suppliers is to develop a market strategy beyond product launch with periodic new product features and benefits, resisting the temptation to ride that S-Curve until the product dies or is substituted, while constantly innovating (and speeding up) to stay ahead of the curve on innovation, demonstrated in Figure 3.
Competitive markets will ask for product discounts. Users will also improve a coatings system’s transfer efficiency through both application equipment as well as formulation. The outcome is less product required to do the job, with improved overall productivity. Once again – this is not new. In some markets such as automotive OEM, suppliers are taking on transfer efficiency innovations at the request of their OEM customers, albeit for a fee. Once again, their challenge is to continue to maintain or speed up innovation.
Automotive OEM is a case in point: 40 years ago, wet-on-wet automotive coatings didn’t exist. Instead, after every process step, whether it was wet coat, primer or base coat, the product required time for drying. OEMs were forced to spend time and money to move their end product on their assembly line to the next step in the application. Between 2000 and 2010, wet-on-wet coatings were readily accepted, evolving at a faster pace: a chemical reaction took place between coats; the second coat sped up the curing process. Once you applied the second coat it was already starting to cure on an air-dry-through basis, with IR and oven bake initiating the final curing of the second coat. The payoff, by some estimates generating a 20%+ savings, was reduced labor, the elimination of conveyor belts, and a reduced footprint in the plant that was previously required for curing the first coating layer before applying the second layer.
Fast forward another 10 years to the introduction of wet-on-wet-on-wet coatings: a primer coat, base coat and a clear coat are applied in one shot. Consider that if the automotive coatings industry would have stopped innovating with the first generation wet-on-wet coating system, the technology would have been copied, allowing buyers to regain leverage, driving down price long before the year in which wet-on-wet-on-wet technology was introduced.
Outside the U.S., lightweighting and consumer preferences for smaller vehicle size are additional factors in automotive OEM volume drop. When volume drop due to vehicle size preference is coupled with stale technology, the volume drop is compounded by a price drop, illustrating that lower volume and pricing are not always innovation driven but can be exacerbated by a lack of innovation and conversely improved with innovation.
Value Beyond Your Corporate Walls
A combination of timely market knowledge and technical insight informed by business, economic, consumer and technology trends are required to successfully determine which features and benefits are in demand and how to position and price new technology for an attractive return on investment.
Innovators require definitive (unbiased) answers to questions such as:
- What value is the market willing to pay to use the new technology?
- What are the unmet market needs?
- How will my coating system perform when it leaves my laboratory?
What keeps the end user awake at night is a question every formulator should be able to answer. Translating users’ needs into a chemical solution is known as a “formula-later” approach to innovation. A supplier developing technology within its own laboratory does so wearing blinders of their own business. Tap a credible external resource to remove the blinders and gain capabilities to augment your internal resources, including:
- Unparalleled knowledge of unmet user needs across the specialty chemicals value chain.
- A clearer vision of all potential applications to allow for proper screening and prioritization of market opportunities.
- The capability to synthesize, formulate, apply coatings and adhesives, validate test data and benchmark against industry standards, with unlimited access to engineering design.
- A real-world manufacturing material testing facility for final testing of your materials and a pilot-run de-risking implementation on your customer’s production line.
From an innovation standpoint, looping these recommended external resources together to support your internal resources makes good business sense for the next decade.
Long-Term Value Creation (Pricing Innovative Chemistry Platforms)
A number of new monomers are under development. Given that sustainability in all aspects of a product’s lifecycle is a key driver, a portfolio with new bio-based monomers for epoxy and polyurethane applications (and specialty epoxy resins) seems pertinent for examining a true innovation’s profitability over time.
The higher molecular weight epoxy monomer is high modulus (rigid) and can impart high water resistance, with the same performance properties of a conventional epoxy resin. The monomer’s stiffness or modulus can be fine-tuned for increased flexibility, which, from a chemistry standpoint, is much easier to accomplish than if you start with a softer, lower molecular weight material and attempt to make it more rigid, then try to add higher crosslink density for solvent and chemical resistance.
Some of the built-in characteristics relative to the chain extenders (the functional groups on the ends of these chains) provide good adhesion promotion. Compared to a conventional epoxy, which tends to lose adhesion when made rigid, this monomer can be rigid or flexible, it has adhesion, it has crosslink density, and it imparts resistance to water, solvents and chemicals.
Where does the developer go in the marketplace to profitably position this monomer? Often, the brainstorming exercise to answer this question will take place at least initially within a supplier’s four walls. Application ideas are entirely dependent on the internal team’s collective market experiences, many of whom are overly invested participants of the development process. Suggestions might range from electric vehicle assembly or electronic encapsulation to civil engineering adhesives, or direct-to-metal (DTM) coatings.
But what if that exercise to identify profitable applications for new technology starts in reverse with an end user who needs a rigid yet flexible material with high water resistance, offering better adhesion characteristics? In this scenario, a supplier’s understanding of user needs and trends informs its chemistry from the get-go.
The following historically true “go-to-market” approach for many raw material suppliers highlights the importance of a good pricing strategy.
A raw material supplier often lacks a direct connection with end users. From the raw material supplier’s perspective, why engage an external resource to understand the end-use market when their customers have those insights? Yet going directly to your customers for user insights may not be the right path, either – consider their pricing objectives, other partnerships and bias. Of course, the other option is to go around your customer to learn the downstream potential of your raw materials. Let’s say the monomer supplier decides on the former, so they agree to “throw their product over the wall” to be evaluated by their customer for one promising application. First and foremost, nothing in this scenario is limiting the customer to one application, particularly with a new innovative platform chemistry.
If their customer does their job properly, they won’t merely swap out their current raw material for the new material in one application. Instead, as they look at their monomer supplier’s material across the board in many applications, they are optimizing it to the core features and benefits that it’s bringing to various applications. The results of the customer’s optimization testing have tremendous dollar value to the raw material supplier for years if not decades to come, yet it’s in their customer’s best interest not to share those results.
As we’ll see, the process of throwing the product over the wall immediately begins the loss of leverage the raw material supplier has with its customer, putting pricing at risk from the start. Because their customer won’t disclose to them all of the applications in which they’ve tested nor will they disclose the application area(s) for which their product is slated. What amount of their product is in the formula? What is the ultimate price advantage to the formula? That information is the monomer’s overall value proposition.
In summary, the raw material supplier is now blind to how or where their material is being used, and what value it brings to the end customer, and how it may enable new market growth.
Obviously, the raw material supplier should have opted to go around their customer. But it’s not hopeless if they didn’t – the gaps can be filled in for them by engaging a specialty chemicals market expert who can help them understand exactly how their material can be positioned in the marketplace and what value it has based on the features and benefits that it offers in various application areas.
The difference between an informed pricing structure and a blind one is staggering: knowing your material is a likely substitute for a material currently being sold, let’s say, at $1.29 per pound, the supplier calculates that same price will yield a 40% gross profit, which sounds pretty good. In reality, that $1.29 price point doesn’t take advantage of the features and benefits of the material. Instead of a single price point, the raw material pricing strategy can be customized according to their customer’s uses and the potential products that can be derived from that platform chemistry. Maybe the pricing structure should encompass two products: $1.50 for high modulus and a $1.80 for low modulus? That is the perspective that is lost merely by throwing the product over the wall with no knowledge of where it’s going. That’s how the raw material supplier loses leverage from the first time they sample the product, unless they do their homework. But this example gets even better.
Let’s say to their surprise the supplier learns its monomer has a use in athletic footwear as a thermoplastic polyurethane (TPU) – which goes for maybe $4 per pound. How does the $1.29 price point look now? A platform chemistry easily spins five or 10 different technologies, with each of those spawning additional products – literally a branching tree with the tree trunk representing the platform. Circling back to the S-Curve, each tree branch is in play until a substitute comes along.
IP Strategy
Newly developed platform chemistry with a composition of matter patent creates a ~20-year timeline before it becomes null and void. The platform chemistry is likely to enable additional technologies that are still part of the composition of matter patent (ignoring manufacturing and application patents).
Assessing the sales cycle timeline and the product development cycle time is critical to profitability. For example, a product developed with applicability in aerospace will require a lengthy supplier qualification delaying ROI for between eight to 10 years, or roughly half its patent life. Without the patent, an aerospace product will likely be copied within a few years. An architectural application, by comparison, has a two-year window before it is copied or substituted.
In each instance, there’s a critical planning process and timeline for a development and sales cycle based on IP, trade secret protection, and most importantly how quickly and easily the innovation can be copied or substituted.
I know of unpatented core shell technologies developed in the early 1980s. Forty years later those technologies that were not easily copied are still paying back very handsomely.
For more information, contact Daniel Murad at 513/469.7555 or at www.chemquest.com. Visit paint.org/market for more information on ACA’s downloadable U.S. and Global Market Analyses for the Paint & Coatings Industry (2019–2024).
Looking for a reprint of this article?
From high-res PDFs to custom plaques, order your copy today!


