Oil is Oil….Until it’s Not
An Investigation into the Coating Structure-Property Relationships of Various Process Oils


Prefer the magazine experience? Subscribe to our digital edition here.
Process oils are used in a myriad of applications such as coatings, rubber, inks, sealants and carbon black dispersions. 1 As these oils are used in a variety of industries, the characterization and nomenclature used is not specific to any of the aforementioned applications. The American Petroleum Institute (API) divides process oils into five categories based on chemistry, viscosity index, sulfur content and type/degree of processing. 2 While this information is important, not all of it is immediately pertinent to the coatings formulator. Conversely, information pertaining to coatings performance is absent. The dilemma is not the fault of the oil vendor or the formulator. Rather, the oil vendor has a responsibility to its diverse customer base, and to some degree the industry as a whole, to ensure that specifications, testing and nomenclature are as standardized as possible.
The goal of this study was to understand how the properties of process oils (15 naphthenic and one paraffinic) influence the coating properties of a two-component aromatic urethane system. Techniques common to polymer/coatings chemists were used to elucidate the structure-property relationships between process oils and their impact in coating performance.
Experimental
Brookfield Viscosity
Oil viscosity was measured using a Brookfield viscometer (Model RVT) at 25 °C using a #3 spindle. For 13 of these oils, the viscosity (reported in centipoise, cP) was measured at 100 rpm. Oils 1, 2 and 11 were tested at 20 rpm because of their higher viscosities.
Coating Preparation and Application
Each process oil was evaluated in a model, two-component aromatic urethane coating. The A-component, containing the process oil, was prepared with a laboratory-scale Dispermat using a Cowles blade. The pigment/filler dispersion time for each coating was 30 min at 3,500 rpm. The B-component consisted of an isocyanate-functional urethane prepolymer solution. Coating films for tensile testing were prepared by mixing the A and B components together, and applying the blend onto a release panel (BYTAC®, Saint-Gobain) at 50 mils wet film thickness and allowed to cure at ambient temperature for one week. To test intercoat adhesion, a base coat was applied at the same wet film thickness onto plywood panels. After the base coat was cured, a second coat was applied, into which fabric mesh was embedded during application. Each coat was allowed to cure for 72 hrs at ambient temperature.
Tensile Testing
Tensile testing was conducted at a rate of one inch/min with a 2 kilo Newton (kN) load cell on an Instron 3365. Tensile stress at maximum load (psi) and time-at-break (min) were evaluated. Three specimens for each coating were tested, and the results were averaged (except for Coating 7, as it exhibited severe pigment settling and was still tacky by the end of the cure time).
Cloud Point
Cloud point testing was conducted using a Novomatics Chemotronic Cool apparatus. Each test was performed by weighing 10 grams each of the test oil and the B-component in a test tube and blending with a stir bar. The blend temperature was increased from ambient temperature to 230 °C and held for 2 min before cooling. The cloud point was taken as the temperature at which the sample became hazy.
1H NMR Spectroscopy
Proton NMR (1H NMR) spectroscopy was conducted on a 30 mg/g solution of the test oil in CDCl3 (test duration 10 min, 40 scans) using a 60 MHz NMR spectrometer (Magritek Spinsolve 60). Peak integrations of aromatic, benzylic, 2°/3°/cycloaliphatic and 1° protons were evaluated and then expressed as a percentage.
Intercoat Adhesion Testing
After allowing both coats to cure, the coating was scored with a razor blade along each edge of the mesh. A Rapala 50 lb/25 kg digital scale with a hook on it was used to pull away the mesh perpendicularly from the coated plywood. The force (ounces) necessary to remove the mesh, as well as the failure mode, i.e., adhesive (unfavorable) or cohesive (favorable) was reported.
Results and Discussion
Oil Viscosity and In-Can Observations
Each A-component blend was allowed to equilibrate for 1 week prior to testing. Table 1 summarizes the oil viscosity and the degree of pigment/filler settling in each A-component.
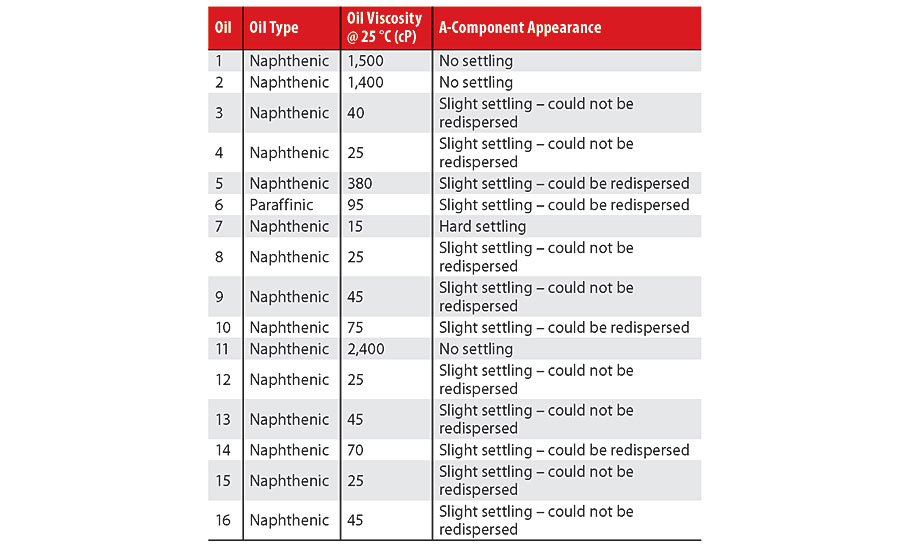
At the end of one week, it was noted that only blends with oils characterized by a viscosity of at least 1,400 cP did not exhibit pigment/filler settling, i.e., Oils 1, 2 and 11. Various degrees of settling occurred in the other 13 A-component blends: partial sedimentation where the pigment/filler could and could not be re-dispersed, as well as complete sedimentation. The A-component blend with Oil 7, which had the lowest viscosity (15 cP), exhibited complete, hard sedimentation. Determining the definitive transition viscosities between categories was not attempted for lack of an exhaustive dataset, e.g., a substantial gap between the viscosities of
Oil 5 (380 cP) and Oil 2 (1,400 cP). The oil chemistry did not appear to strongly influence the degree of sedimentation. For instance, Oil 6, although being of a different chemical type than the other 15 oils, yielded an A-component blend that could be re-homogenized similarly to Oils 5 and 10, whose viscosities were greater than and less than the viscosity of Oil 6 (95 cP). However, without including more paraffinic oils in the study, a definitive conclusion cannot be drawn in this regard.
Cured Film Observations
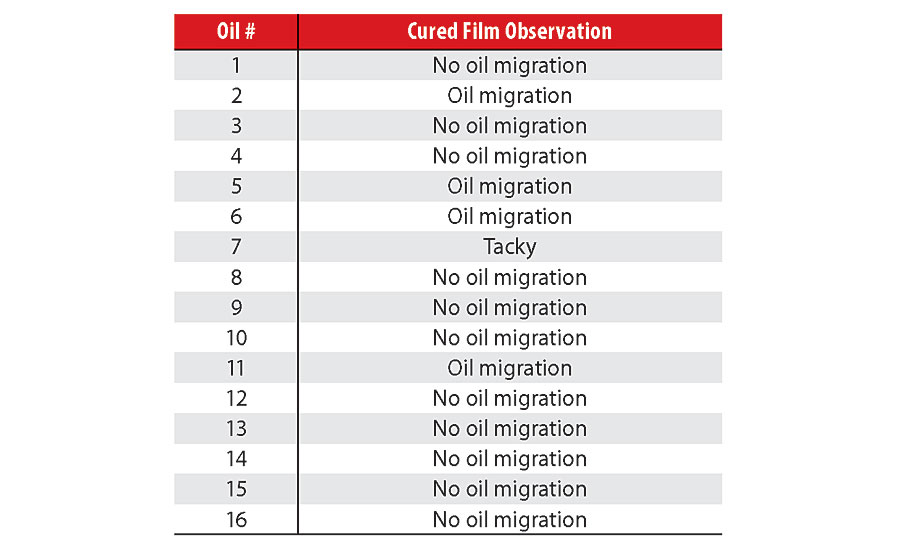
Upon preparing the various films for tensile testing, it was immediately apparent that the film from Coating 7 was unique as being the only one to remain tacky at the end of the cure period. Due to the hard settling observed in this coating (over 40% of the A-component), its blend with the isocyanate-functional B-component resulted in the A-component containing an excess of polymeric polyol and process oil. Consequently, the blend was under-indexed with respect to its NCO:OH ratio, which resulted in under cure, i.e., tacky films.
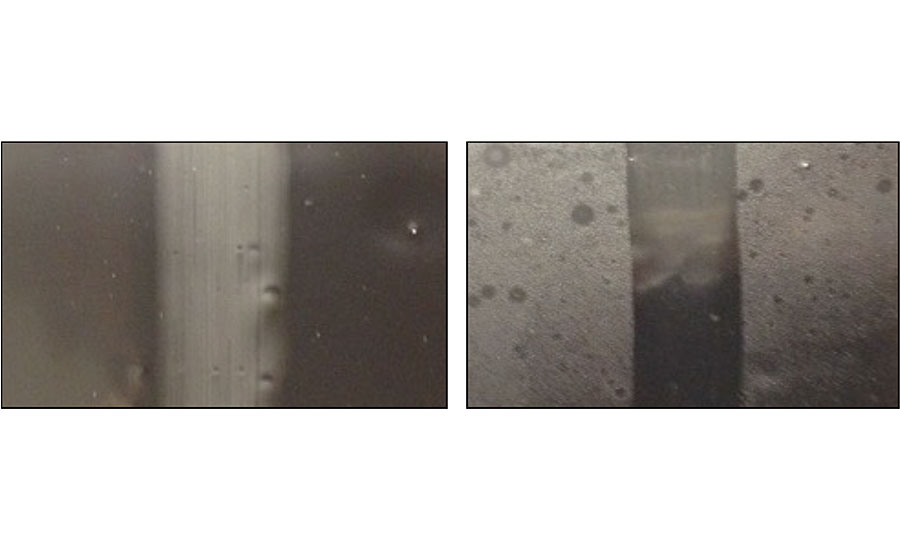
Oil migration was noted during cure in the films of four coatings; those with Oils 2, 5, 6 and 11. The variation in their viscosity (Oils 5 and 6 were low in viscosity, while Oils 2 and 11 were highly viscous) suggests that chemical characteristics also needed to be considered to understand the migration phenomenon. This will be covered in a subsequent section. Table 2 summarizes the cured film observations. Figure 1 demonstrates the differences in oil migration in coating films made with oils of different properties, namely Oils 1 and 2.
Tensile Testing
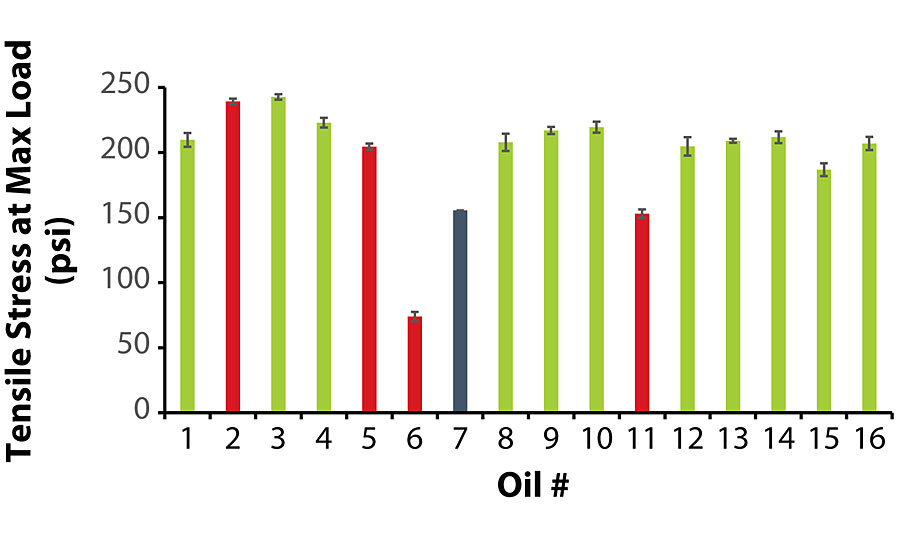
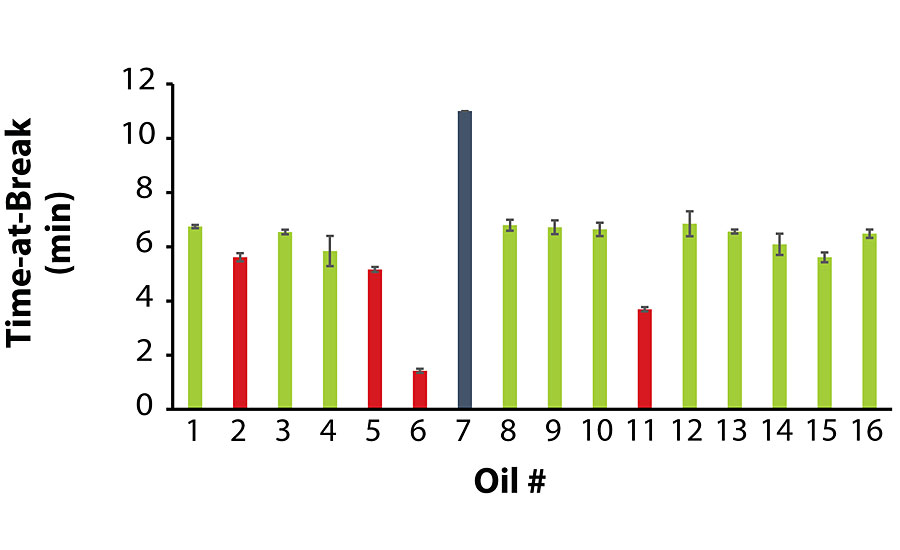
As stated earlier, due to the extremely low viscosity of Oil 7, its A-component exhibited severe pigment/filler settling, and its film remained tacky unlike the other coatings. The tensile strength testing on this film had to be terminated after 10 min without the film breaking.
Of the coatings that did not exhibit oil migration, the average values for tensile stress and time-at-break were at least 185 psi and 5.6 min, respectively. Interestingly enough, among the coatings that did exhibit oil migration, Coatings 2 and 5 exhibited satisfactory tensile properties, while Coatings 6 and 11 were noticeably inferior. Similar to the previous section, there was no correlation between oil viscosity and tensile strength, as Oils 2 and 11 were higher in viscosity while Oils 5 and 6 were lower in viscosity. Figure 2 and Figure 3 summarize the tensile testing results (the raw data is contained in the Appendix).
The Relationship Between Aniline Point and Cloud Point
The aniline point of an oil is the minimum equilibrium solution temperature of a blend containing equal volumes of aniline and oil, as defined in ASTM D 611. 3 As aniline is a primary aromatic amine, an oil containing more aromaticity compared to an oil where all other parameters are equal would exhibit a lower aniline point. The naphthenic process oil industry lists the aniline point value of every oil on a certificate of analysis and/or product data sheet. While this test is one of the standards in the oil industry, it does not provide meaningful information to the coatings formulator. A test that is conceptionally similar to the aniline point test but is tailored to the requirements of a coating formulation would be more useful to a formulator. For instance, in a formulation involving an aliphatic urethane instead of a model aromatic urethane, an oil with less aromaticity (higher aniline point) could be more beneficial.
The lithographic ink varnish industry commonly uses a Chemotronic Cool instrument for measuring the cloud point (ASTM D 6038) of a varnish in a particular ink oil. The cloud point is the temperature at which hitherto dissolved solids are no longer completely soluble and precipitate as a second phase, thus providing a cloudy appearance. 4 While A-components containing Oils 2 and 11 were stable during storage, it was not until the A- and B-components were combined and cured into a film that incompatibility, manifesting as oil migration, was observed between the process oil and the B-component. Following this observation, the idea to measure cloud point of the oil/B-component blend was conceived.
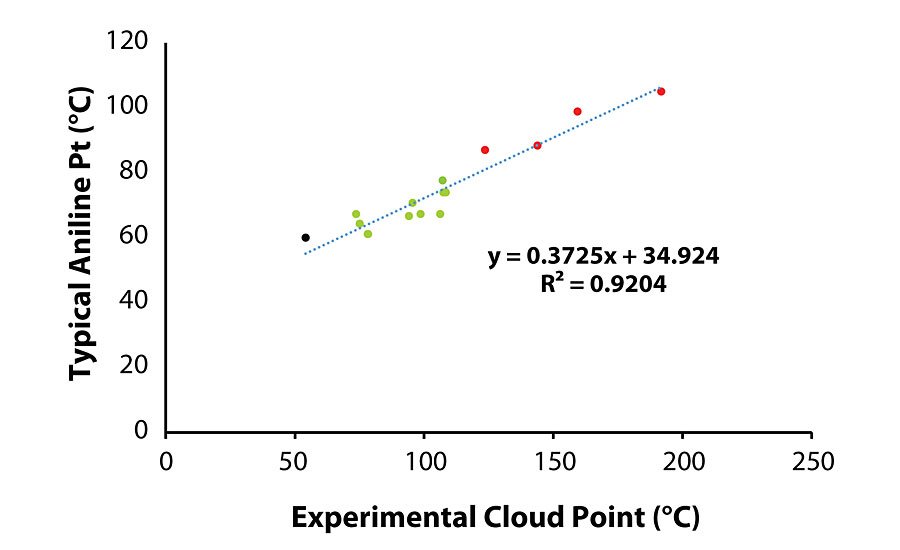
A subtle but important distinction between the aniline and cloud point test results is that the aniline point is a measure of solubility of the test material in aniline, while the cloud point result indicates the miscibility of the two materials. Therefore, the cloud point test is more relevant to the coating system, especially in the case of a two-component system. Figure 4 demonstrates the correlation between the aniline point (reported by the vendor) and the measured cloud point value of various oils in the blend, and clearly shows that when the oil tested results in a cloud point greater than 108 °C, oil migration is observed.
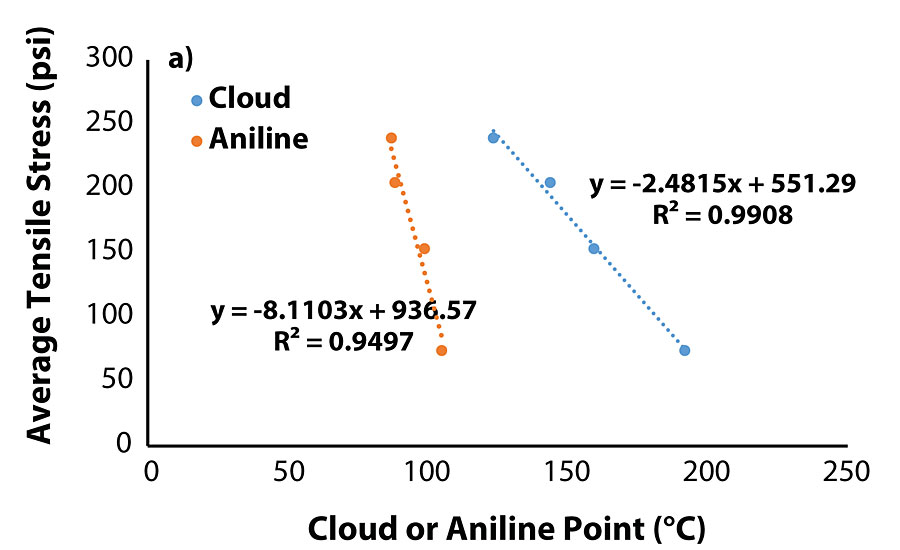
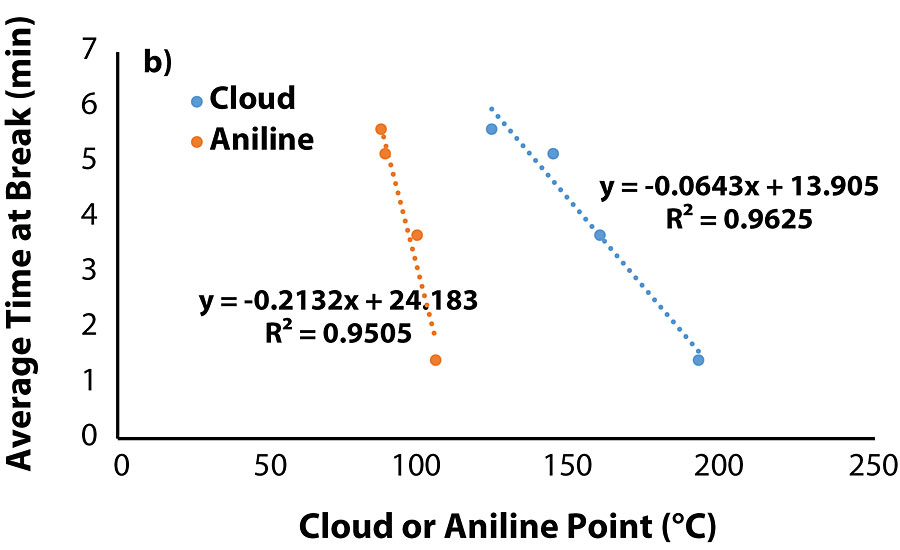
The correlation between cloud point of the blend and aniline point of the oil warranted evaluation of the tensile testing data with the properties of the migrated oils. Plots of tensile properties versus aniline/cloud point (Figure 5a and Fig. 5b) show that both tensile stress and time-at-break are closely correlated to an oil’s aniline/cloud point once the value is sufficiently high.
1H NMR Spectroscopy
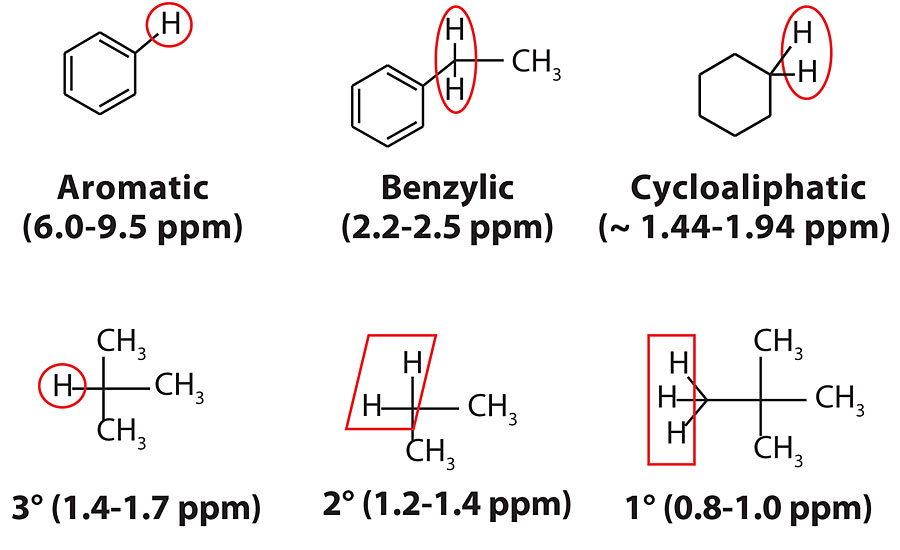
Up to this point, the physical characteristics of the process oils and their influence on coating performance have been investigated, but not their chemical characteristics. While the process oil industry utilizes aniline point to determine relative aromatic content, 1H NMR analysis is a measurement technique that is more common to the polymer/coatings industry for evaluating materials. In this section, 1H NMR spectroscopy was used to determine the percentage of aromatic and benzylic protons. The typical protons found in process oils are shown in Figure 6.
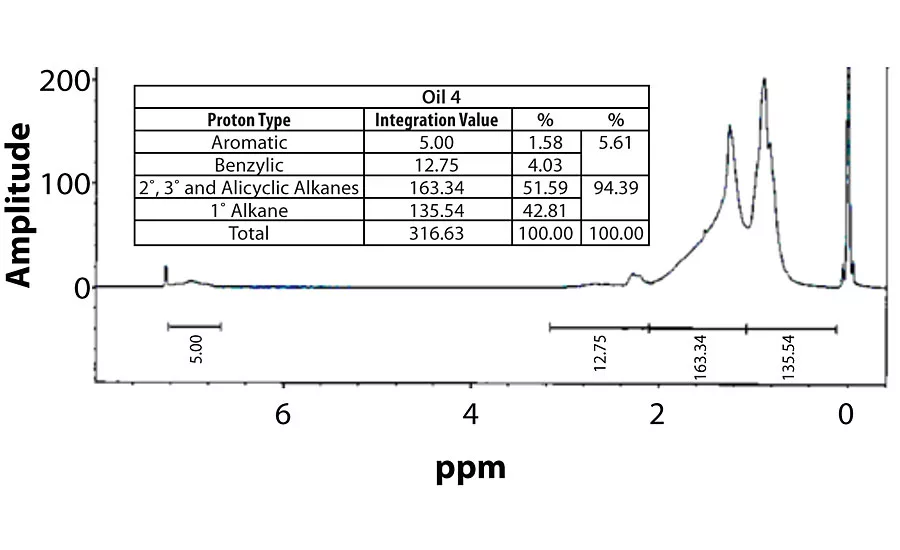
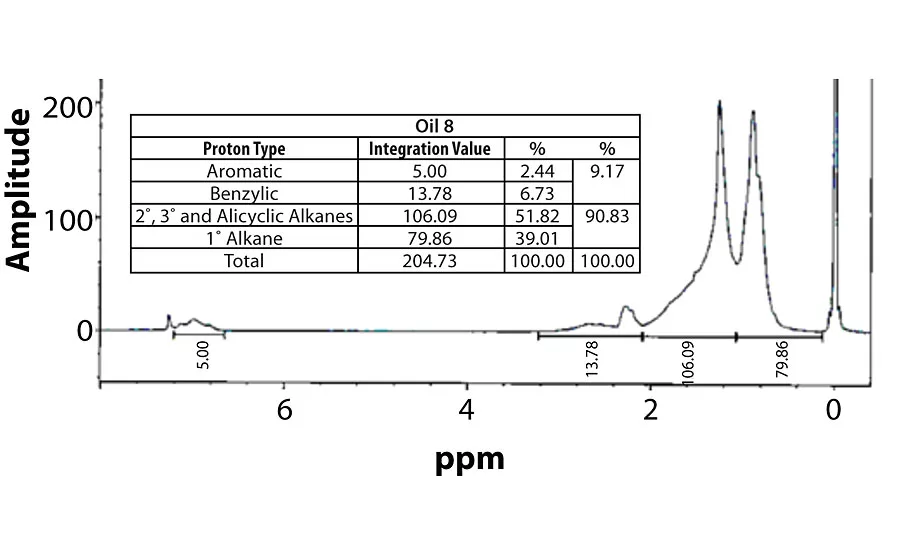
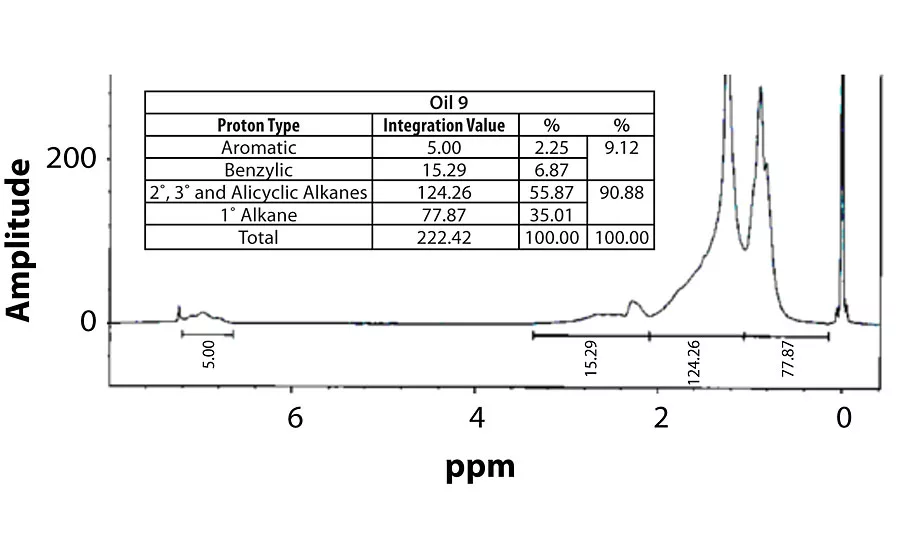
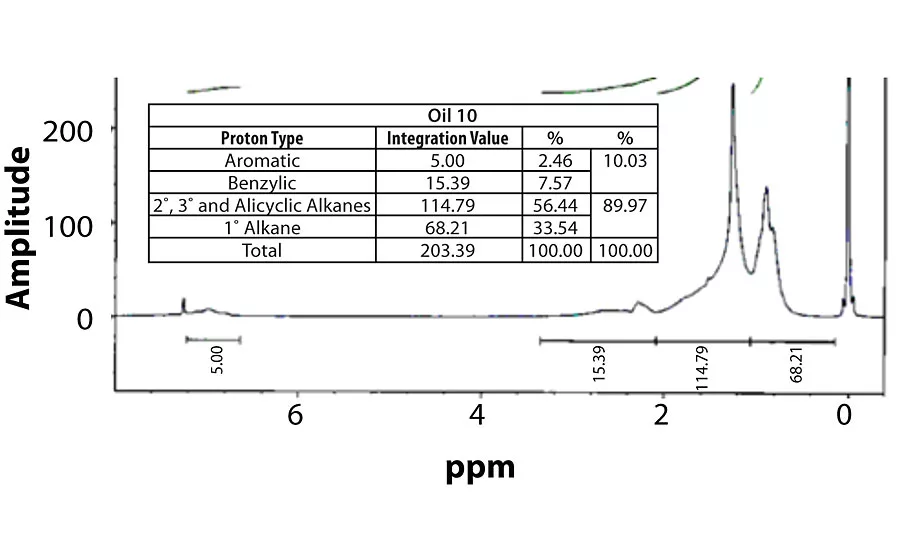
For perspective, the spectra of Oil 1 (relatively high aromatic content) and Oil 6 (lowest aromatic content) are shown in Figure 7 and Figure 8. Within each fig., the integration values and its conversion to percentages are shown.
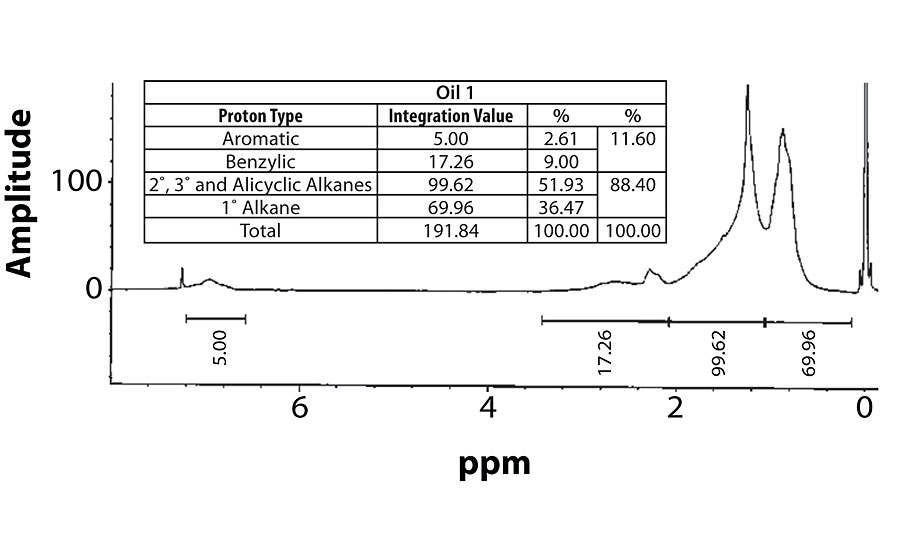
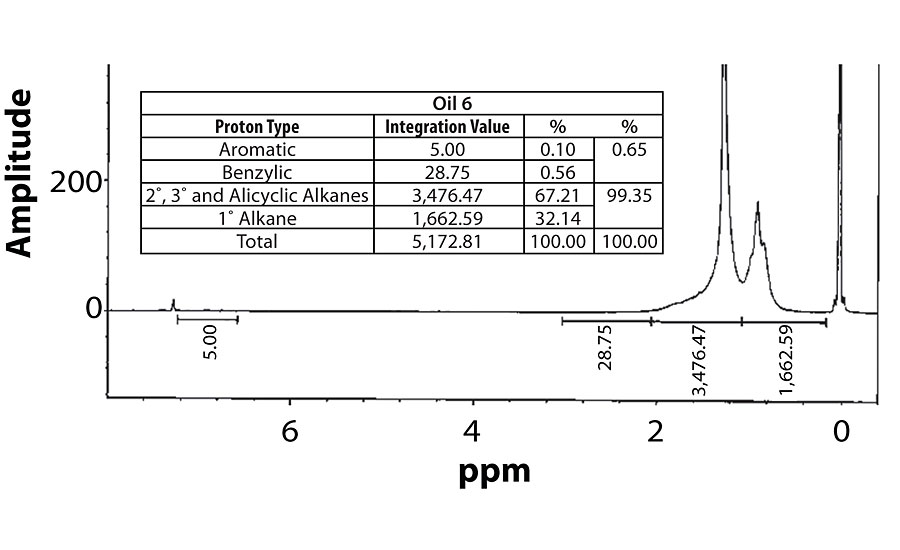
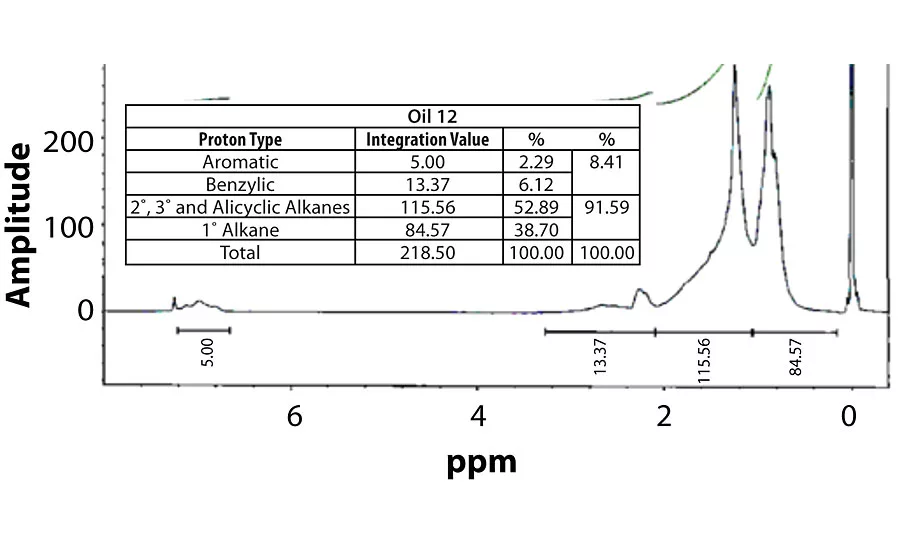
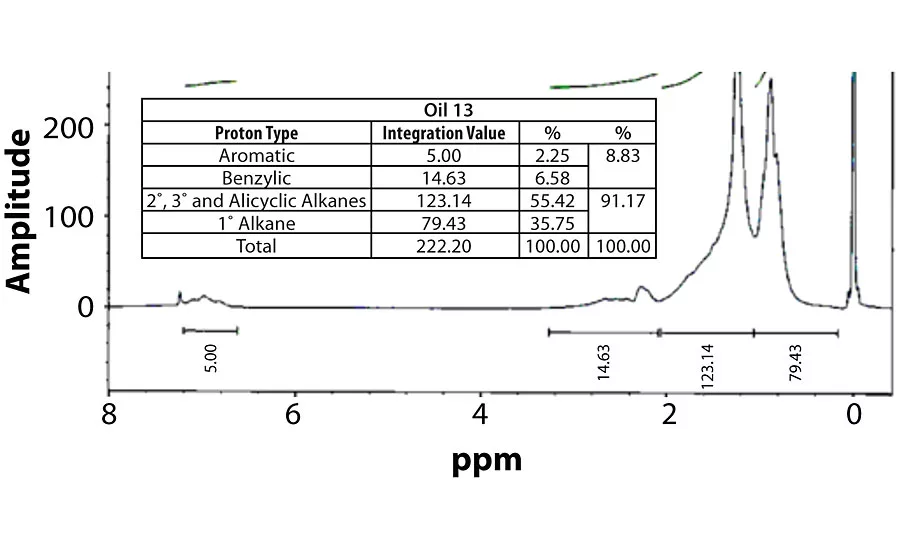
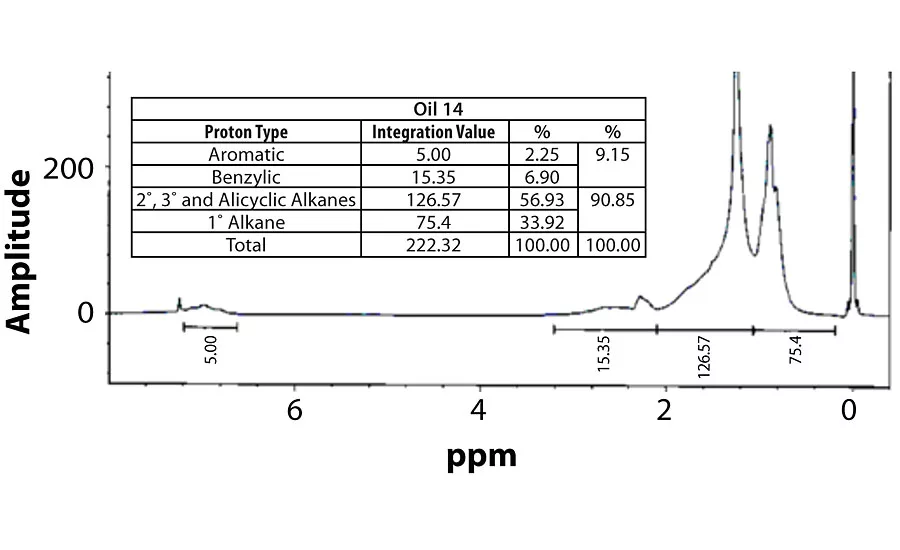
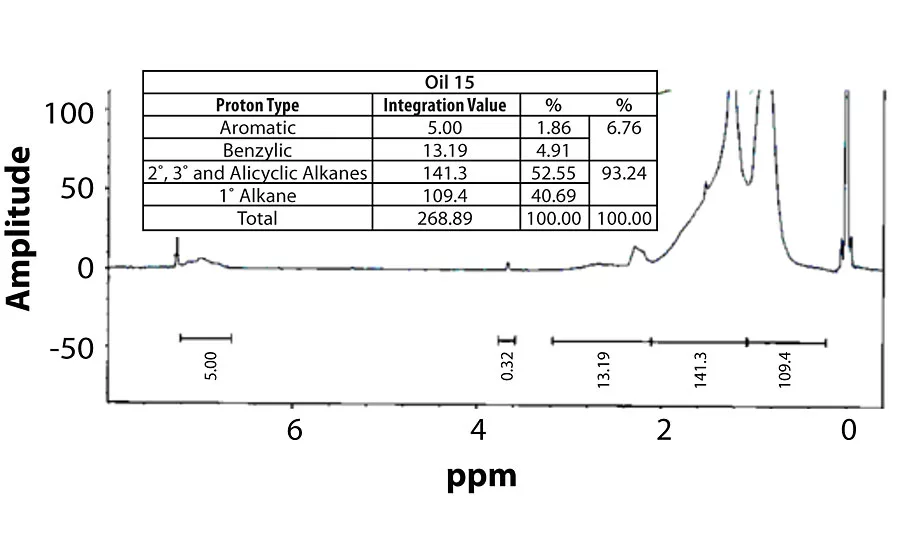
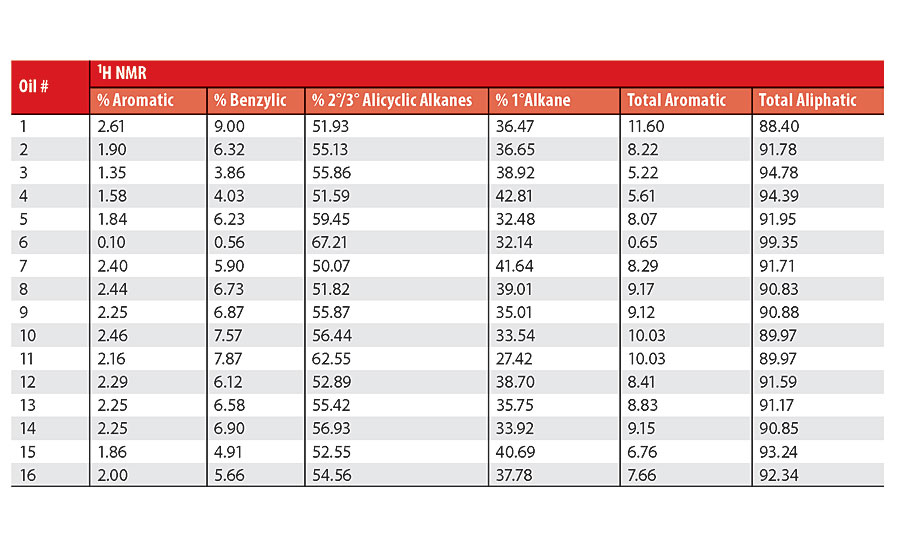
Table 3 contains a summary of the 1H NMR results for each of the 16 oils, while the Appendix contains the remaining spectra. Oil 6, being the only paraffinic oil in the study, expectedly contained the lowest percentage of aromatic/benzylic protons. Conversely, Oil 1 contained the highest percentage of total aromatic protons, most notably nearly 1.15% higher benzylic protons than the nearest oil (Oil 11).
Determining Aniline and Cloud Point
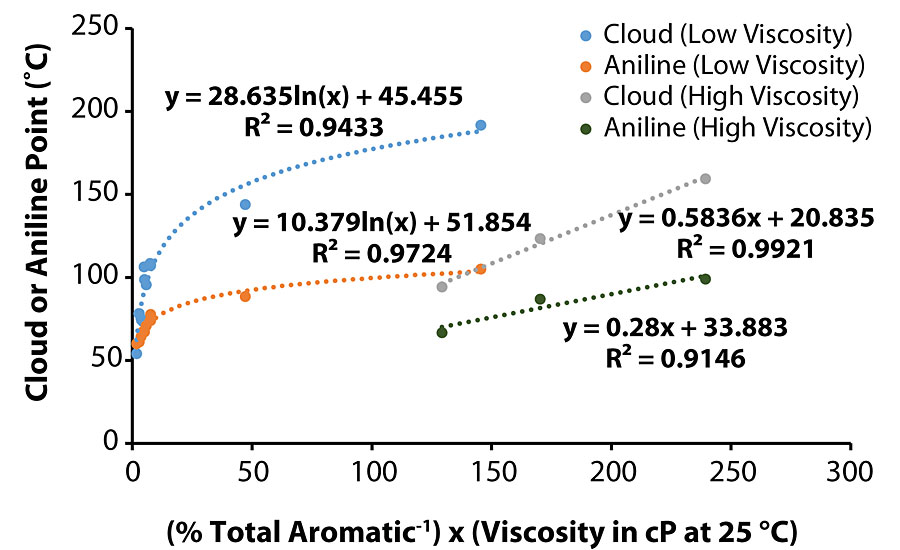
Throughout the course of this work, the majority of the trends identified to explain various coatings characteristics were plausible, such as higher viscosity oils exhibiting correspondingly high aniline/cloud point values, i.e., Oil 11. However, Oil 6 had the highest aniline/cloud point values but only the fifth highest viscosity. This exception suggests that this model does not capture all the detail. One hypothesis is that there may be a correlation between aniline/cloud point values and viscosity/1H NMR results. When separating the oils into two viscosity groups, i.e., less than and greater than 1,000 cP, the reciprocal of total aromatic proton percentage multiplied by the viscosity at 25 °C generated a satisfactory function to predict aniline/cloud point. As shown in Figure 9, a better correlation was developed for aniline point (of the oil) in the lower viscosity oil graph (R2 > 0.97), while the correlation was more favorable for cloud point (of the oil/B-component blend) in the higher viscosity oil graph (R2 > 0.99).
Intercoat Adhesion
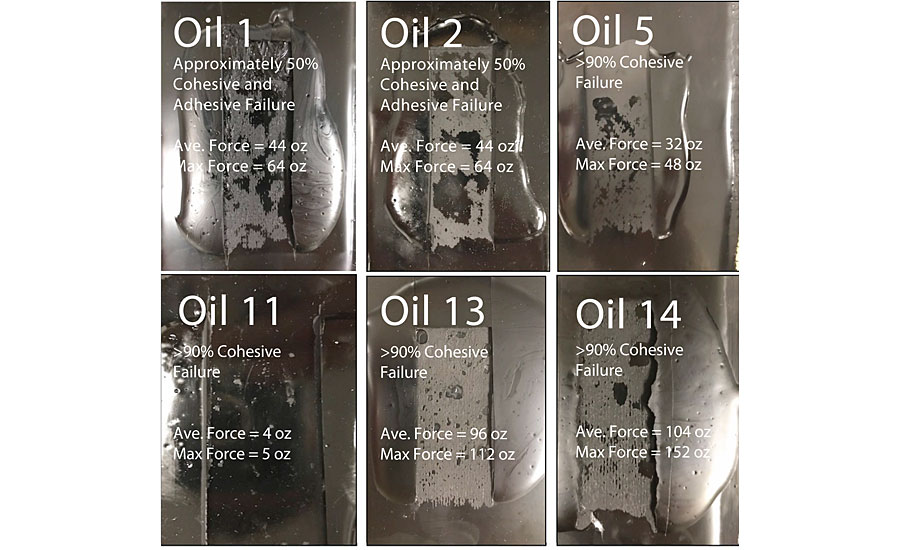
Adhesion testing was conducted on the three coatings containing the highest viscosity oils (Oils 1, 2 and 11) and three coatings containing process oils with lower viscosities and a wide range of aniline/cloud points (Oils 5, 13 and 14). Figure 10 indicates a strong correlation between viscosity and type of coating failure. Coating 11 (highest viscosity) exhibited over 90% adhesive failure, while Coatings 1 and 2 (intermediate viscosity) exhibited approximately 50% cohesive/ adhesive failure. The three lowest viscosity coatings (regardless of oil aniline/cloud point) exhibited nearly 100% cohesive failure.
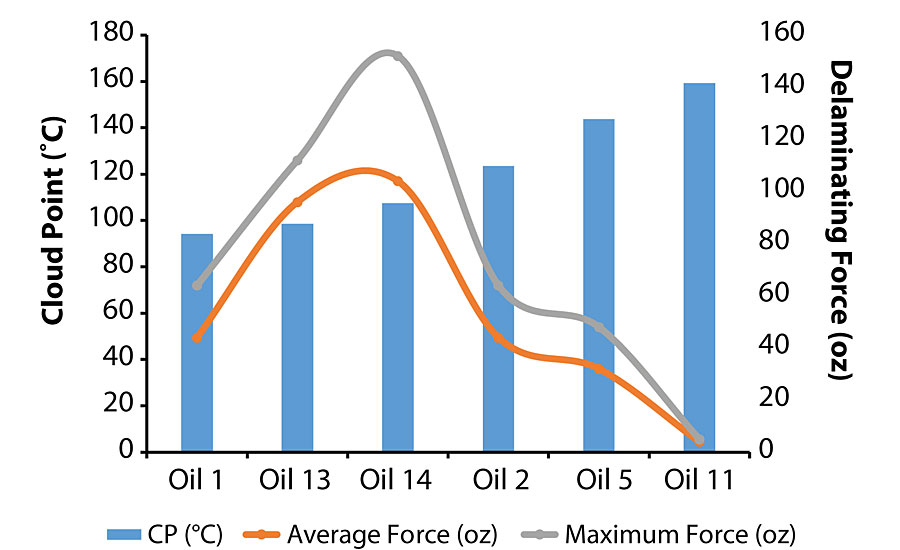
It appears that aniline/cloud point does not play a role in the failure mode. One suggested mechanism to explain this observation is that the lower viscosity oils promoted better surface wetting regardless of their chemical characteristics. Conversely, the force necessary to delaminate the second coat from the initial coat was determined by both viscosity and chemical characteristics, i.e. aniline/cloud point. As shown in Figure 11, the delaminating force followed a bell-shaped curve as a function of cloud point where 107-108 °C (74 °C for aniline point) was the optimum value for achieving the best adhesion characteristics.
Conclusions
Oil viscosity and relative aromatic content are the cornerstones to predict the impact of process oils on urethane coating performance. Pigment/filler settling is strongly dependent on the viscosity of the process oil and will occur during storage. Adhesion failure mode was most influenced by the oil viscosity. Oil viscosity, combined with the percentage of aromatic protons (measured via 1H NMR), were instrumental in predicting the cloud point for the oil/B-component blend. Cloud point was also found to correlate very well to an oil’s aniline point. The oil aniline/cloud points were used to identify which oils would migrate from their respective cured film, as well as to better understand coating tensile properties and delaminating force.
Acknowledgements
The author is indebted to Riken Patel for his assistance with intercoat adhesion testing, as well as Jon King of Chemical Research/Technology for conducting the cloud point testing.
References
1 https://ergonnsa.com/products/hyprene, accessed Nov 2019.
2 Appendix E ̶ API Base Oil Interchangeability Guidelines for Passenger Car Motor Oils and Diesel Engine Oils; https://www.api.org/certification-programs/engine-oil-diesel-exhaustfluid/~/media/files/%20certification/engine-oil-diesel/publications/appendix-e-rev-09-01-11.ashx.
3 Standard Test Methods for Aniline Point and Mixed Aniline Point of Petroleum Products and Hydrocarbon Solvents, ASTM D 611-04.
4 Standard Test Methods of Determining the Compatibility of Resin/Solvent Mixtures by Precipitation Temperature (Cloud Point), ASTM D 6038-14.
5 Solomons, T.W.G. Fundamentals of Organic Chemistry, 5th edition, John Wiley & Sons, Inc., New York, 1997, 541.
6 Pretsch, E.; Bühlmann, P.; Affolter, C. Structure Determination of Organic Compounds, Tables of Spectral Data, 3rd edition, Springer, Berlin, 2000, 176.
This paper was presented at the 2020 Waterborne Symposium in New Orleans. For more information, email cmolaison@gaco.com.
Appendix
Tensile Testing Raw Data
Remaining 1 H NMR Spectra
Looking for a reprint of this article?
From high-res PDFs to custom plaques, order your copy today!


