The Impact of Different Intensities on the Performance of LED-Cured Coatings

UV-LED technology provides a number of great advantages, such as energy savings, long lifetime, low heat, no ozone and no mercury. With LED technology, we rely on thousands of small LEDs to sufficiently cure a coating. What if there is a deviation along the width of the lamp? If a segment goes out, if some of the optics get damaged or dirty, how does this impact the curing, and the final coating properties?
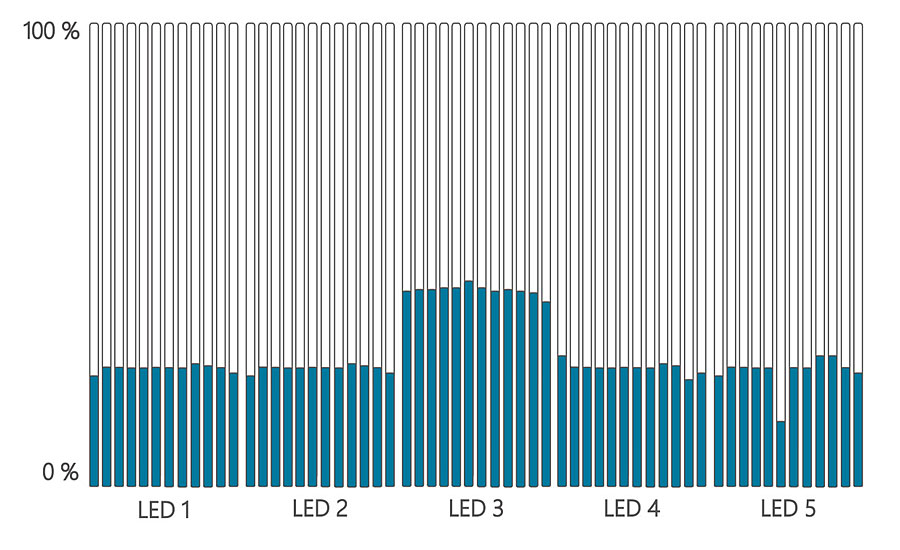
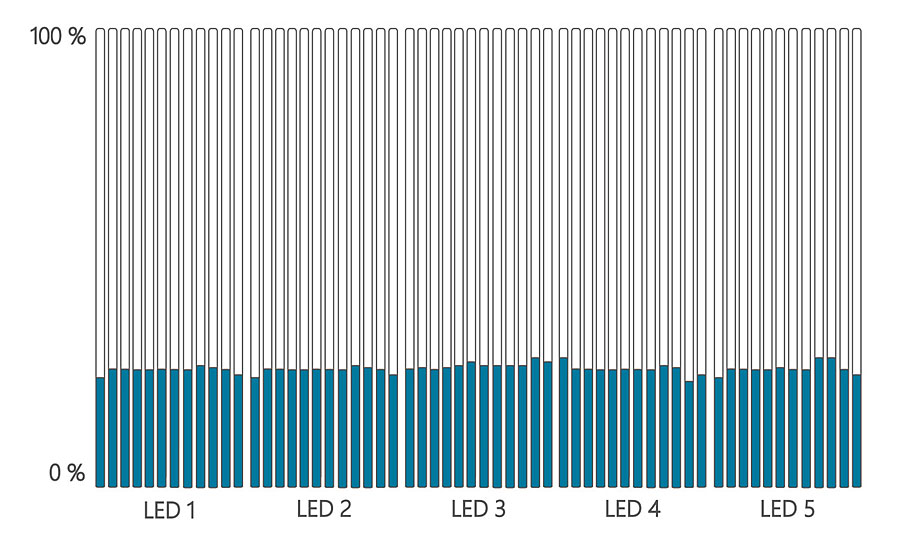
This study aims to determine what level of deviation causes problems with insufficient cure. To prevent problems with insufficient cure, EFSEN has developed a proprietary technology called ICAD® to continuously monitor the output of a UV lamp during production. Not only does this show us the complete picture of the UV output along the width of the lamp, it is also able to use the extracted information to adjust the power level of any segments that do not conform to the specification (Figures 1 and 2). This will provide assurance, in real time, that all segments perform according to the specifications, and also lets users know directly when there is damage, dirt or other issues preventing a segment from performing to standard.
What is the Required Illumination to Sufficiently Cure the Reactive Material?
This is one of the most basic questions to ask with radiation curing processes. While this might seem like a simple question, it can actually be quite complicated in reality. And if our curing system is under dimensioned, or if the output has fallen due to damage, dirt, aging or lack of maintenance, then problems occur. The curing issue might result in lacking properties of the final product such as adhesion failure, and low scratch and chemical resistance. With some luck, the deviation can be discovered quickly to halt production and rework whichever pieces have been produced with insufficient cure.
However, if the problem is not identified there might be huge claims, as unfit products reach the consumer. Even worse are the cases were neither the producer nor the consumer realize that the product is unfit, as the performance seems to be acceptable. The consumer can then be exposed to residual monomers, initiators or other harmful components without even realizing it.
Setting and fulfilling curing requirements is key to preventing this and ensuring a safe, durable product for the consumer. There are many things to consider. Does the light source provide the optimal spectral distribution? Is the intensity high enough to ensure an efficient reaction? Is there enough dose for the cure speed required?
Transitioning to Industry 4.0 – Accurate Curing Requirements
In essence, Industry 4.0 is about optimizing production, using technology to eliminate errors and maximize flexibility. For UV curing, a transition into Industry 4.0 requires that we are able to set accurate curing requirements and that we have the right means to ensure that those requirements are fulfilled at all times. We have to establish an accurate process window and ensure we do not drift outside of this window.
How far we have come to monitoring and controlling UV systems differs from industry to industry. Implementing sensors or measuring procedures for frequent controls with radiometers are used in many processes. When it comes to conveyor-based production systems, it has become the industry standard to measure with a radiometer at the start of (or a few times during) each shift. If done correctly, this will help confirm that an arc or microwave UV lamp is performing as it should.
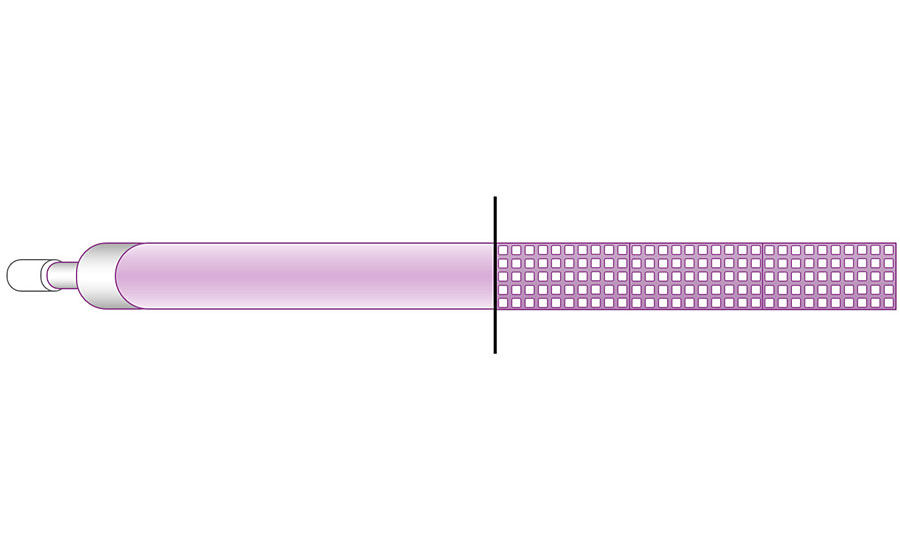
The emerging LED technology that is already proved and implemented to some extent works quite differently in comparison with conventional curing units. A conventional lamp typically uses one bulb to cover the whole line width, thus a measurement at one point of this lamp will give a good idea of how the lamp performs throughout the whole width, with a reduction towards the edges. This is not the case with an LED light source. An LED unit consists of several light sources, thus measuring in one spot will not give you the full picture of how the unit behaves (Figure 3).
The Choice of Wavelength
There have been LED units in commercial production for quite some time, despite the previous lack of sufficient cure control. This study aims to establish how critical cure control is to understand if there is an urgency for implementing control systems for LED lamps, or if catching the deviations in our light source is not critical. In order to find the answer, there are a couple of things to consider. An operating window must be established for our process, and we have to look into how changes along the LED lamp affect the output in each point along the width. To establish a process window, a test is set up to identify the breaking point – the minimum amount of light that cures the coating enough to reach the requirements.
Before proceeding to pinpoint the dose required, it is important to ensure we are using a light source with the optimal spectral output. For LEDs, this is basically selecting the optimal wavelength. The choice of wavelength is mainly governed by the following factors:
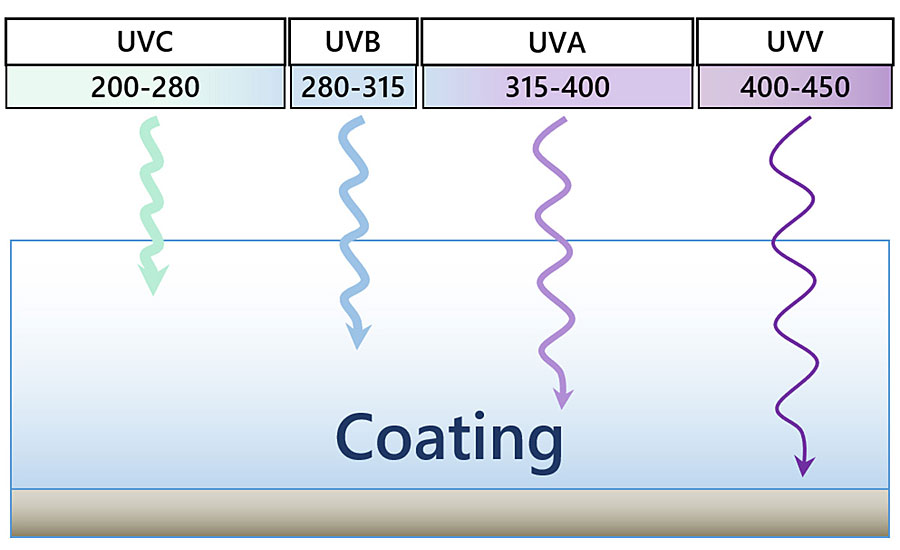
· Which wavelength offers the best match to the absorption of the initiators in the coating. · Which wavelength will have the best penetration properties (for deep curing applications) or the best way of overcoming oxygen inhibition (for surface curing applications) (Figure 4).
Then it is of course important to take into account what output and long-term performance we can expect from a system at the chosen wavelength.
LED systems at 365, 385, 395 and 405 nm are available at high output with decent price performance and life length. While lower-wavelength LEDs would be attractive to fill the surface curing role, they are not commercially feasible quite yet.
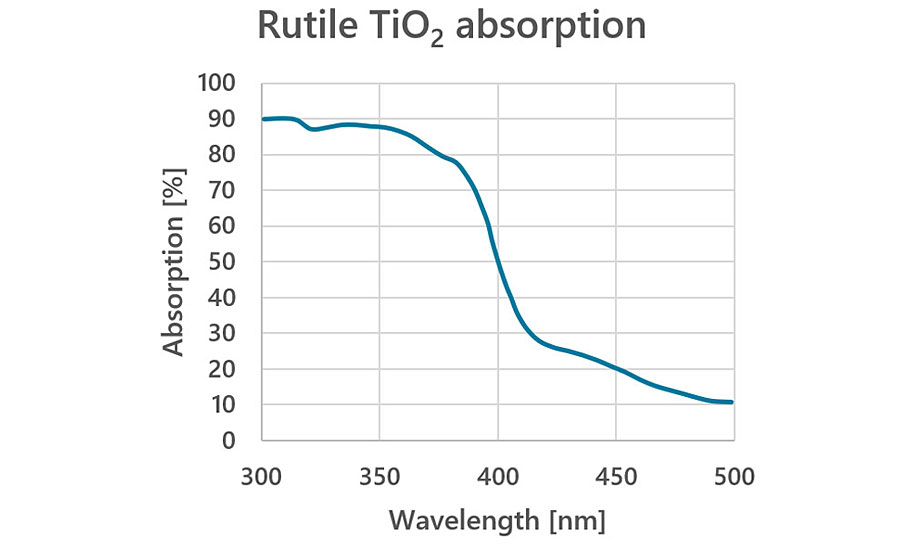
For this article, the LED curing of white base coats was selected as the process step to evaluate. This is a common product, produced in large quantities in the wood coatings market. When evaluating a base coat, the primary focus is the deep curing, as surface curing is generally not required. The longer wavelengths will excel; thus 395 or 405 nm should be selected. Looking at the absorption of Irgacure 819, a common initiator for pigmented coatings, the 395 nm LED is a slightly better match than 405 nm.
However, when taking into account the harsh absorption of titanium dioxide, 405 nm becomes the most attractive choice, as seen in Figure 5.
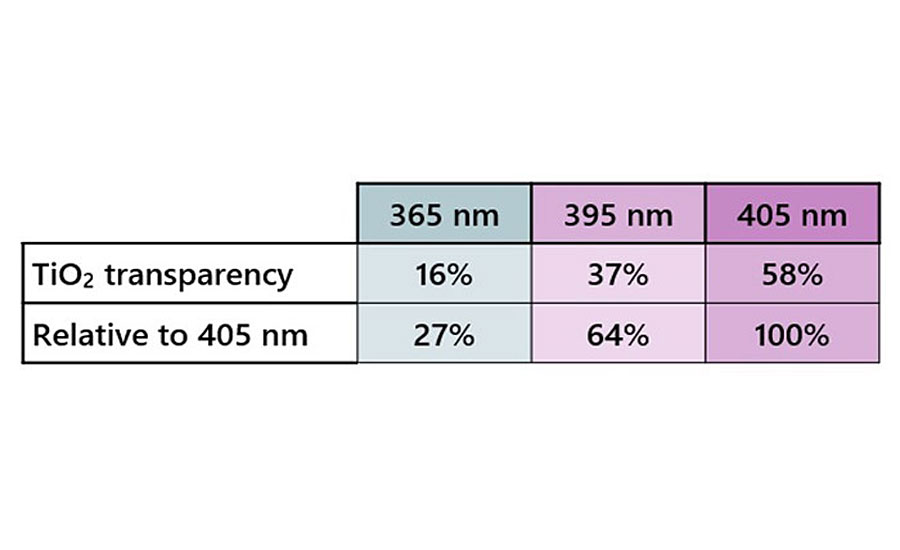
Due to the fact that the transparency changes drastically with a wavelength shift of only 10 nm, it could be useful to know the actual peak wavelength of the chosen light source. The peak wavelength of an LED is generally +/- 5 nm, which essentially means that a 405 nm unit could really be close to 400 nm in the case of low-bin diodes, or close to 410 nm in the case of high-bin diodes. The impact of this wavelength shift is complicated to establish, as it depends on many different factors that are different for different applications. It might very well be of significance.
Test Setup and Execution – Dose and Peak Requirements
With the wavelength specified, the dose and peak requirements can be established. The evaluation performed for this article looked at a varying output at constant speed. The focus was on the dose as the main limiting factor, as LED units provide a high intensity (1,000+ mJ/cm² L405 in a narrow wavelength band, a factor much higher than arc lamps would provide).
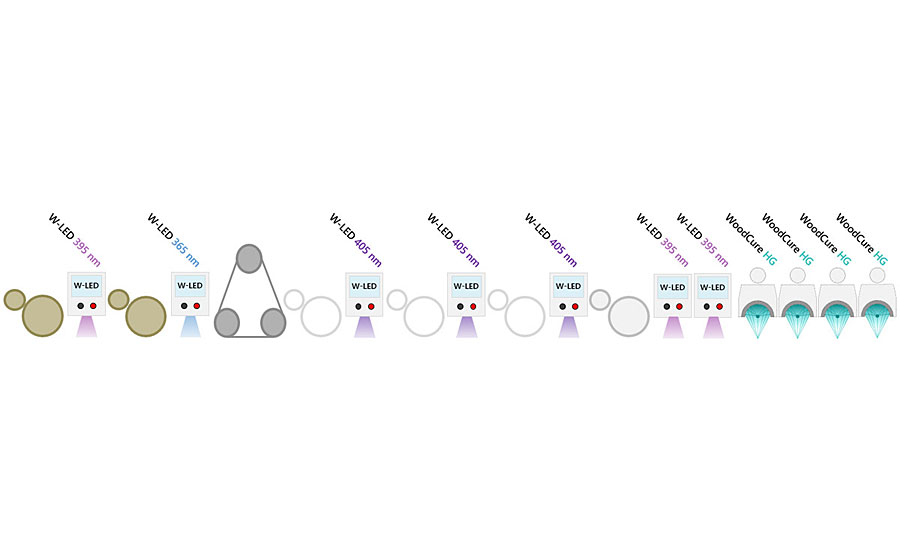
A commercial LED curing base coat was selected for evaluation. The conditions of a factory running this product were replicated, but with varied LED power level (Figure 6). The purpose was to learn which level of deviation would be acceptable and to identify the breaking point at which the curing was insufficient. The product of choice was an intermediate coating, a base coat, which is applied after sealing of the surface.
The main purpose of this base coat is to build up the opacity and color of wood furniture. It is typically applied in three layers, each at about 10-micron film weight, and featuring a high pigment load, about 40% titanium dioxide. In case of insufficient curing, the deep curing will suffer, causing adhesion failure. The selected test methods to evaluate the adhesion was tape, crosscut + tape and finally Hamberger Hobel. Hamberger Hobel is a refined version of the classic coin-test, where the coin is replaced with a cutting head that is pushed down to the surface with a constant pressure. A decent result with a Hamberger Hobel is to withstand at the very least 10 Nm of pressure; the highest IKEA standard requires 20 N (this is only for certain premium surfaces).
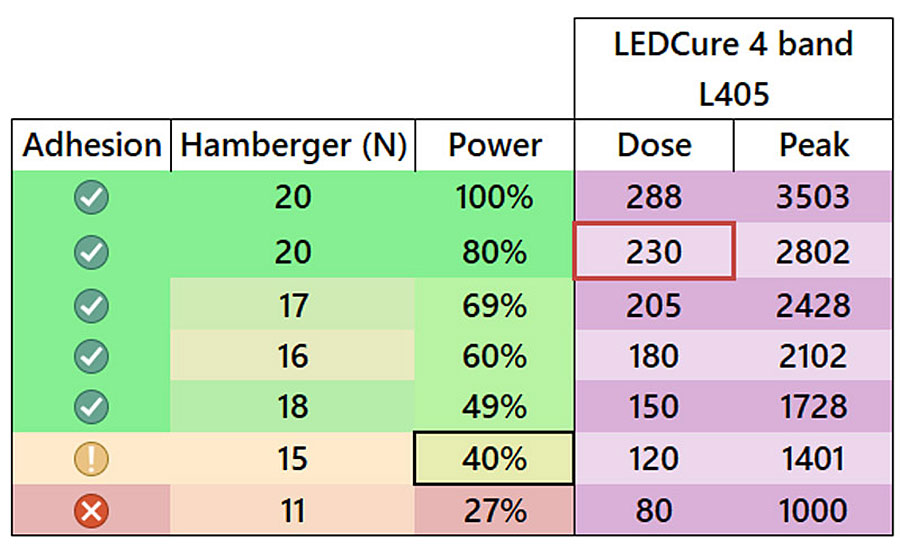
The first thing evaluated was with the same level of curing on all three basecoat layers. The dose indicated by the coating supplier was selected as starting point, progressively reducing the dose until adhesion failed. A dose level higher than the indicated curing requirement was also evaluated to see if there would be a benefit with an even higher dose. Surprisingly, it was observed that the adhesion was still acceptable when the dose was reduced to 50% of the curing specification. Curing with a higher dose than specified provided no advantage (Figure 7).
The Importance of Monitoring the Full Width of an LED Array
It could be argued that the coating supplier selected a far too high dose specification. However, there are many LED systems today running without control systems thoroughly implemented, making it reasonable to include a substantial safety margin in order to ensure sufficient curing even if the LED array would suffer from malfunctioning segments, or damaged/dirty lenses. This reasoning does result in a significantly higher energy consumption (100% higher than required in this particular case). Furthermore, running LEDs at high output has a significant impact on the lifetime.
Another interesting question is to what degree neighboring LED segments contribute to the curing, whether they can compensate for blocked or inactive LED segments. This is done by measuring the output level along an LED head with inactive or underperforming segments (Figure 8).
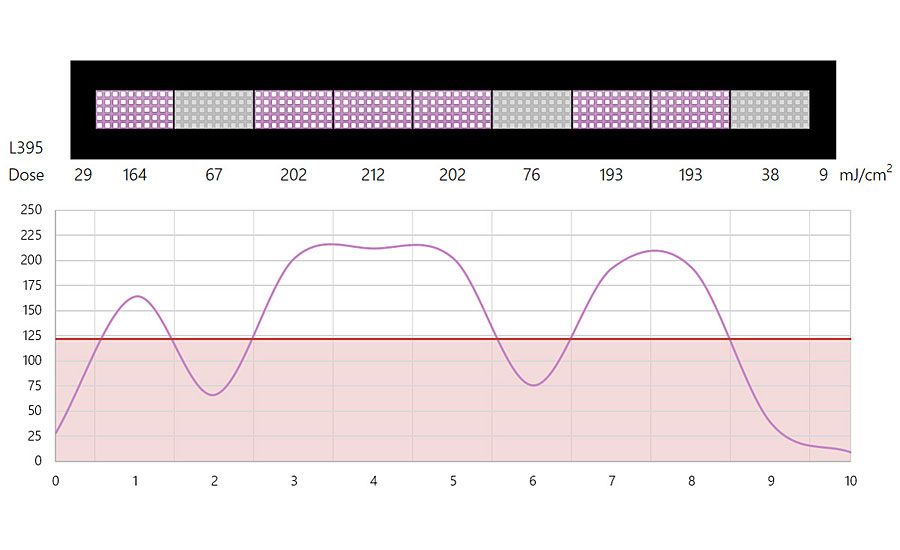
It is clear to see that neighboring LEDs do contribute, but even for an LED array with a lot of margin, neighboring LEDs struggle to keep the curing on the edge of the operating window. In reality, this deviation would surely result in adhesion failure in the case mentioned previously in this article where base coat cure requirements were evaluated. This speaks to the importance of monitoring the full width of an LED array in order to maintain the cure required for desired coating performance. Continuous monitoring would also open up for reducing the cure requirement, as any LED deviation would be identified immediately.
To successfully measure each segment of an LED array manually with radiometers would require a measurement every 2-5 cm, depending on the accuracy desired. In the applications discussed in this article, this would translate to roughly 50 measurements per array for high accuracy, or at least 20 measurements to be able to catch deviations. In addition to this, documenting and checking the data would also be required. Such a procedure would be far too time consuming to perform manually on a regular basis.
Inline Continuous Automated Dynamic UV Monitoring
EFSEN has developed ICAD, a proprietary in-line sensor that travels under the LED array during production to continuously monitor each LED segment (Figure 9).
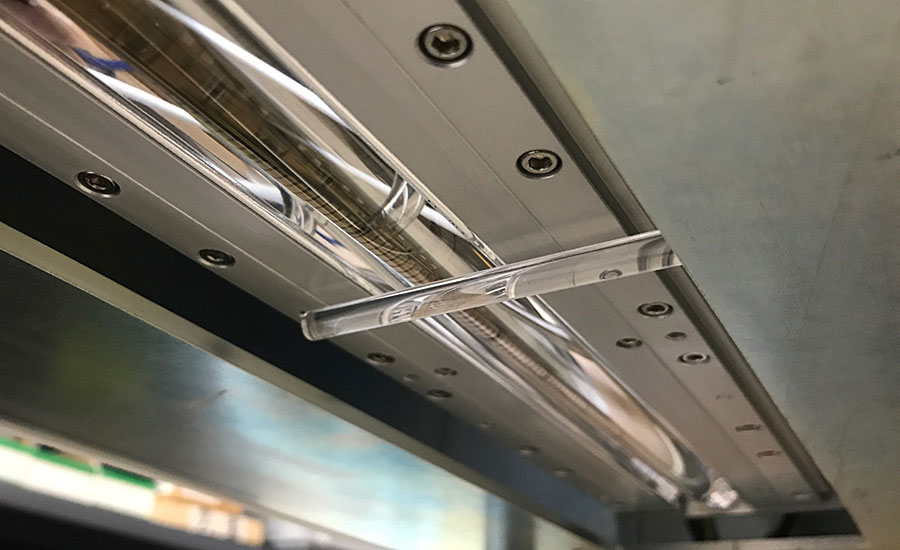
This also allows for collecting curing history for efficient documentation of cure data. Any deviations are automatically detected and adjusted to the right level where possible. Alarms or automatic line stops can be set to trigger whenever the minimum output level cannot be reached.
For more information, email david@efsen.dk.
All photos and illustrations are made by EFSEN.
Looking for a reprint of this article?
From high-res PDFs to custom plaques, order your copy today!


