Developing a Multi-Functional Water-Based Matting Agent

For the last few years, the do-it-yourself (DIY) market for home improvement materials has grown rapidly, accelerated by the COVID-19 pandemic. At the same time, the use of low-gloss matte paint has become popular with consumers. The end-use customer desires a robust paint that is easy to apply and maintain.
The low gloss levels in a matte paint are typically achieved using powders such as fumed silica or calcium carbonate, which require dust mitigation equipment and PPE for workers handling these materials. Furthermore, matte finishes are prone to burnishing, and interior paints require scratch and stain resistance. Currently, the industry uses various additives to attain the required performance. This article discusses how one water-based additive can provide low-gloss matte paint with the needed performance properties without dust mitigation or worker PPE.
Background
Michelman's goal was to create a VOC- and APEO-free, multi-functional water-based matting agent that can provide superior performance in interior architectural paints, with a focus on matte finish paint because of its increased popularity in the market. Our research into current matte paint formulations revealed that various powders, silicones and multiple latexes were incorporated to achieve the desired properties. Based on this research, we identified a potential need for a water-based additive that can be stored and added easily (thereby reducing dust collection systems) into a paint formulation while still giving the end-use customer the desired properties.
We began our development work by identifying a starting point formulation (SPF) that could be used to test for industry-required performance properties. This formulation was used as a control and to evaluate candidate materials by replacing the original ingredients used for matting and performance with experimental additives.
We chose Dow Rhoplex™ VSR-1050 as the SPF in a matte formulation because it provided high-end performance and was comparable to the high-end matte paints in today's marketplace. For comparison, we added three high-end matte paints designed for scuff and scratch resistance to the project scope.
We evaluated the sample's performance by testing the following:
- Gloss reduction
- Scrub resistance
- Burnish resistance
- Stain resistance
- Touch-up
- Blocking
- Recoatability
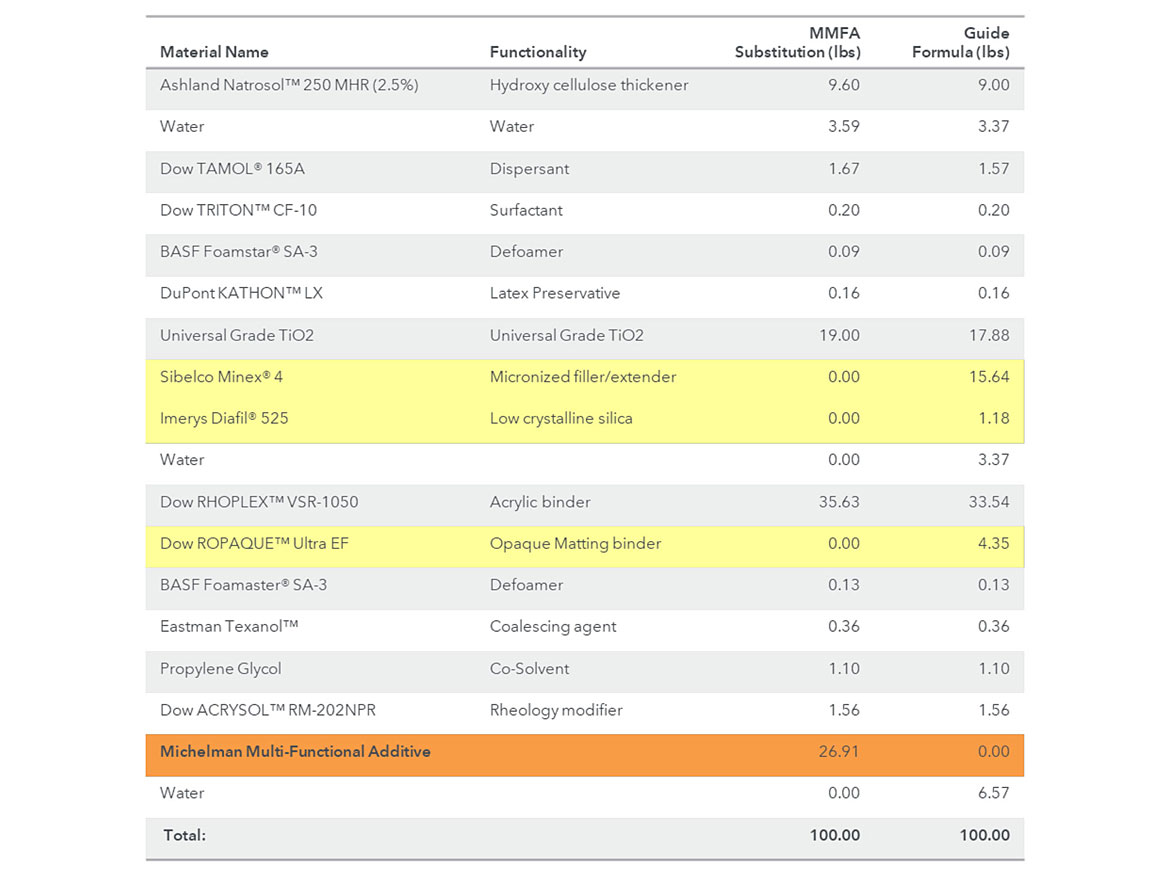
The Test Material was added to the SPF at 22% of solids level (which is a 1-to-1 comparison of the original SPF formulation) and at 15% of solids level to evaluate against the three commercial high-performance paints and the Control. Table 1 shows the SPF neat vs. the SPF with 22% of the solids replaced with our Test Material.
Testing Results
The first test performed was gloss reduction (ASTM D523). The samples were drawn down to a 3-mil thickness on Leneta 3B charts, placed on a horizontal surface and left undisturbed to cure for five days. After curing, the initial gloss of the samples was evaluated at 60 and 85 degrees using a BYK Micro Tri-Gloss Meter. Figure 1 shows that the Test Material had similar performance to the Control and the commercial paints. Each sample was tested in triplicate.

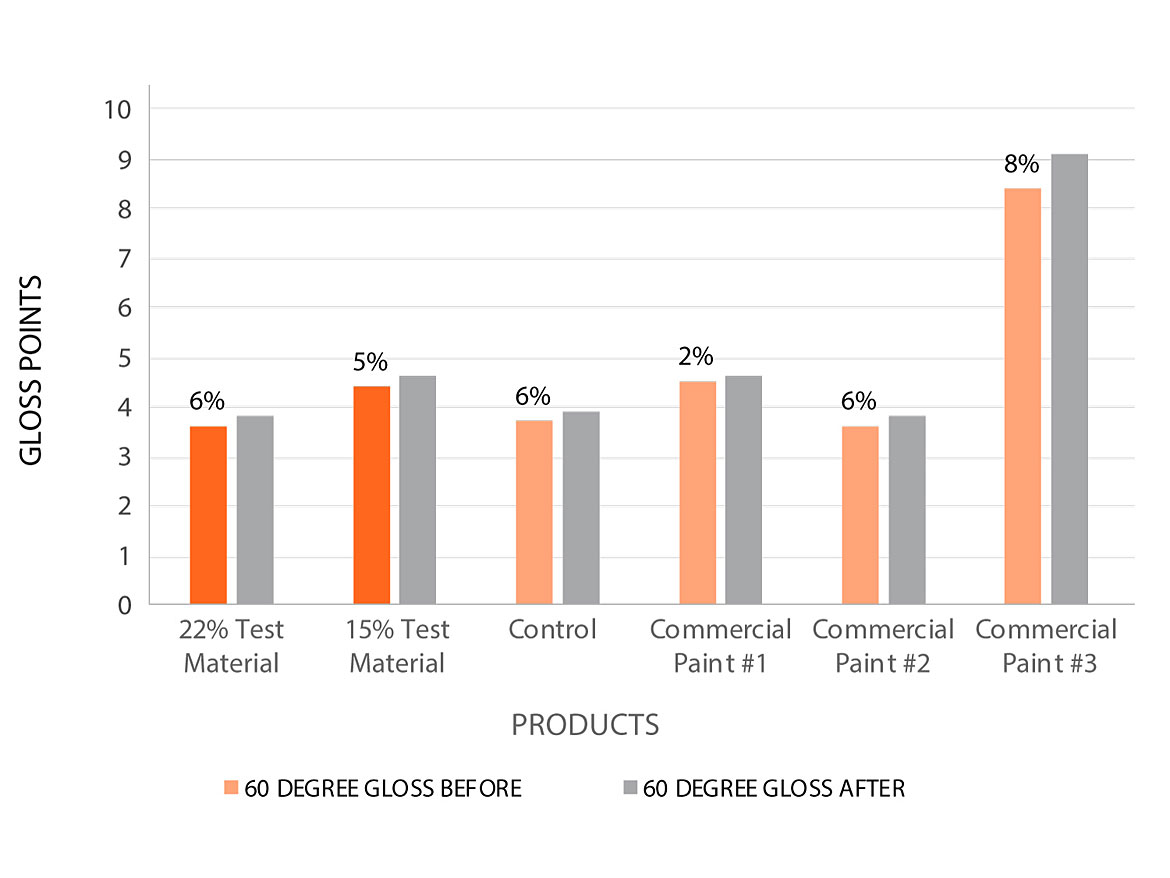
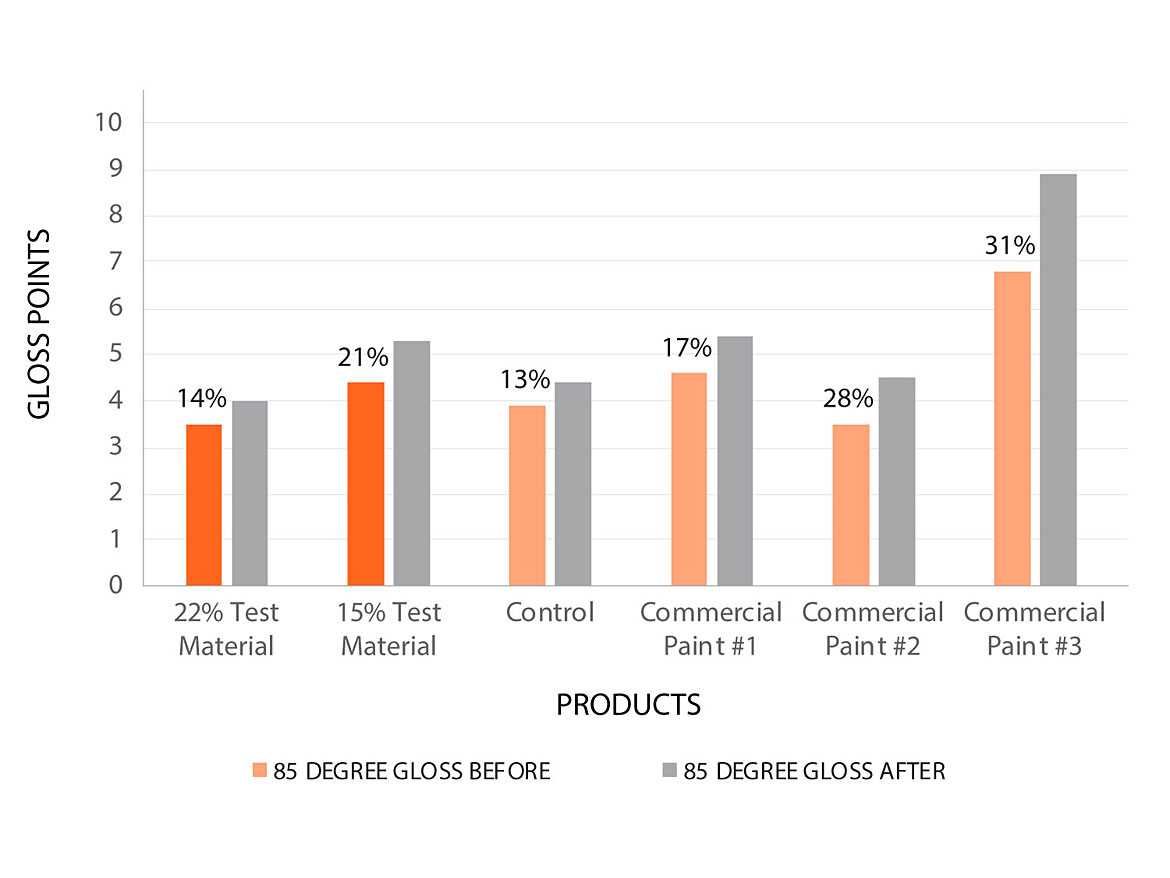
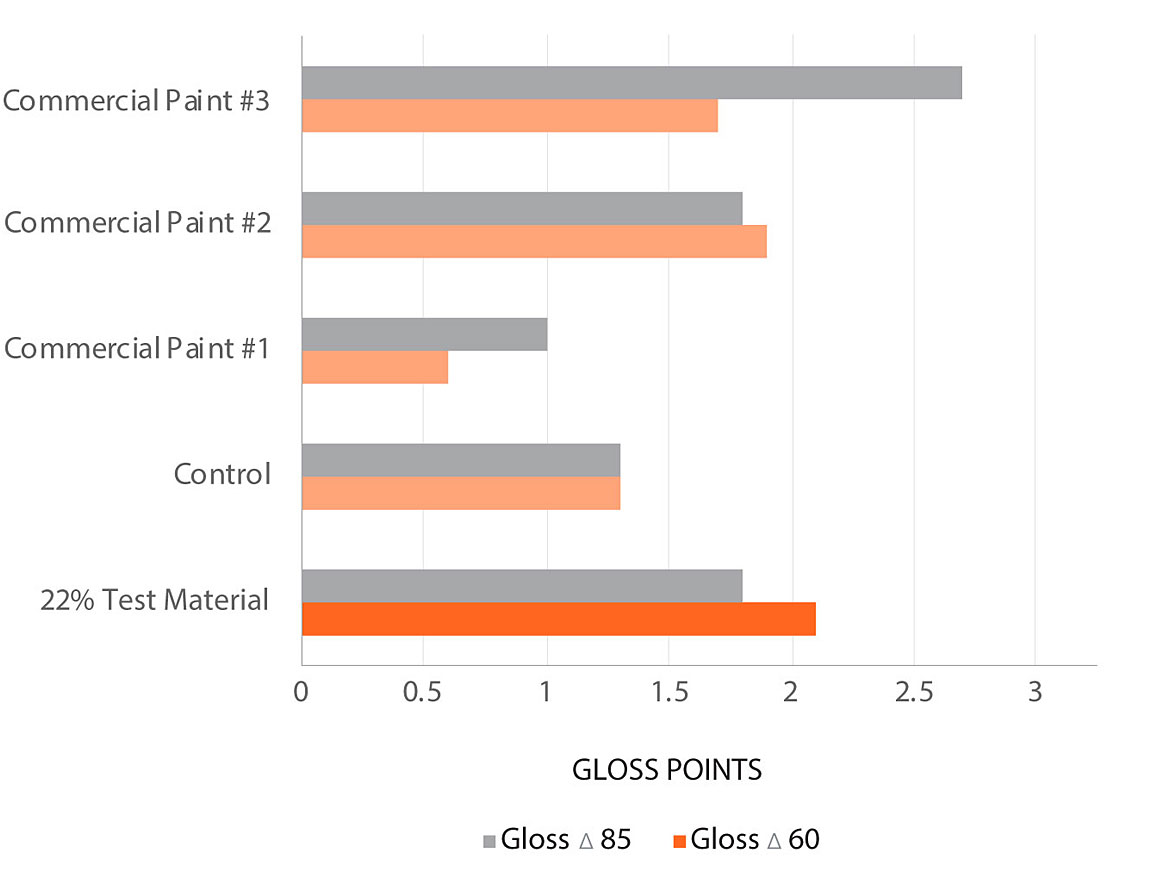
Next, burnish resistance was evaluated at both 60 and 85 degrees. Samples were drawn down to a 7-mil thickness onto Leneta P121-10N scrub charts, placed horizontally and left undisturbed to cure for seven days in a horizontal position before evaluation.
Gloss readings were taken at 60 and 85 degrees both before and after having a 1,000-g weight wrapped with an Aida cloth applied for 10 double rubs. Each sample was tested via this method in triplicate.
Figures 2 and 3 illustrate the results for the 60- and 85-degree evaluations, which show that the 15% and 22% Test Material have similar performance to the Control and commercial paints.
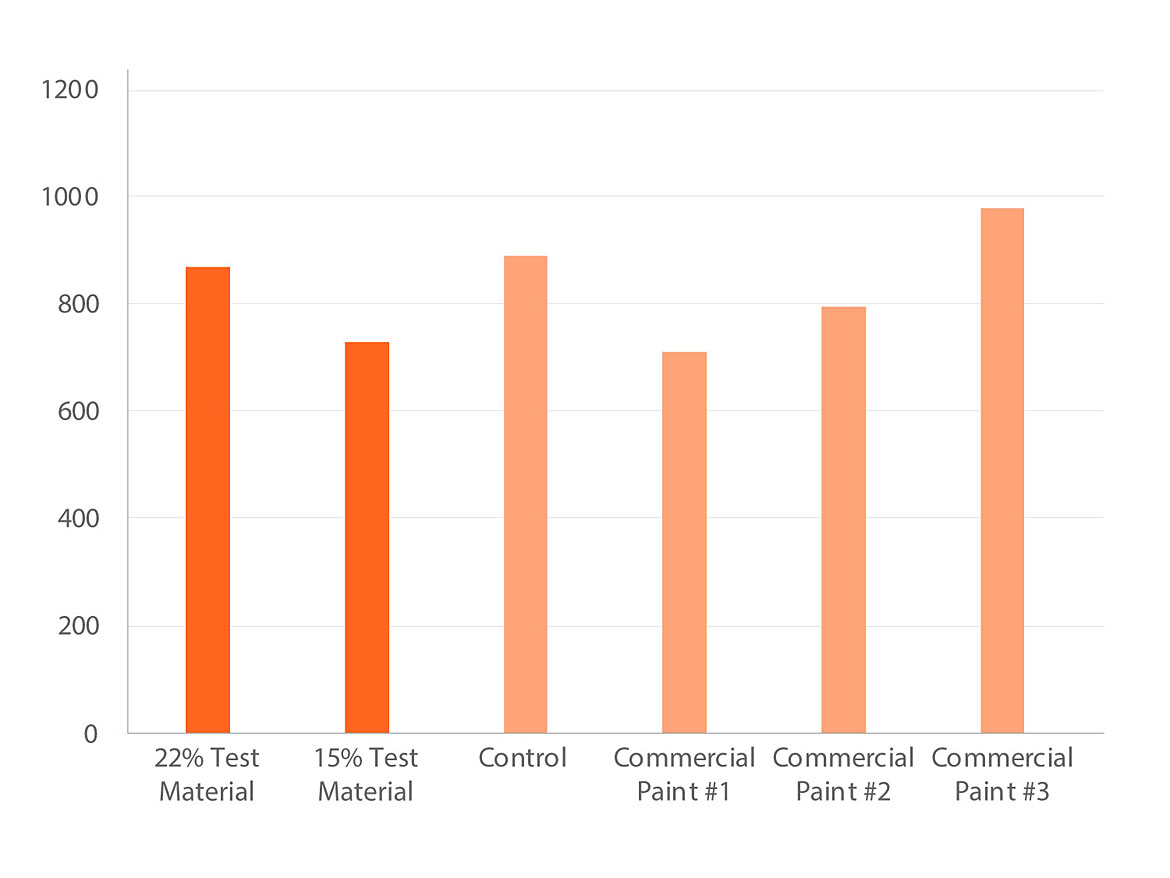
Next, we evaluated scrub resistance based on ASTM D2486. Samples were drawn down to a 7-mil thickness onto a Leneta P121-10N scrub chart then dried horizontally for seven days. Each test paint was placed on a ½-inch-wide by 10-mil shim, then scrubbed using a standard nylon bristle brush and abrasive medium (SC-2) until paint film failure occurred across the width of the shim. We added 10 grams of abrasive scrub solution and 5 mL of water after every 400 cycles; we noted the number of cycles required to failure.
Figure 4 shows that the 22% Test Material outperformed two commercial paints and was equivalent to the Control. Likewise, the 15% Test Material was equivalent to one of the commercial paints.
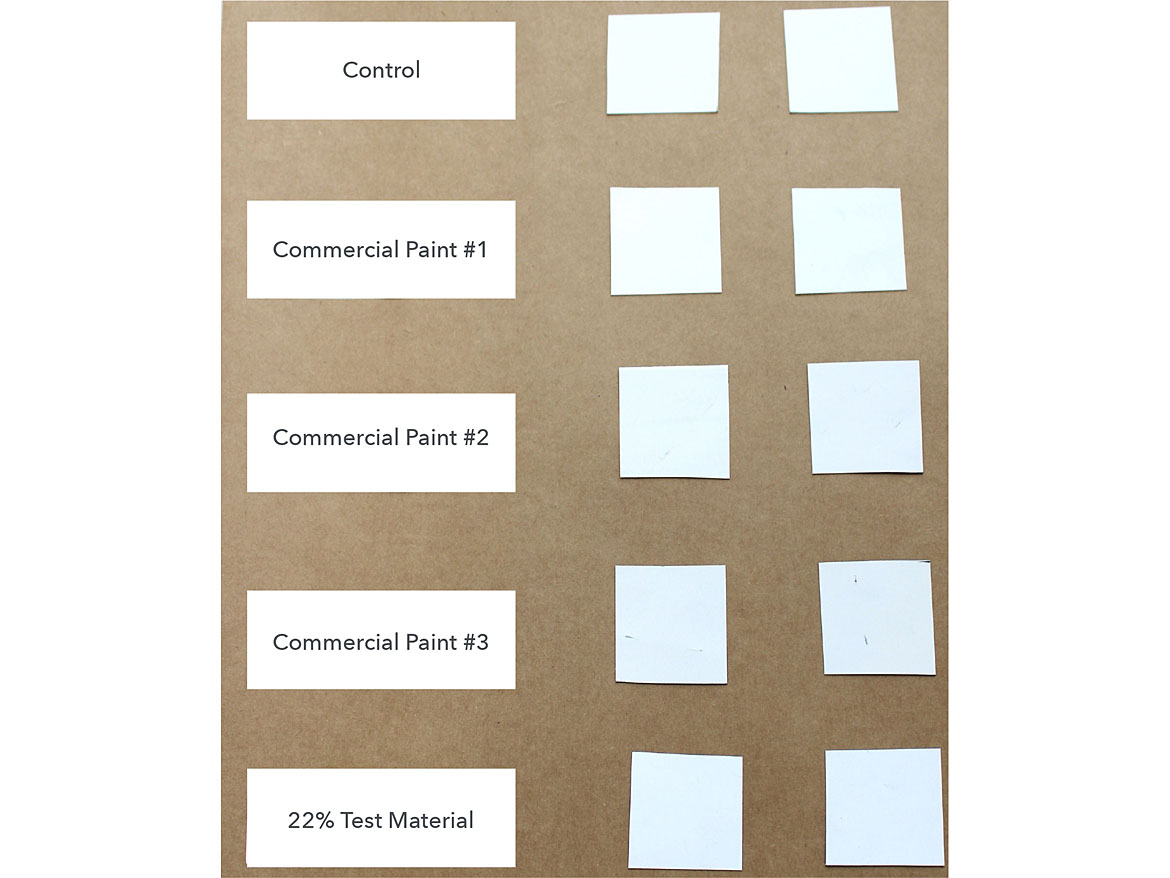
Blocking was evaluated via the ASTM D4946 protocol. As shown in Figure 5, none of the samples tested exhibited blocking tendencies.
A paint sample was applied by draw down on a sealed Leneta WB chart to a uniform wet thickness of 3 mils. The film was then allowed to dry horizontally for seven days. 1½-inch X 1½-inch squares were cut and placed face to face with a 1,000-g weight on top of a #8 rubber stopper at both room temperature and 120 °F. The weight and stopper were removed after 30 minutes, and we determined block resistance by separating the specimens and evaluating them using the ASTM D4946 standard which is a pass/fail evaluation. None of the specimens exhibited blocking.
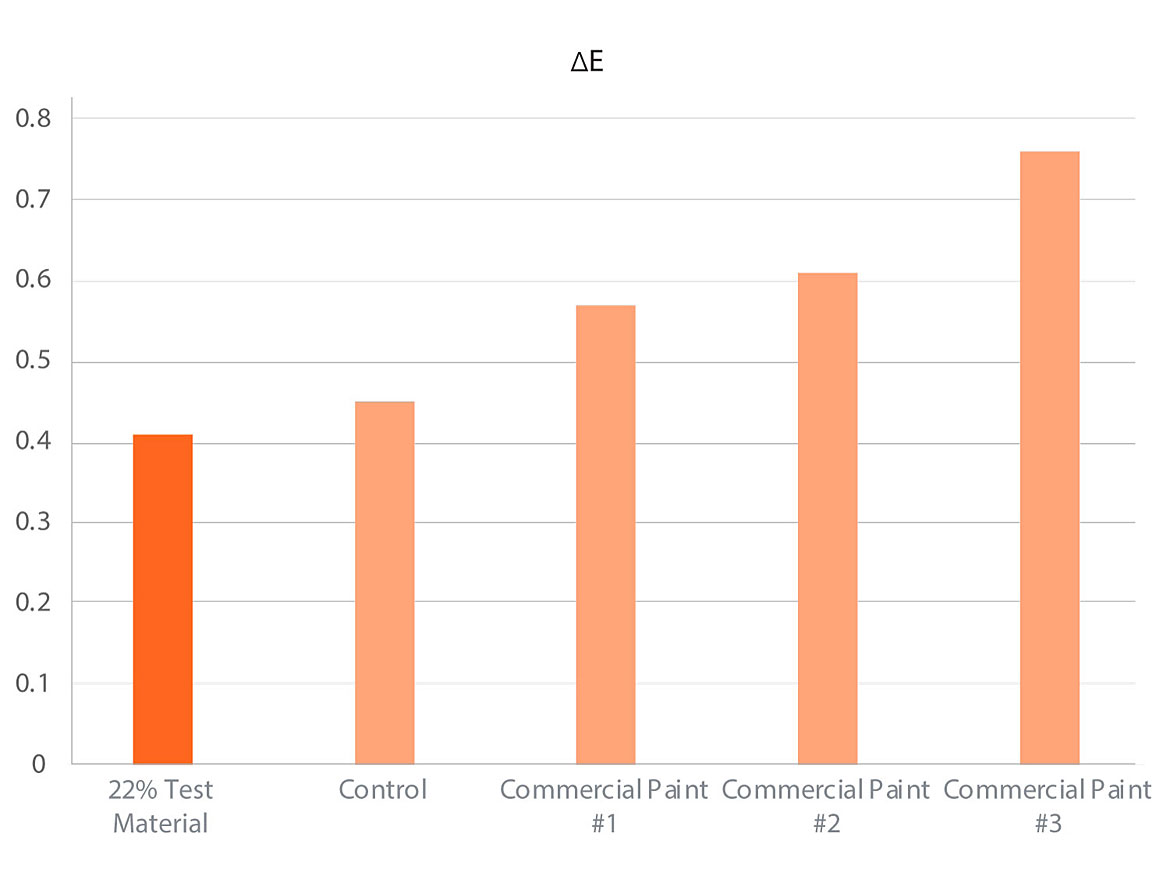
We also tested for any change in gloss or color after touching up the paint. Sample testing, performed on Leneta R6-912 Upson boards, included priming them with the test paint and allowing them to cure overnight. After curing, the test paint was applied again by roller using a 3/8-inch Linzer Professional Cover (Performance Select Gold Series Covers 639-301). After overnight drying, the panels were retouched with test paint using a Linzer 2-inch Bristle and Polyester Brush. Then, after allowing the touched-up test paint to dry overnight, the panels were evaluated for before and after results via a gloss meter at 60 and 85 degrees. Finally, the panels were evaluated for before and after results using the X-Rite Color computer for ΔE change.
The figures below show that all the samples displayed similar gloss increases after touch-up (Figure 6). As for color change, the lowest ΔE change was that of the 22% Test Material (Figure 7).
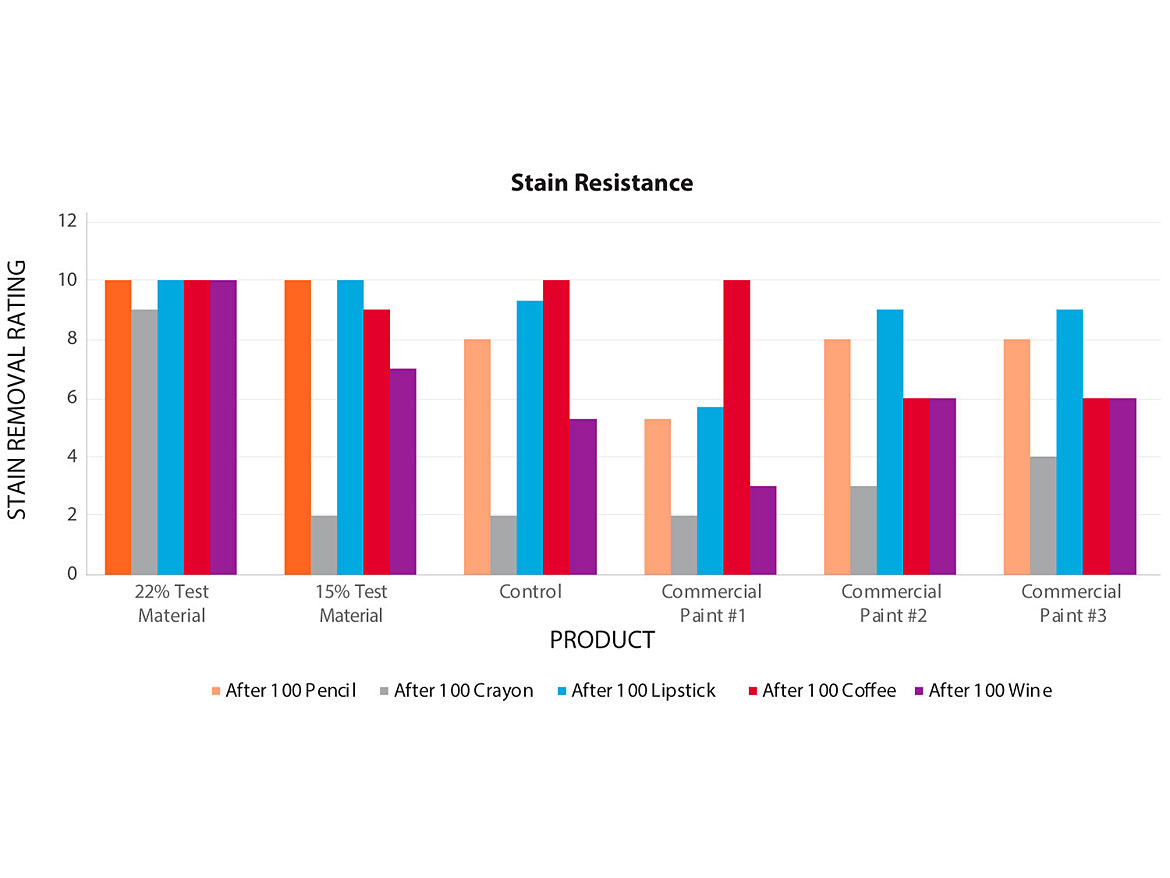
The previous evaluations showed that the Test Material provided equivalent or slightly better performance than the Control and commercial paints. In addition, we found that the Test Material offered more significant stain removal via the ASTM D3450 and ASTM D4828 protocols.
The samples were applied on a Leneta P121-10N scrub chart using a 7-mil Dow blade. The film was then allowed to dry horizontally for seven days.
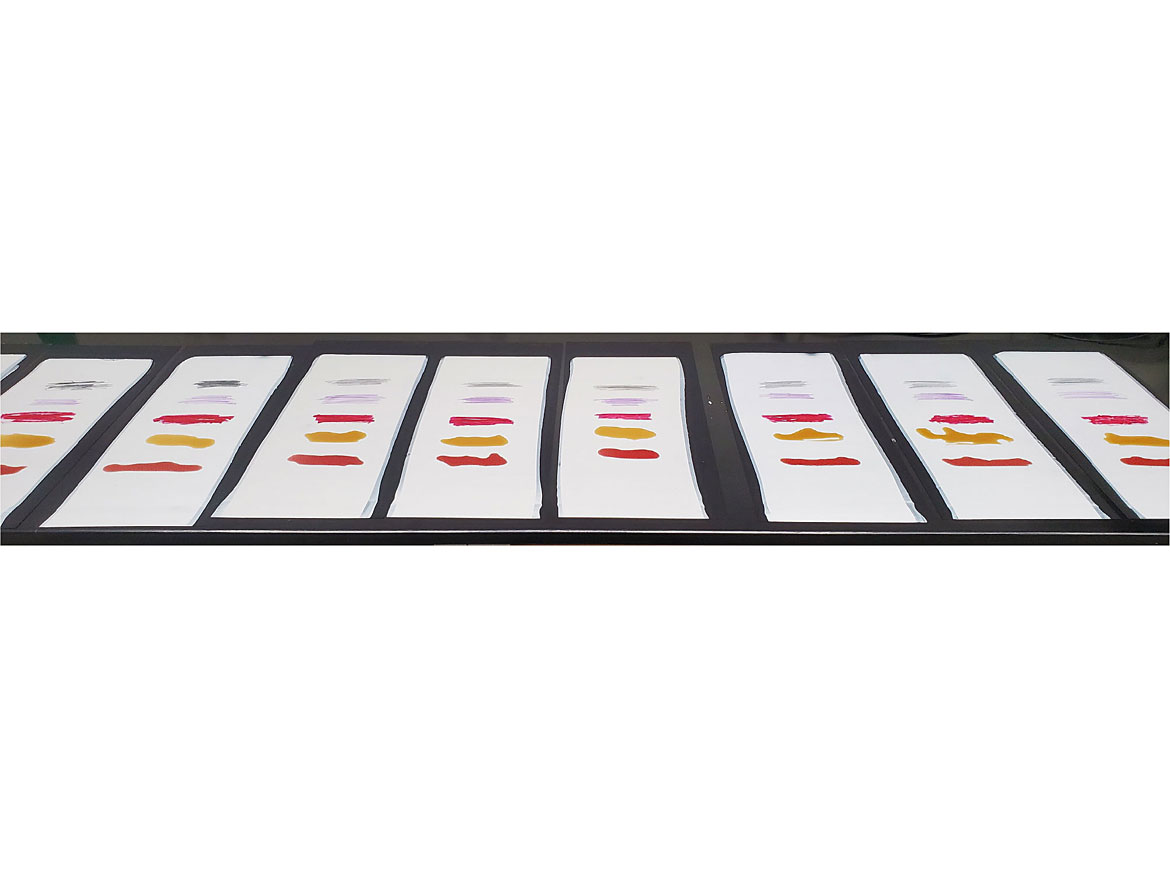
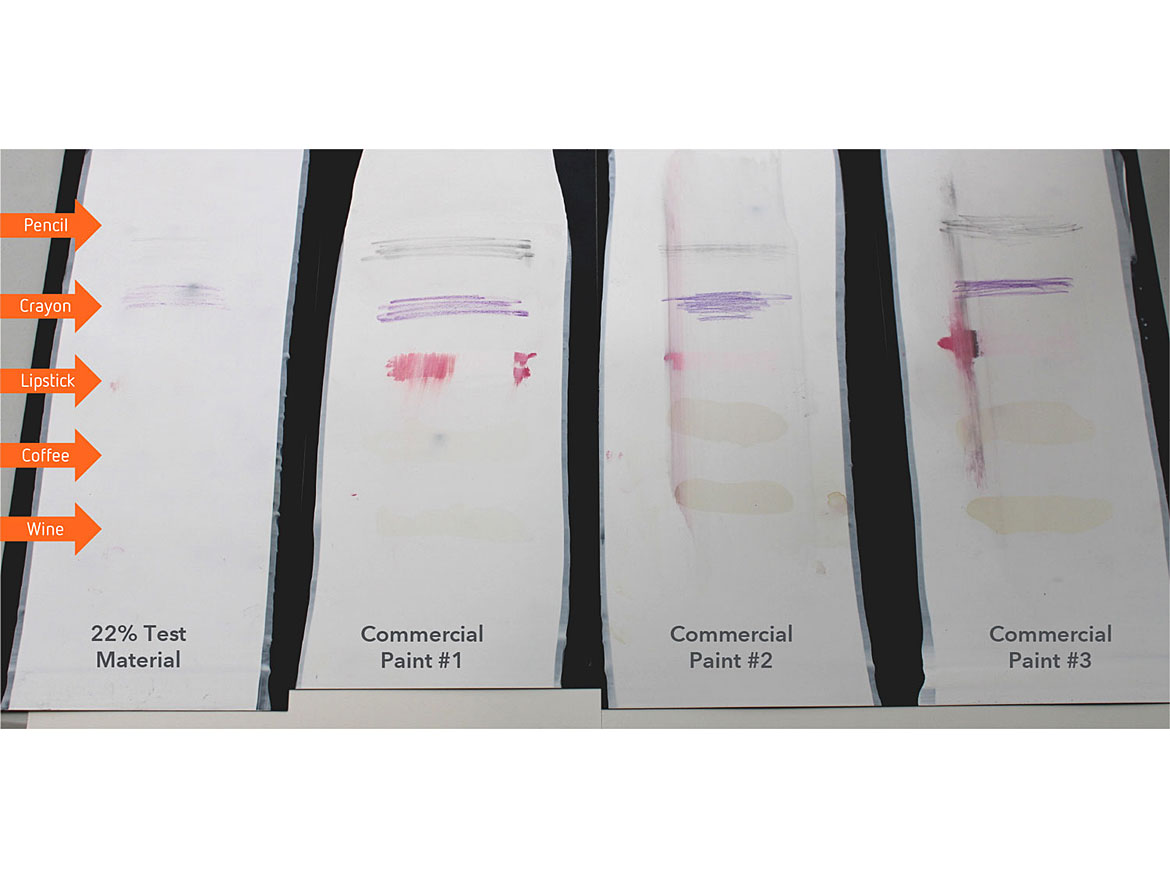
On each panel, we applied lines of #2 pencil, purple crayon, red lipstick, coffee and burgundy red wine perpendicular to the length of each panel (Figure 8). The coffee and wine were applied with a disposable pipet and allowed to sit for 10 minutes before blotting dry with a paper towel.
The stains were allowed to sit for 2 hours before placing each panel in a scrub tester. The panels were then washed with a cellulose sponge using 15 mL of water and 10 g of standard, non-abrasive medium (SC-1) from Leneta. Next, we scored the number of cycles required to remove the stains and the residue remaining after 100 cycles.
The following rating system was used for each stain:
- 10: 90% or more removed
- 9: 80% removed
- 8: 70% removed
- 7: 60% removed
- 6: 50% removed
- 5: 40% removed
- 4: 30% removed
- 3: 20% removed
- 2: 10% removed
- 1: < 5% removed
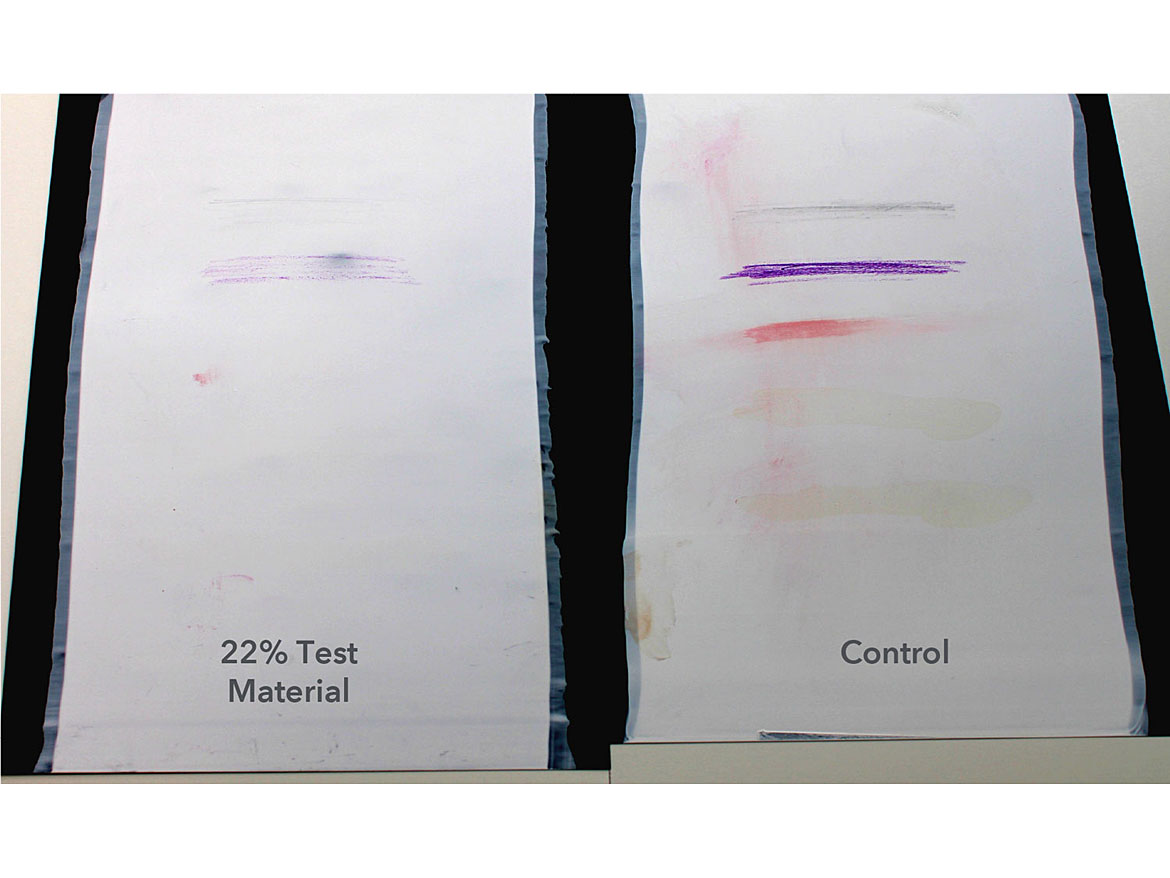
The results were evaluated qualitatively and recorded (Figure 9). The 22% Test Material had superior performance to the Control and the commercial paints (Figures 10 and 11).
After observing the strong performance of the coating in the stain removal tests, we wanted to understand why the coating provided superior stain resistance. There are two potential mechanisms for stain removal of a coating. One is that the coating can act as a sacrificial layer and come off when cleaned. The other is for the coating to have release properties, allowing the stain to be removed while leaving the coating intact. To evaluate the mechanism of stain resistance by the test material, we studied the chart's surface using a Keyence VK-X200 Laser Microscope to see if the scrubbing reduced the thickness of the coating.
The Control and the 22% Test Material samples were analyzed with the microscope at 10x using the VK Analyzer software to evaluate the topography of the surface of each coating after being applied to the Leneta (Figure 12).
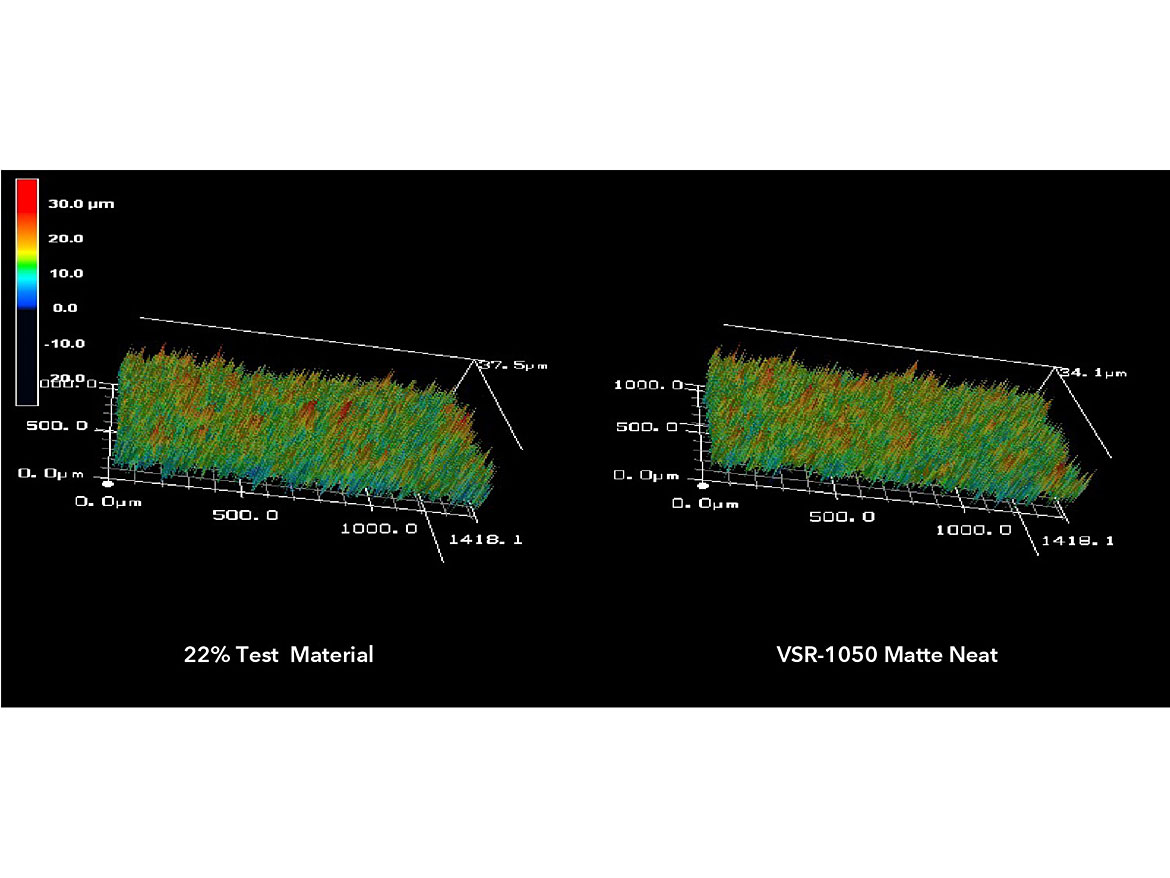
Figure 12 shows that the Control and the 22% Test Material have similar topography (range in height from peak to valley) in the initial evaluation. This image and associated measurements only indicate the surface features of the coating, not the thickness of the coating itself. To fully understand if the material was sacrificial, a measurement of the true thickness of the coating was needed.
In order to measure the thickness of the coating, we first had to identify the top surface of the Leneta card. This was achieved by identifying pinholes in the coating surface. These pinholes were likely the result of air bubbles entrained during the process of drawing down the coating.
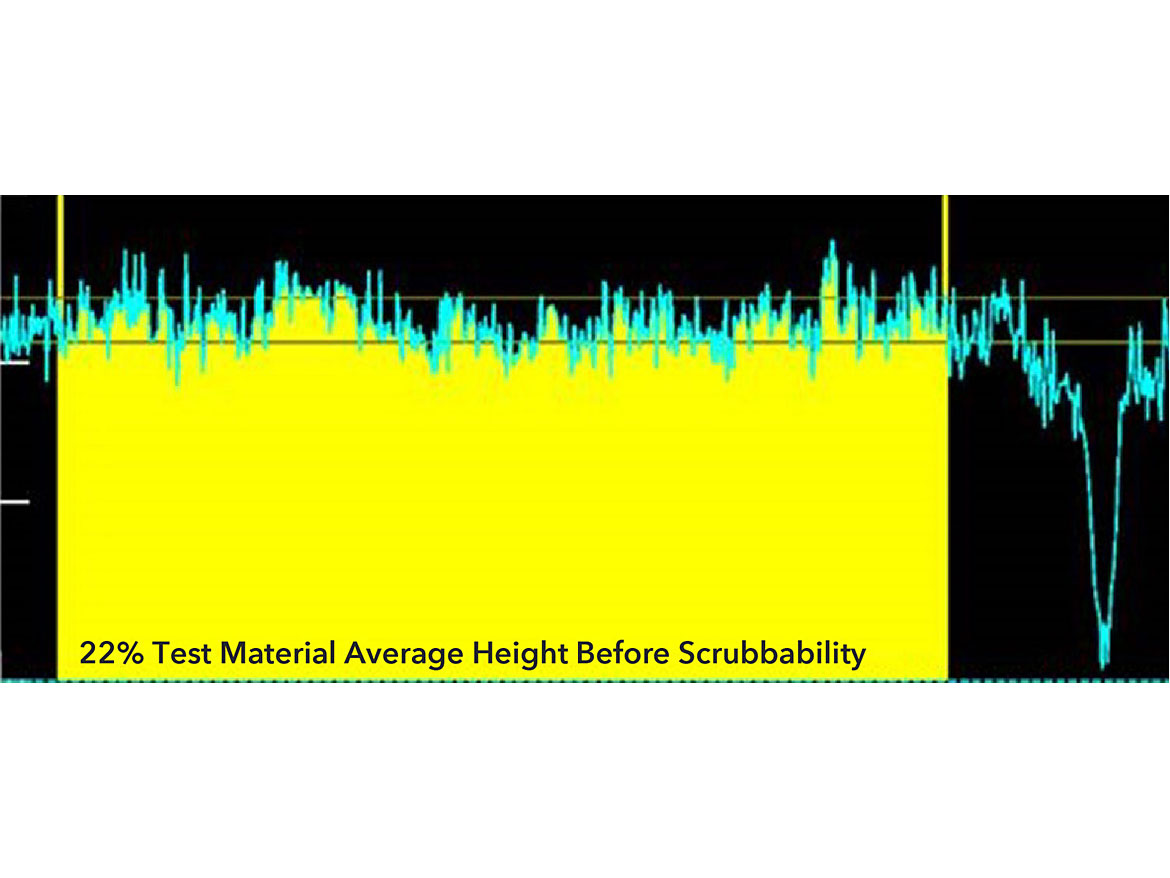
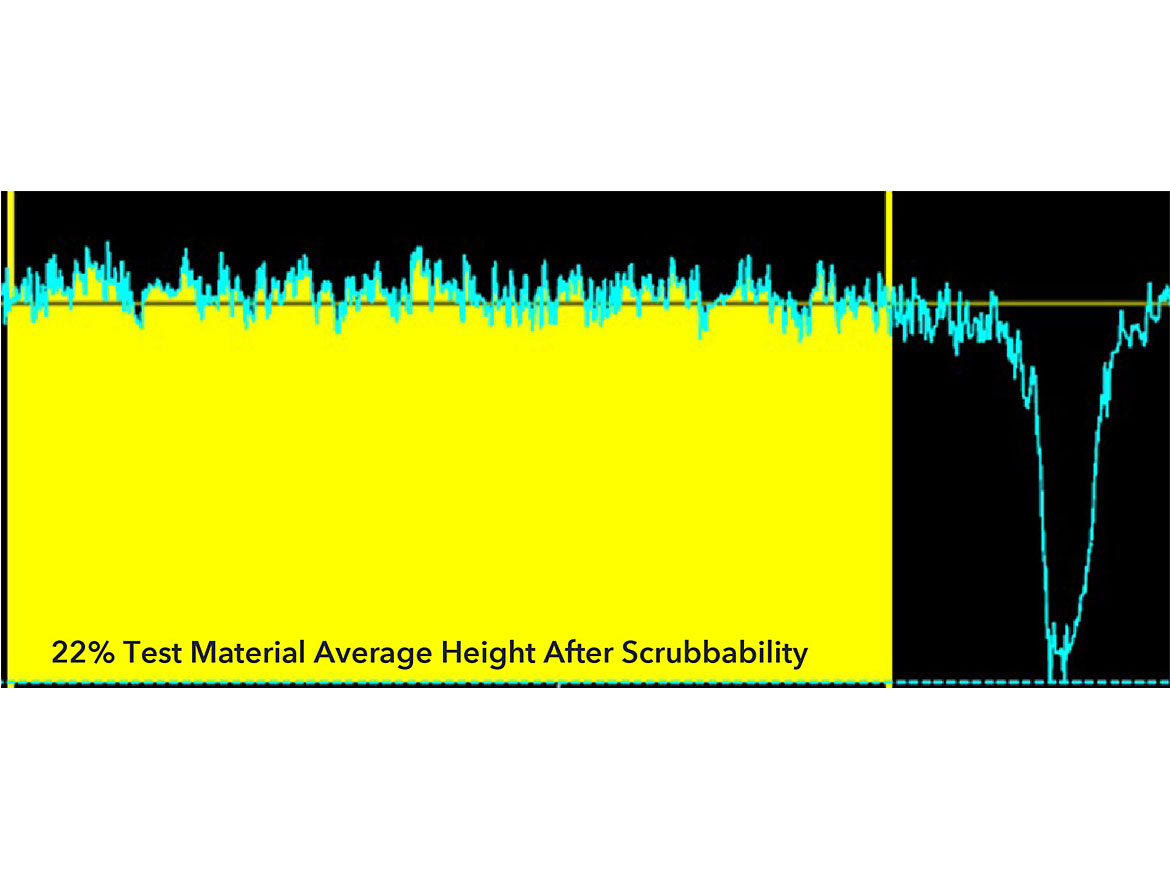
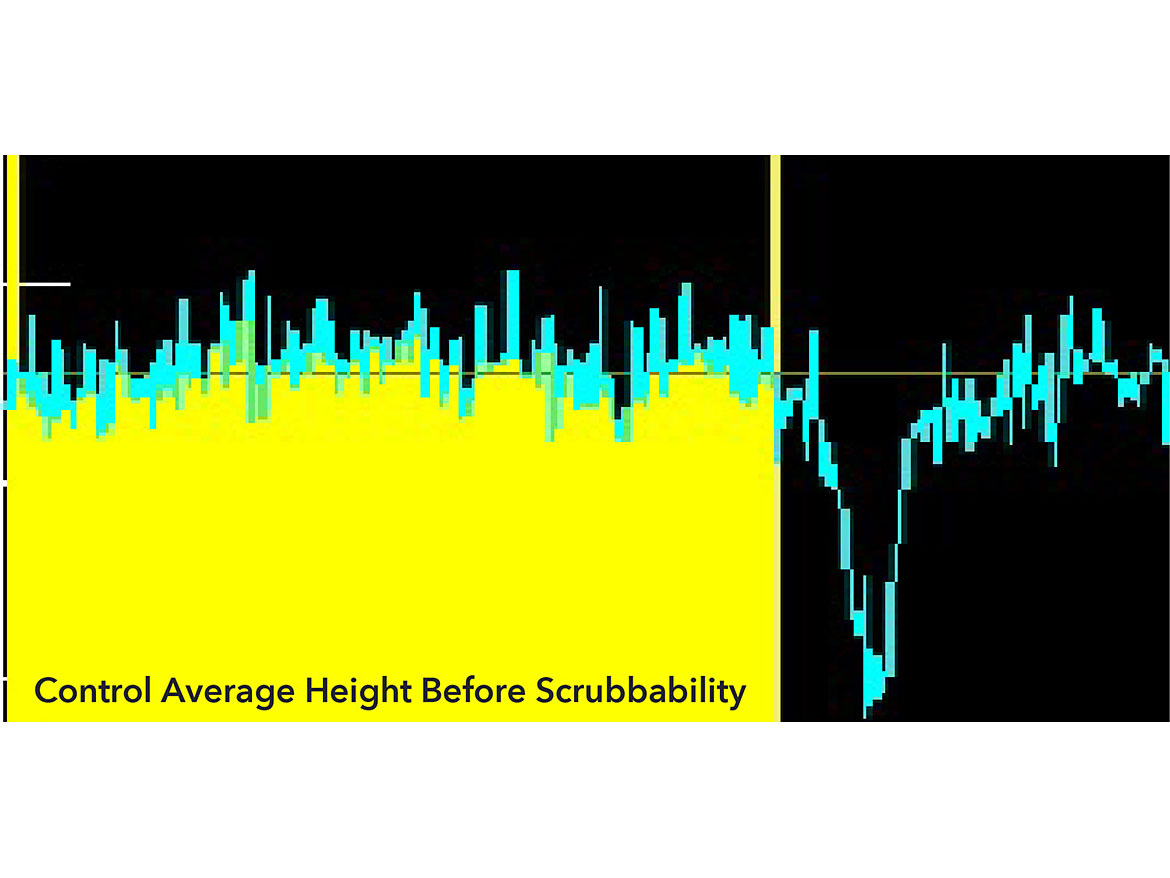
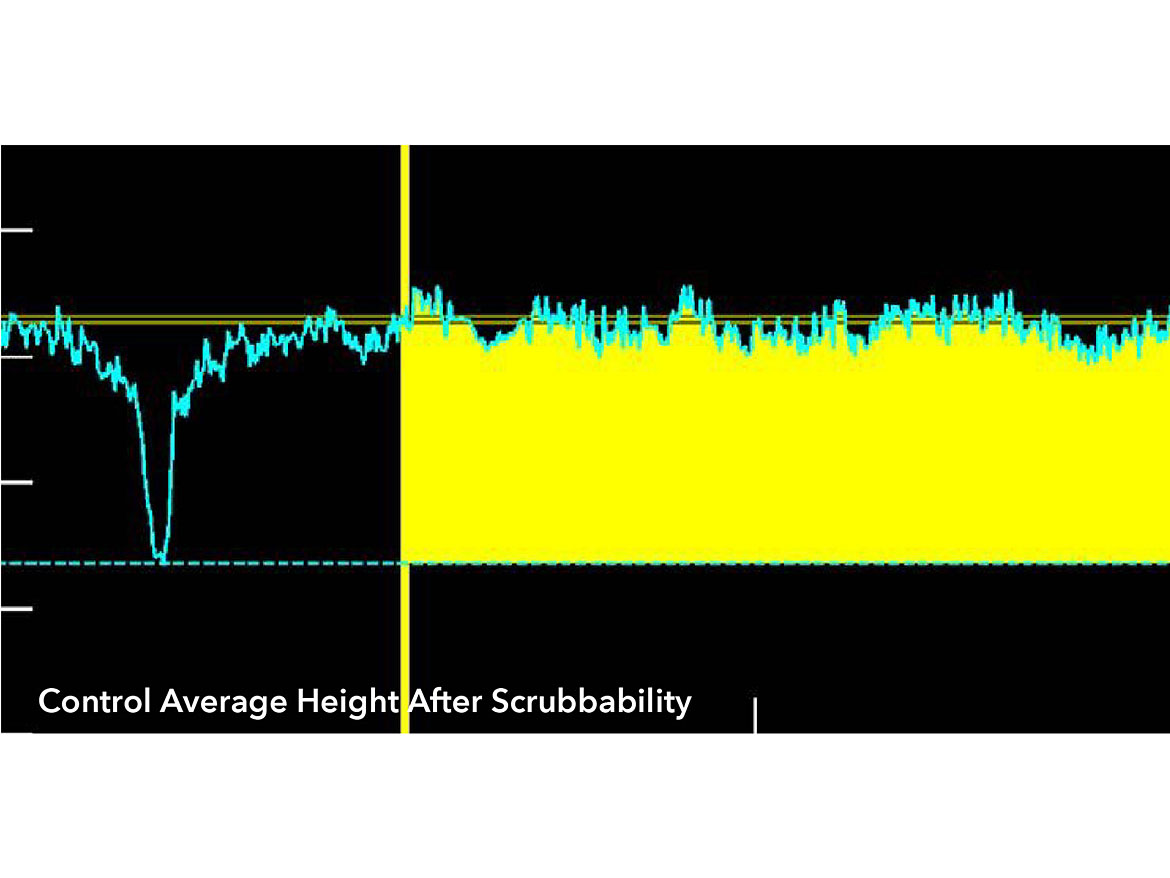
Figures 13-16 show how this pinhole appears in the profile assessment in the Keyence software. Once this surface was identified, we were able to measure from the top surface of the Leneta to the average height of the peaks of the coating.
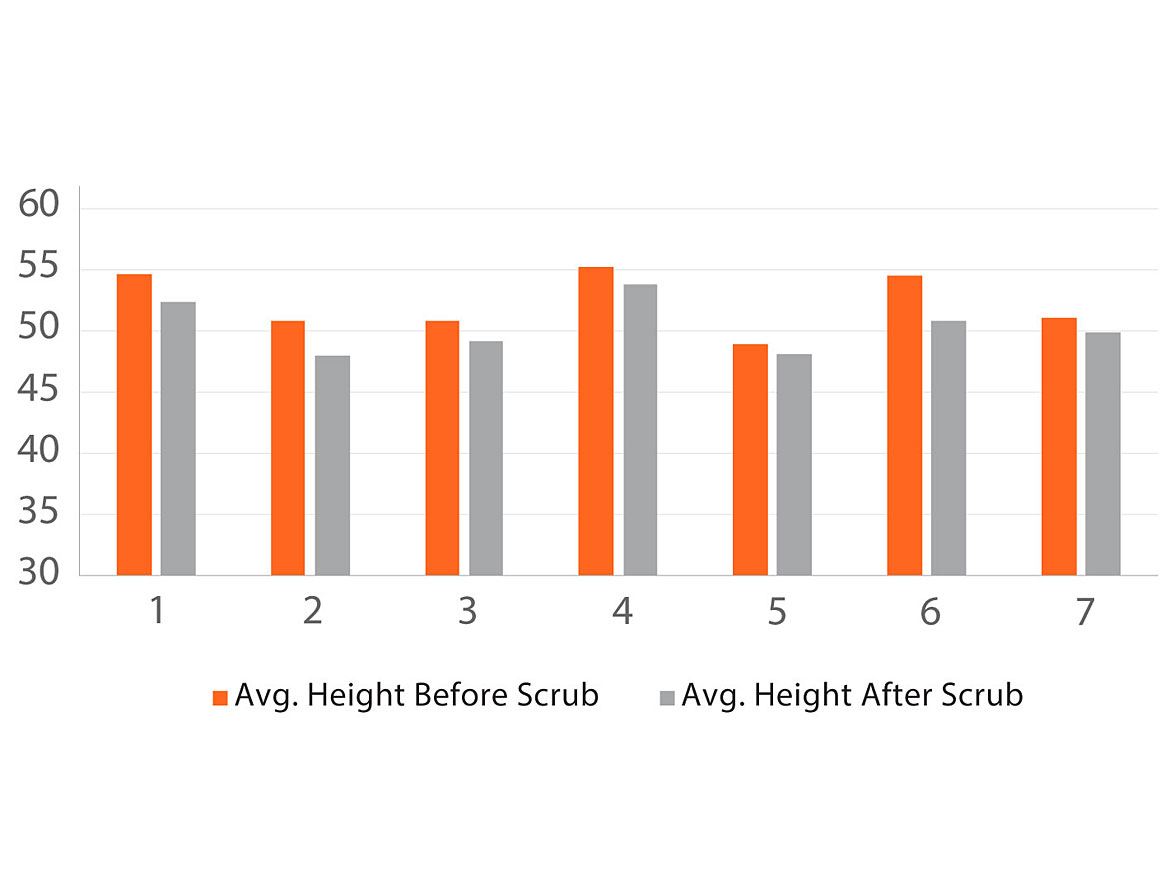
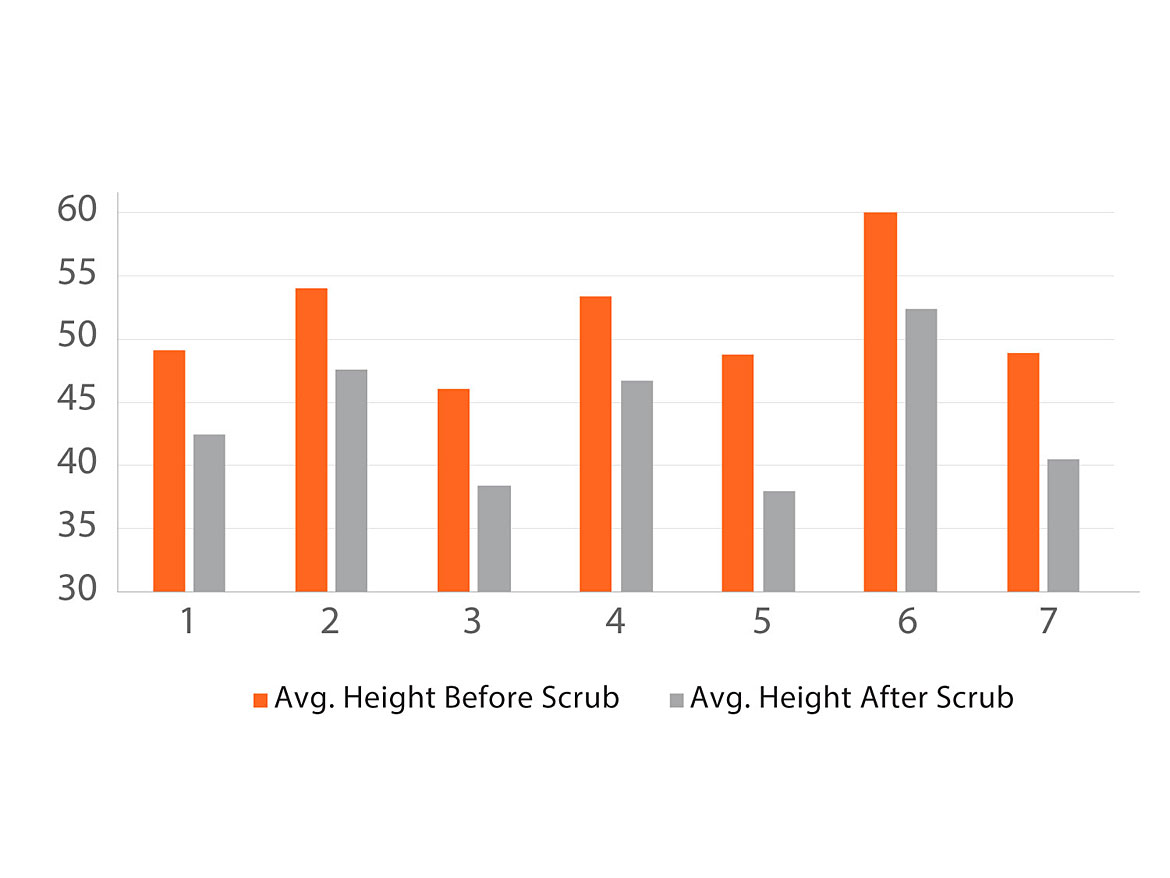
We evaluated seven drawdowns for each formulation. First, the initial coating thickness was determined (taken as the distance from the Leneta to the average peak height). Then, we performed stain resistance testing and repeated the measurement in the same area (Figures 13-16).
The summary of these measurements is shown in Figures 17 and 18. In these figures it is easily seen that there is much greater coating loss in the control than in the 22% Test Material, as seen by the difference in the orange and gray bars.
We found that across the samples of each condition, the 22% Test Material exhibited an average of only 2 microns loss in coating thickness, whereas the Control showed 8 microns of loss of coating thickness. A statistical analysis of the data confirmed the significance of this difference, leading us to confirm that the stain resistance performance of the 22% Test Material is not accomplished by sacrificing the coating during cleaning.
Conclusion
The Test Material developed by Michelman outperforms commercial paints and VSR1050 SPF Control in stain testing at both 15% and 22% (Figures 9-11). At both 15% and 22% addition levels, it also delivered equivalent performance on matting, scrub resistance and burnish resistance (Figures 1-4). In addition, the 22% Test Material does not impart any blocking issues (Figure 5), and after touch-up, does not adversely affect gloss and color (Figures 6 and 7).
The Test Material does not appear to impart a “sacrificial” aspect to the coating after testing. Microscopic evaluation showed that when compared to the Control, the loss of material from the surface after scrubbing was less for the Test Material vs. for the Control (Figures 13-18).
As for processing and handling, the Test Material is delivered as a pumpable liquid, therefore reducing or eliminating the need for dust control while incorporating it into the paint formulation. The formulation is also VOC and APEO free, allowing formulators to deliver strong performance while meeting regulatory and customer demands. Finally, because the Test Material offers many of the performance properties required in an interior paint, it can reduce the number of raw materials needed in the final product.
Looking for a reprint of this article?
From high-res PDFs to custom plaques, order your copy today!


