Coatings Industry Report for 2003
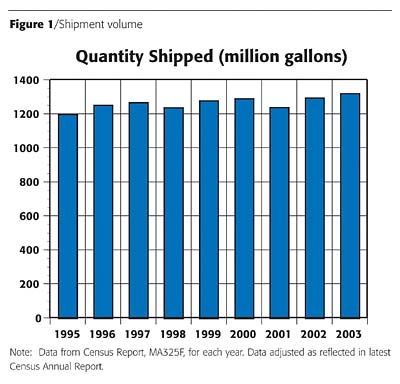
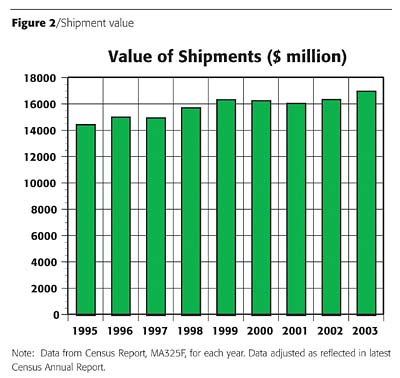
As previously reported, 2003 was a good year for the industry. Industry shipments were the highest ever, with 1,316.6 million gallons having a value of $16,933.9 million. The volume growth represented an increase of 2.0% from 2002, which is slightly higher than the long-term growth rate for the industry. Shipment value increased 3.8% from 2002, compared to a long-term growth rate of 2.0% per year since 1995.
Industry Segment Results
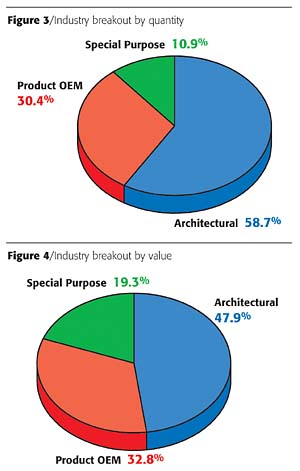
Industry segment breakouts are shown in Figure 3 by volume and Figure 4 by value. The data is also shown in Table 1 showing the breakout for 2002 and 2003.
The year 2003 was very good for architectural coatings. With shipments of 772.8 million gallons, this segment continues to set records and represents a larger portion of the total industry. Shipment volume for 2003 is 8.9% ahead of 2002. Shipment value of $8,104.5 million also represents a healthy increase of 6.5%. The Architectural segment now represents 58.7% of the total industry volume, an increase of 3.7% share since 2002. The continued growth in the segment is a direct result of the new housing boom and house resales. The housing market has been influenced by the low mortgage rates for the past several years.
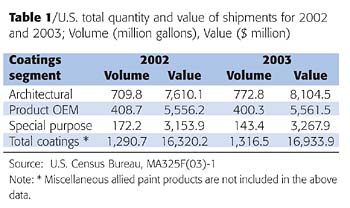
Special Purpose Coatings also reported poor results for 2003. The volume shipped for this segment was 143.4 million gallons, a decline of 16.7% from 2002. The shipment value actually increased 3.6% to $3,267.9 million. As part of the total industry, the segment decreased to 10.9% in volume and remained constant at 19.3% in value. The reporting in this segment remains a mystery. There is no reliable trend either economic or industry related that provides an indication for the fluctuations of this segment. It could be inadequate reporting by the segment members. Trends for the individual categories within the segment are discussed below.
Architectural Coatings
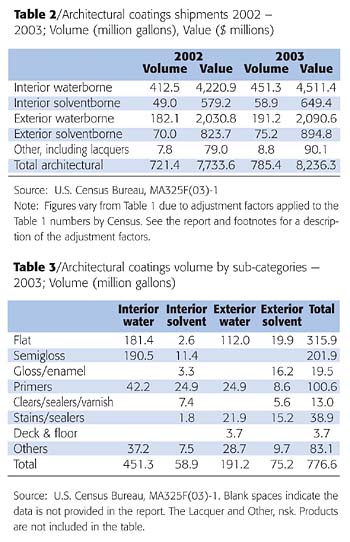
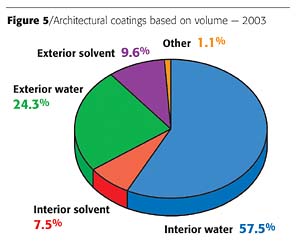
Waterborne architectural coatings represent 81.8% of the total coatings shipped for the segment in 2003. This is a decrease from last year's 82.4%. For interior coatings, waterborne represents 88.5%, a small decrease from last year. For exterior coatings, waterborne represents 71.8%, also a slight decrease from last year. Solventborne coatings showed improvement in shipments after many years of decline. Although solventborne architectural coatings only represent 17.1%, this is an increase of 0.6% from 2002. Interior solventborne increased to 7.5% from 6.2% in 2002, which shows that improved solventborne coatings are being used. Solvents with very low VOC improve the paint quality as well as eliminate solvent odor.
Interior coatings comprised 65.1% of the total architectural coatings. Exterior coatings are gradually declining and now stand at 33.9% of the total. The exterior market has been shrinking over the past decades as more non-wood exterior sidings are used in new home construction. The quality of exterior coatings has also improved to permit a longer life span for the coatings, thus reducing the amount of coatings used each year. Waterborne coatings made advances in both the interior and exterior segments of the architectural market. Architectural comparisons for 2002 and 2003 are shown in Table 2.
The Census report provides further description of architectural coatings. The categories are broad and sometimes overlapping. Table 3 shows the breakout of coatings by the various categories.
From Table 3, the major category is the finish/top coat, with flat leading, followed by semigloss and primers. Because of the rapid drying of waterborne coatings, a high-gloss finish is harder to achieve. Consequently, as more waterborne is used, the amount of high-gloss coatings decreases. Primers are important in both interior and exterior applications. In 2003, primer shipments increased to 100.6 million gallons from 79.2 million gallons, an increase of 27%. This increase seems large, but was checked with the Census department, which assured that the numbers were as reported by the paint companies. Since some coatings are sold for interior/exterior uses, the listing in the table may not give an accurate picture of where the coatings are being applied.
Product OEM Coatings
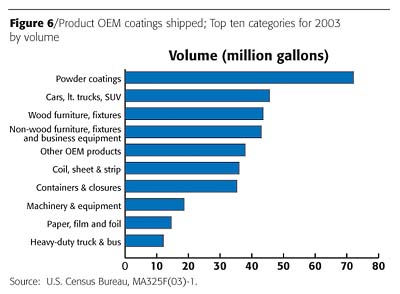
The Product OEM segment declined in 2003 by 2.1% in volume, from a restated 2002 volume, which also showed a decline from 2001. The year 2000 set the record of 456.6 million gallons shipped for the segment. Shipments have declined each year since. The results of the individual categories continue to be mixed. Gains in volume shipped in 2003 were realized in non-wood furniture and fixtures; major appliances; railroad, aircraft and other transportation; and automotive powder categories. Declines occurred in the automotive cars, light trucks, and sports utility vehicles; automotive parts; container and closures; and powder coating categories. The other categories remained about even with 2002.
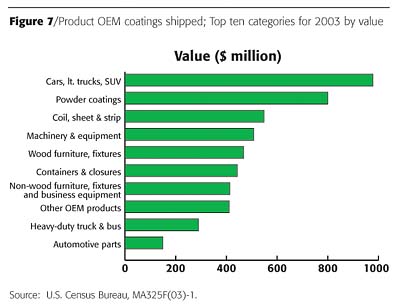
The 10 largest categories included in the Product OEM segment for 2003 are shown in Figure 6, listed in terms of volume shipped, and Figure 7, listed by product value shipped.
Special Purpose Coatings
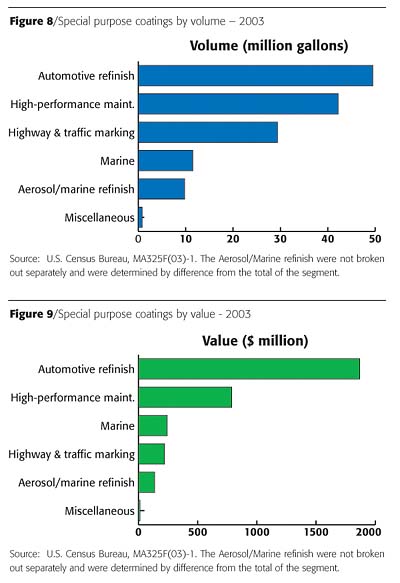
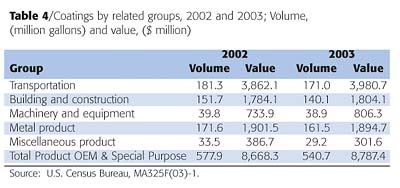
Special Purpose coatings continued a seesaw volume of shipments with 2003 volume being down almost 17% from 2002 with the majority of decline in high-performance maintenance and highway and traffic marking coatings. The volume is also lower than in 2001, the previous down year. Shipment value, however, increased by 3.6% over 2002, due to the increase in shipment prices in most categories.This segment of the coating industry is smaller in the number of categories of coatings included, but the individual categories are quite large, especially in value. The average price per gallon for the segment in 2003 was $22.80, compared to 2002 at $18.32. The price per gallon compares to the Product OEM segment where the average price was $13.89 and the Architectural segment where the average price was $10.49, (the latter price is at the manufacturing level not the retail level). Thus it can be seen that the coatings in this segment command a significant premium over the coatings of the other segments. The auto refinishing category, with a $37.73 per gallon value, helps skew the results of the Special Purpose segment. The price per gallon increased in all the categories of the special purpose coatings except aerosol/marine refinish.
Coatings by Related Groups
In order to view the various categories of coatings within the Product OEM and the Special Purpose coatings segments, the categories have been put in groups of similar industry interest. Table 4 shows these five groups together with the 2002 and 2003 shipment volumes and values. This table illustrates the size of the various related industry groups. To view the makeup of the various groups, a separate section follows for each group.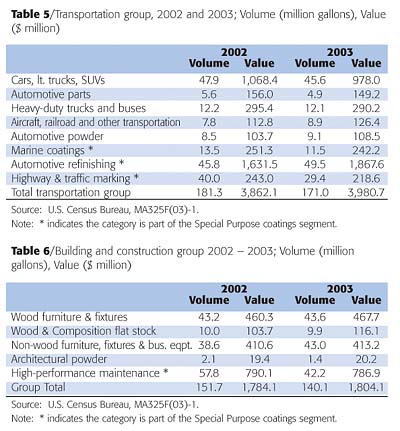
Transportation Group
This category represents the largest group with all the coatings having a direct relationship to the transportation industry. Some of the special purpose coating categories are included because of their direct relationship to transportation. Table 5 shows all these categories for 2002 and 2003.Table 5 shows that the entire transportation group was down in volume by 6.7% for 2003. This fits with the U.S.-made automobile industry being down for the year. A few bright spots were the upturn in the aircraft, railroad and other transportation; automotive powder doing better; and automotive refinishing growing by 8.7%. The total shipment value for the group was also positive with an increase of 3.1%. The total transportation category with $3,980.7 million represents 45% of the shipment value for the product OEM and Special Purpose coatings segments.
The automotive and automotive parts categories follow closely the trends of the U.S. automotive manufacturers. 2003 was soft for the U.S. manufacturers, although imports allowed the industry to have an even year. With a larger percent of automotive manufacture offshore, the U.S. production base is still hanging on with large annual production numbers and, although somewhat stagnant, is still operating at a fairly high level. A real downturn or recession has not hit the industry in the past decade.
Heavy-duty trucks were almost equal to 2002 in coating shipments. This category has been level for several years, although it is down from the higher shipments made in the late 1990s.
Aircraft, railroad and other transportation coatings showed an increase in 2003. It is still much below the boom years of 1998 - 2001, when over 12 million gallons were shipped. It is unfortunate that the census cannot break down the numbers further. It is likely that during the boom years the railroad manufacturers were the very active part. Currently, the aircraft industry is becoming more active, especially military aircraft.
It is possible that automotive powder coatings are beginning to make greater inroads. The potential is large, but alternate technologies keep improving and holding powder to a small niche market. If and when powder breaks out of its niche market, the production could expand greatly.
Marine coatings, although down in 2003, is at the normal level of production. U.S. producers do not supply the manufacturers of new large ships that are produced almost completely offshore. The larger coating manufacturers have foreign operations that supply the offshore marine industry.
Automotive refinishing had a very good year, with an increase in 2003 of 8.1%, coming after an increase of 7.7% the prior year. This is almost up to record levels achieved in the late 1990s. Highway and traffic marking paints turned down in 2003, with a decline of over 24%. Part of the decline is due to the greater use of competing non-coating technologies and also the downturn in 2003 of spending for highway construction, repair and maintenance. The availability of federal and state funds is critical to the success of this category.
Building and Construction Group
This group includes a number of coating categories that relate directly to the building and construction industries. Overall, this group declined about 7.6% from 2002. The high-performance coating category was the major cause of the decline with a decrease of 27%. The non-wood furniture, fixtures and business equipment category increased about 11%. These two categories were exactly opposite in change from the previous annual report of 2002. The rest of the group remained fairly constant with the previous year. Table 6 presents the details for this group of coating categories.The two wood categories, wood furniture and fixtures, and wood and composition flat stock, both remained about even with 2002. With the continued boom in the housing market, it appears that a larger proportion of finished wood products are being imported to supply the demand.
The non-wood furniture, fixtures and business equipment category increased by about 11%, reversing the previous year's decline. The business equipment part of this category has remained strong, but more imports have reduced the amount of coatings sold domestically. The total category is still below peak levels achieved during the boom years of 1999 - 2001. The current level of shipments, 43 million gallons, is close to the long-term trend.
The high-performance maintenance category has once again fallen from the previous year. It declined by 27%, after a similar increase in 2002. The long-term level of shipments should be over 60 million gallons. Thus the 2003 shipments are quite low, at 42.2 million gallons. It should be mentioned that the value of shipments remained almost level with 2002. Longer lasting and more expensive coatings may represent some of the change. The construction, repair and maintenance businesses are still soft, with repair and maintenance projects being postponed. The decline of manufacturing in the United States has likely contributed to the decline in coating needs.
The architectural powder category, although relatively small, still declined in volume shipments in 2002. The value, however, remained constant.
Machinery and Equipment
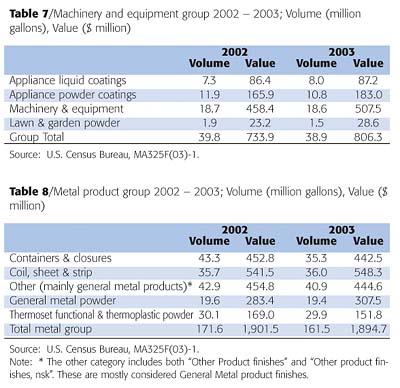
Table 7 shows the comparison of the various categories for this group. Appliance coatings declined slightly in 2003, with the coatings supplied down 2.1% in volume, counting both liquid and powder coatings. Individually, liquid coatings increased, but were offset by the decrease in powder coatings. These two categories compete with each other for the finished appliance product. The total value of shipments to the appliance industry increased 7.1% in 2003.The machinery and equipment category, after a very good year in 2002, remained about equal in volume shipped, and even showed an increase in value shipped of 10.7%. These numbers indicate that this sector is operating at a fairly good level. The quantity shipped in 2001 was the highest in two decades, and the 2002 amount is second highest, followed closely by 2003. This category is one of the few that gained in average price per gallon shipped to $27.28. 2003 continued to be a good year for machinery and equipment coating sales.
Lawn and garden powder volume shipments decreased in 2003 by 21%. The value of shipments, however, increased by over 23%, and the average price per pound jumped significantly to $3.81 in 2003, compared to the $2.44 per pound on 2002.
Metal Product Coating
This group represents coatings for metal products although they may be used by a variety of industries. The makeup of this group is shown in Table 8.Containers and closures decreased by over 18% in volume and 2% in value in 2003. The decrease in volume appears wrong since beverage containers continue to increase in consumption. Is it possible that the coating per container has continued to decrease? The average price per gallon increased in this category also.
Coil, sheet and strip coatings gained slightly in 2002 with an increase in volume of 0.8% and an increase in value of 1.3%. However, the coil coating industry continues to struggle due to the slow economy and the number of viable competing technologies. Coil coating has not been able to penetrate any really new markets to offset lost business in traditional markets in the last few years.
The general metal category, including both liquid and powder coatings, dropped about 3.5% in volume in 2003. The value of these two categories increased 1.9% in 2003. Although these categories did not recover in 2003, at least they did not continue to decline much. The peak years for the categories were 1996 - 2000. Powder coatings have not gained more market share in the last couple years. The average price per gallon of the liquid coatings improved as well as price per pound of powder coatings.
The thermoset functional and thermoplastic powder coatings category remained relatively the same in volume in 2003 compared to 2002. The value of powder coatings decreased by 10% in 2003. Data for the category is not reported separately and is derived by difference from the total powder coatings shipped and the powder shipments reported in the other powder categories. Due to the few reporting companies for the two parts of this category, thermoset functional and thermoplastic, separate quantities are not reported for either individually.
Miscellaneous Group
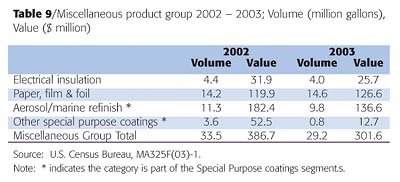
This group consists of a number of categories that did not fit in with the above groupings. Table 9 includes the remaining categories of both the Product OEM and the Special Purpose coatings segments.Electrical insulation coatings declined in volume by 9% in 2003. Shipment value declined by 19%, and the price per gallon decreased in 2003. The consolidation of the industry manufacturers of electrical insulation coatings and the spin off of some businesses may be adversely affecting the reporting of data to the Census department.
Paper, film and foil coatings increased marginally in volume and gained about 6% in value during 2003. The category supplies much of its products to the transportation industry; thus the lack of growth during the year. Prices, however, did increase a small amount during the year.
Aerosol coatings and marine refinish coatings used to be reported separately. However, because of the small number of reporting companies, the Census department leaves these two categories blank to withhold disclosing data from individual companies. Marine refinish coatings had been around 1 million gallons in previous years when it was reported separately. This year the numbers had to be obtained by difference between the total special purpose coatings and the reported data of the other categories in the segment. The combined category showed a sharp decline in volume shipped, 13%, and an even sharper decline in the value shipped in 2003 of 25%. The average price per gallon declined also. Because of the limited information reported for this category, the data may be unreliable.
The other special purpose coatings are those that could not be classified into the various categories of the segment. The small amount reported in 2003 is not comparable to the previous year's data. The other special purpose products volume and value follows the rest of the Special Purporse segment, but is not significant due to its small size.
Powder Coatings
Powder coatings have been mentioned in the various groups above. Powder coatings are reported in pounds to Census and converted to gallons using a 5-pound per gallon conversion factor. For 2003, 360.6 million pounds were reported, and in 2002, 370.4 million pounds. Powder coatings are no longer the fast growing category of the product OEM segment. Markets that can use powder coating efficiently and economically have switched over from liquid coatings. Liquid coatings have made technological advances in the past few years and are preventing further penetration of the market for metal products. The volumes of powder sold are significant but not growing as they did during the 1980s and 1990s. An increase in the price per pound of powder coating did increase in 2003. With all the various companies making powder coatings, the quality of the coating has suffered and the industry is ripe for another round of consolidations.Edward W. Bourguignon is president of Posintel, Inc. You can reach him at 216/249.6756, or by e-mail ebourguignon@sbcglobal.net.
Looking for a reprint of this article?
From high-res PDFs to custom plaques, order your copy today!


