Is There a Doctor in the House?
Previously,1 we saw how Dr. Scientist used factorial design to optimize the manufacturing process of POLYGLOP 123 to increase the yield from 65% to 95% and save the company. In this article, we will learn how Dr. Scientist used mixture statistics to save the day when a production batch was mischarged.
My Batch is Ruined
Dr. Scientist was sitting in his office when Mr. QAL stormed in. Mr. QAL steamed, "You know that we formulate POLYGLOP 123 with three other ingredients to make our final product. I have a batch of formulated POLYGLOP 123 in the blend tank. It is off spec and I don't know how to fix it. In previous batches we sometimes had to make five, six and even 10 corrective additions to get a batch into spec."Dr. Scientist asked, "Tell me again what is in the formulated POLYGLOP 123?"
Mr. QAL sighed, "We blend POLYGLOP 123, another resin, an anti-oxidant and a plasticizer in a ratio of 40:20:15:25. The batch size is 40,000 lb and uses 400-lb drums of raw materials. This should be easy since that means we need to add 40 drums of POLYGLOP 123, 20 drums of resin, 15 drums of additive and 25 drums of plasticizer. But somebody must not know how to count because we always seem to add one drum too many or too few - sometimes of one ingredient, sometimes of another. In addition, the additive and plasticizer are somewhat volatile. Depending on when the operators take their break, some of these materials are lost through the piping, so we don't know what we have in the reactor."
"Can't the operators count the drums before and after the addition?" asked Dr. Scientist.
"One would think so," explained Mr. QAL, "but the loading area is so small that only about five drums are present at one time. Empty drums are replaced with full drums as quickly as the materials are transferred to the blend tank. The empty drums are put on the shipping platform. Unless someone takes the trouble to mark which drums are used, the count is inaccurate. "Can you help me?" pleaded Mr. QAL.
Dr. Scientist thought, and then replied, "I think that I have the answer. What we need to know is how the chemical and physical properties change as the formulation ratio is changed. Then we can evaluate the properties of the mischarged batch to determine what is in the kettle. Once we know the ingredient ratio in the mischarged batch, we can calculate a doctor charge correction."
Mixture Statistics to the Rescue
Mr. QAL looked confused, so Dr. Scientist explained. "Mixture statistics2 can help us determine the response surface for the formulated POLYGLOP 123. When studying a mixture where the ingredients add to 100%, a special, no-intercept, regression equation is required. For example, the quadratic equation for three ingredients is as follows."Property = c1X1 + c2X2 + c3X3 + c12X1X2 + c13X1X3 + c23X2X3 (1)
"The first-order components of the equation are the terms like X1, while the second-order components are the terms like X1X2. A quadratic equation can be used for most regressions, but higher-order terms like X1X2X3 can be added if needed."
"But POLYGLOP 123 has four ingredients," Mr. QAL interrupted.
"Yes, I know," said Dr. Scientist. "The equation can be modified to handle as many ingredients as necessary, but it is easier to explain if I stick with three for now. We start by doing some lab work to define the response surface."
Mixture Design Methodology
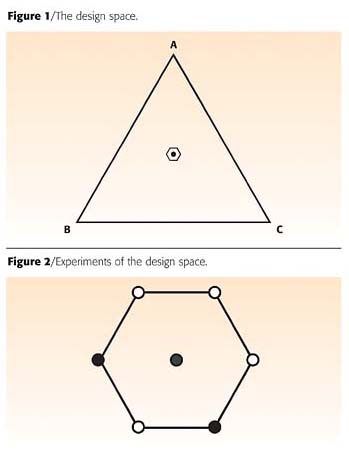
Dr. Scientist continued, "Let's assume that a formulation has three ingredients - A, B and C - in a ratio of 40:30:30. We assume that the formulation can be varied a little bit, possibly plus or minus 0.5% in any ingredient, without destroying its utility. The specifications are set at the limits of this variability. If the batch is mischarged at, say, one-drum in 30, this would be >3% error and would put the batch out of specification. To get the response surfaces, we will vary the ingredients over a wider range than our one-drum error, say plus or minus 5% absolute. The design range would then be as in Table 1.""The design space is a hexagon and can be graphed in a triangle plot, where the target formulation is shown as the center of the design space (Figure 1)." Dr. Scientist explained, "Let's assume that over the small design space we will have a linear response surface. We would hypothesize a first-order mixture equation like the following."
Property = c1X1 + c2X2 + c3X3 (2)
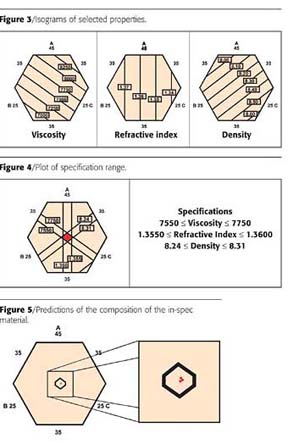
Dr Scientist continued, "For this first-order mixture equation, we will have to run one experiment for each of the coefficients, or three; we'll run four experiments for lack-of-fit analysis to make sure we don't have a higher-order response; and we'll run four replicates for experimental error. We can use a statistical software package to choose the right experiments for this design space. The experiments are shown in Figure 2."
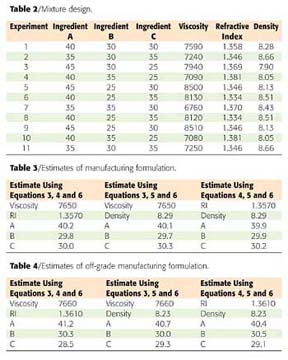
"The closed circles represent single experiments, and the open circles represent two replicate experiments. Of course we would randomize the order of the experiments. The formulations for the experiments and hypothetical values for viscosity, refractive index (RI) and density are shown in Table 2."
"The data are analyzed to generate the predictive equations. The viscosity is best transformed with a logarithm function. Good correlations were found for each of the three responses.
Log10(Viscosity) = 4.30 * A + 3.3 * B + 3.9 * C (3)
Refractive Index = 1.354 * A + 1.596 * B + 1.124 * C (4)
Density = 5.1 * A + 8.1 * B + 12.7 * C (5)
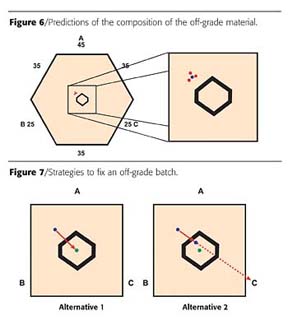
"Finally, the response surfaces can be plotted (Figure 3)."
Dr. Scientist continued, "On the next graph I have overlaid the isograms for each of the specification tests. I have drawn a red hexagon at the intersection of the isograms, which represents the region in which the formulations would meet our specifications (Figure 4).
Calculating the Formulation Composition
"Let's say we have a batch of formulated material that is in specification. When the batch is complete, the three measurements are determined - for example, viscosity is 7550; RI is 1.3570: and density is 8.29. Any two of these can be used to calculate the composition using simultaneous equations. Let's start with the viscosity and RI equations, 3 and 4, and then make use of the fact that all the ingredients have to add to 1 (Equation 6).A + B + C = 1 (6a)
or C = 1 - A - B (6b)
"When we do the calculation, A = 40.2, B = 29.8 and C = 30.0. Since an additional test was done, we can use all the tests - two at a time - to get independent estimates of the composition. In the in-spec example, we would additionally use equations 3, 5 and 6; and equations 4, 5 and 6. The results of the calculations are summarized in Table 3."
"Because of experimental errors and biases inherent in the tests, the three estimates will likely not be identical. The results can be plotted as is shown in the following expanded graph of the specification region (Figure 5). "The best estimate of what is in the reactor is the average of the three estimates: A = 40.0; B = 29.8; and C = 30.2."
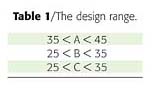
Dr. Scientist continued, "Now let's see what would happen with a mischarged batch. Let's say that viscosity is 7660; RI is 1.3610; and density is 8.23. Viscosity is in spec, but RI and density are not. We would do the same calculations as before using the new set of data and equations 3, 4 and 6; equations 3, 5 and 6; and equations 4, 5 and 6. The results are shown in Table 4."
"The results of each of the calculations (red dots) and the average of the three - A = 40.7; B = 30.3; and C = 29.0 (blue dot) as the best estimate of the composition in the kettle æ can be plotted as is shown in the expanded graph of the specification region (Figure 6).
Fixing the Bad Batch
Mr. QAL observed, "OK. I follow what you have said so far. If I know what I have and what I want, I should be able to calculate a corrective doctor charge. Can you help calculate what kind and how much of a correction charge needs to be added?"Dr. Scientist resumed, "The goal is to charge additional ingredients such that the batch composition is altered to be in spec. Several strategies are available for calculating this charge. Two are illustrated in Figure 7.
"One alternative would be to add additional material so that the batch ends up at the center of the specification. The calculation of the doctor charge is complicated and could mean adding a large quantity of several of the raw materials. Another alternative would be to add just enough material, so that the batch would just be in spec. Best would be if we could add just one ingredient as shown in Alternative 2, where only ingredient C would be added."
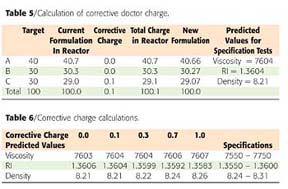
Dr. Scientist continued, "So the information we would need is the current composition and also the target composition. We have the first already, so we need to decide on the target. We can do this with an iterative approach using spreadsheet software (Table 5).
"The second column of Table 5 shows the composition at the middle of the spec. The third column shows the composition of the material in the reactor. Since Ingredient C is low, we would add some amount of that. The fourth column shows that we would add 0.1 part of C per hundred parts of formulation. The fifth column now shows the ratios of ingredients in the reactor after the doctor charge; and the sixth column is the fifth column normalized back to 100. The final column shows the calculated properties of the new mixture.
"To determine how much of C we would need to add would require the addition of various amounts of C (hypothetically) until the batch was within the specification range. The results of the calculations for various hypothetical additions are shown in Table 6.
"The calculations show that an addition of 0.7 parts of C for every 100 parts in the reactor would make the batch just meet all the specs. We might want to add a bit more so that we would be well within the specification limits, since experimental error is operating. Of course we could add the 0.7 parts of C and retest, recalculate and charge additional material, if necessary."
A Happy Conclusion
Dr. Scientist added, "I've shown you how to do this iteratively, but I bet one of the engineers could figure out the algebra to do the calculation directly. Then they could write a simple computer routine to do the calculation."Our example had three ingredients and required two analyses. Formulated POLYGLOP 123 has four ingredients, so you will need three analyses. Just remember the predictions and calculations need n-1 tests for n ingredients. More tests would be beneficial to improve the estimate. Otherwise the principle is the same."
Mr. QAL was impressed. "Boy, this algorithm will really help us cut down on all the corrective charging. I can see where we might be able to get by on just one corrective charge, or maybe two at the most. I'm going to put your name in the hat for a Quality Improvement Award."
References
1 Paint and Coatings Industry "deSigns of the Times: Or, A Modern American Fable," October, 2000.2 Paint and Coatings Industry "deSigns of the Times: How to Bake the Perfect Cake," July, 2004.
Looking for a reprint of this article?
From high-res PDFs to custom plaques, order your copy today!


