Thermal Profiling: Is My Coating Really Cured?
Product cure quality and consistency are of primary importance to custom coaters and in-house coating lines alike. Various factors can affect the quality of cure, including peak temperature, time at temperature or the rate of temperature change. Conditions can change within a curing oven, and that same oven’s performance can alter over time.

Product cure quality and consistency are of primary importance to custom coaters and in-house coating lines alike. Various factors can affect the quality of cure, including peak temperature, time at temperature or the rate of temperature change. Conditions can change within a curing oven, and that same oven’s performance can alter over time.
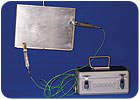
Physical testing is a traditional method of proving quality, but it highlights problems only after the product has been cured. Many companies are instead turning to temperature profiling to verify cure quality using a temperature profiling system composed of a data logger, thermal barrier, thermocouples and analysis software (see Figure 1). These systems travel with the product throughout the entire process, measuring selected product and air temperatures. Obtaining a comprehensive temperature history of the product for the length of the process is essential to prove that the optimum cure schedule is maintained. The advantages of such a system include confirmation of cure, identification of oven fluctuation, and predicting future oven performance to correct problems before they occur.

Modern temperature profiling systems can confirm that all products follow the required cure schedule and therefore can help guarantee coating quality. They can also prove that the cure process is being performed in a controlled, repeatable fashion from day to day. Some systems incorporate statistical process control (SPC) functionality that identifies possible future problems and allows preventive actions to be taken at the plant’s convenience. They obtain the profile information necessary for developing new cure processes accurately and efficiently, and they eliminate rejects or rework, thereby maximizing product throughput and minimizing scrap costs.
Plants with modern temperature profiling systems can use the profile data to understand and optimize the operating characteristics of any cure process by increasing line speeds and/or lowering temperatures. Such changes can often increase product throughput or reduce operating costs by minimizing labor and fuel requirements. When problems occur, plants can identify the cause and location of the problem promptly, use the profile information to determine the necessary corrective actions, and then prove the success of such actions with additional profile runs. Plants can also archive fully traceable and certified temperature profile data and create hard copy reports to prove to management, customers, coating suppliers or other regulatory bodies that their process complies with formal operating standards (e.g., accredited applicator status or ISO certification).
Direct profiling temperature measurements are taken directly from a standard coated product as it passes through the normal production cure process. This technique is frequently used when it is too expensive to use a test piece and when thermocouples can be applied to the product without causing damage to the surface coating. As the method implies, thermocouples must be applied quickly and repeatably on a moving conveyorized line.
Indirect profiling uses a test piece designed to imitate a standard coated product (see Figure 2). The test piece is inserted during the normal production run and is used repeatedly for profiling day after day. This method helps reduce expensive scrap in cases where direct attachment of probes would cause coating damage.
Some of the newest temperature profiling systems incorporate an SPC feature that analyzes archived profiles without the cumbersome need to export data to other programs. Since this software function is wizard-driven, it is easy for finishing professionals to use. On-screen directions guide the user through the temperature profile, analysis and selection of limits. Many finishing operations first design test protocols (standard operating procedures, or SOPs) to guarantee the consistency of the data and then file their analyses in a separate folder for each process, product or oven. The SPC function can be applied to any of the standard temperature analyses, including peak temperature, time at temperature and index of cure.
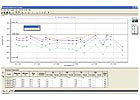
 This function can also compare reported data to data limits or target values. The software asks the user to enter these values, which are added to the SPC chart. Raw analysis data and the target values are both graphically displayed, making it easy to spot whether the process data is within specification (see Figure 3).
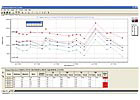
SPC results can be printed or e-mailed in a report showing both graphical and numeric SPC data, along with a list of the files that comprise the report (see Figure 4). Data can also be exported to other applications for custom reports or other data manipulation.
SPC with indirect profiling not only immediately identifies when a process goes out of tolerance, but it is also an ideal way of proving quality control to customers for an oven cure operation over a period of time. Common profiling errors are eliminated because the system is set up on a test piece that is used repeatedly. And it provides the information needed to prevent problems before they occur, saving time and money while keeping productivity high.
Product cure quality and consistency are of primary importance to custom coaters and in-house coating lines alike. Various factors can affect the quality of cure, including peak temperature, time at temperature or the rate of temperature change. Conditions can change within a curing oven, and that same oven’s performance can alter over time.
Physical testing is a traditional method of proving quality, but it highlights problems only after the product has been cured. Many companies are instead turning to temperature profiling to verify cure quality using a temperature profiling system composed of a data logger, thermal barrier, thermocouples and analysis software (see Figure 1). These systems travel with the product throughout the entire process, measuring selected product and air temperatures. Obtaining a comprehensive temperature history of the product for the length of the process is essential to prove that the optimum cure schedule is maintained. The advantages of such a system include confirmation of cure, identification of oven fluctuation, and predicting future oven performance to correct problems before they occur.
Figure 1. A profile graph generated by the data logger provides evidence as to the success or failure of the cure against the coating supplier’s specifications.
Modern Temperature Profiling
Finishing professionals have found temperature profiling to be a convenient way of documenting product coating quality. Current software analysis packages have the ability to gather and analyze data in new ways and provide manufacturers with more than just quality assurance. This information is now helping finishing operations improve their operating efficiency, as well as their understanding and control of thermal cure processes.Modern temperature profiling systems can confirm that all products follow the required cure schedule and therefore can help guarantee coating quality. They can also prove that the cure process is being performed in a controlled, repeatable fashion from day to day. Some systems incorporate statistical process control (SPC) functionality that identifies possible future problems and allows preventive actions to be taken at the plant’s convenience. They obtain the profile information necessary for developing new cure processes accurately and efficiently, and they eliminate rejects or rework, thereby maximizing product throughput and minimizing scrap costs.
Plants with modern temperature profiling systems can use the profile data to understand and optimize the operating characteristics of any cure process by increasing line speeds and/or lowering temperatures. Such changes can often increase product throughput or reduce operating costs by minimizing labor and fuel requirements. When problems occur, plants can identify the cause and location of the problem promptly, use the profile information to determine the necessary corrective actions, and then prove the success of such actions with additional profile runs. Plants can also archive fully traceable and certified temperature profile data and create hard copy reports to prove to management, customers, coating suppliers or other regulatory bodies that their process complies with formal operating standards (e.g., accredited applicator status or ISO certification).
Figure 2. Indirect profiling on a test piece used to represent the production item.
Direct vs. Indirect Profiling
While temperature profiling offers numerous benefits, analysis information is only as good as the data obtained. Often, profiling mistakes result because operators aren’t measuring what they think they are measuring. To obtain meaningful data, careful consideration must be given to the way in which the profile run is performed. And to confirm process control over time, the profile run must be performed in the same way every time.Direct profiling temperature measurements are taken directly from a standard coated product as it passes through the normal production cure process. This technique is frequently used when it is too expensive to use a test piece and when thermocouples can be applied to the product without causing damage to the surface coating. As the method implies, thermocouples must be applied quickly and repeatably on a moving conveyorized line.
Indirect profiling uses a test piece designed to imitate a standard coated product (see Figure 2). The test piece is inserted during the normal production run and is used repeatedly for profiling day after day. This method helps reduce expensive scrap in cases where direct attachment of probes would cause coating damage.
Figure 3. SPC analysis of one month of maximum temperature profile data using Datapaq's Insight software. The data are presented graphically and numerically, calculating SPC criteria such as Cp, Cpk, Pp and Ppk. Such data allows process control to be quantified.
Statistical Process Control
Indirect profiling reduces operator error, retains original thermocouple placements and ensures that test conditions are consistent from run to run. With this consistency, SPC analysis can be applied to the quality assurance data that has been collected over time.Some of the newest temperature profiling systems incorporate an SPC feature that analyzes archived profiles without the cumbersome need to export data to other programs. Since this software function is wizard-driven, it is easy for finishing professionals to use. On-screen directions guide the user through the temperature profile, analysis and selection of limits. Many finishing operations first design test protocols (standard operating procedures, or SOPs) to guarantee the consistency of the data and then file their analyses in a separate folder for each process, product or oven. The SPC function can be applied to any of the standard temperature analyses, including peak temperature, time at temperature and index of cure.
Figure 4. A print-out of a custom SPC report providing both graphical and numerical data. Red clearly highlights data out of tolerance.
SPC results can be printed or e-mailed in a report showing both graphical and numeric SPC data, along with a list of the files that comprise the report (see Figure 4). Data can also be exported to other applications for custom reports or other data manipulation.
SPC with indirect profiling not only immediately identifies when a process goes out of tolerance, but it is also an ideal way of proving quality control to customers for an oven cure operation over a period of time. Common profiling errors are eliminated because the system is set up on a test piece that is used repeatedly. And it provides the information needed to prevent problems before they occur, saving time and money while keeping productivity high.
Links
Looking for a reprint of this article?
From high-res PDFs to custom plaques, order your copy today!


