Asian Demand Triggers Mixed Pricing Signals Worldwide
As the new year begins, the TiO2 industry worldwide is encountering difficulties and challenges short term, although there are some signs of hope. The trade wars, the potential of recession in the European economy, and political tensions in the Middle East are showing up in trade statistics, and they directly relate to TiO2 demand.
Because TiO2 consumption closely links to GDP, TiO2 demand reflects relative changes in growth. Today, we are seeing mixed demand signals throughout the world, but they very closely follow economic conditions. A major concern is that the slowness in Europe will prolong destocking and pressure pricing down further.
Recovery in China and other parts of Asia contributes significantly to destock progress as well. Things appear different in the Americas because the stronger economy in the United States and the beginnings of recovery in Brazil support growth in demand.
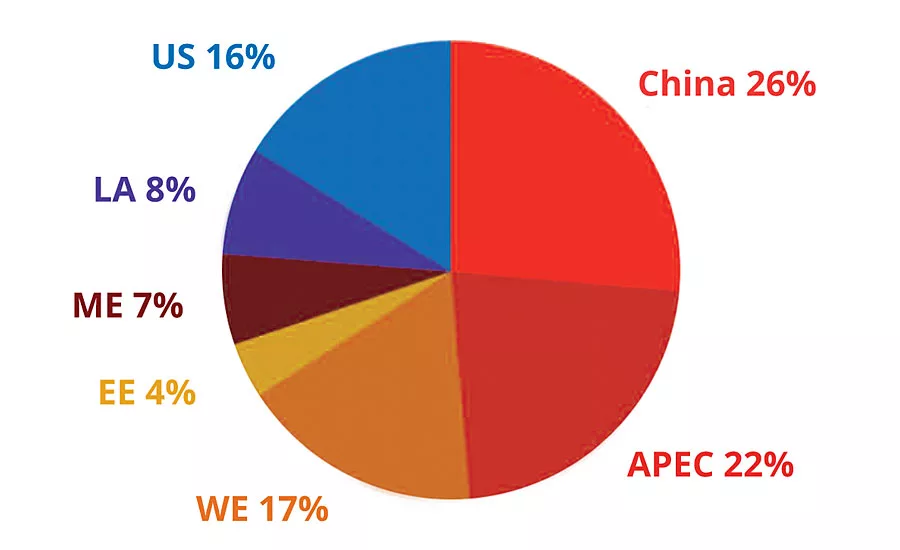
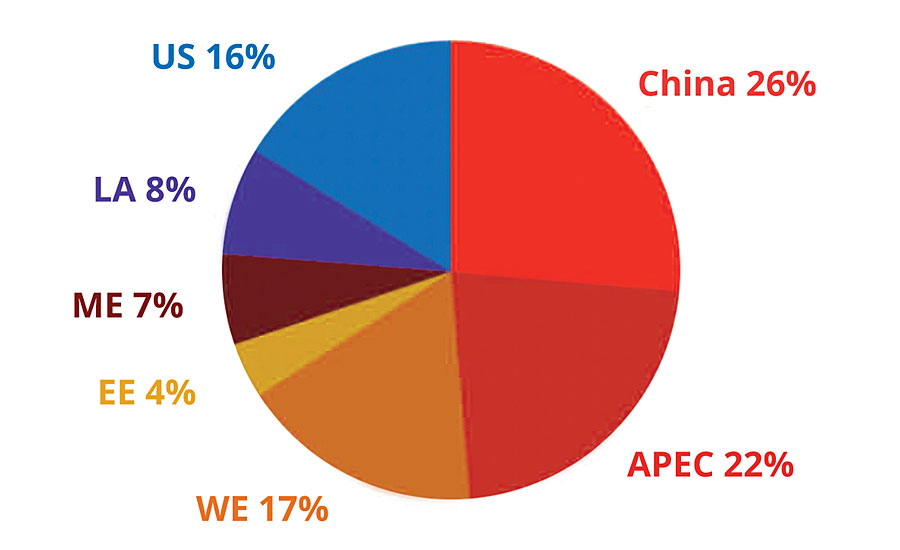
Without question, Asia represents the biggest impact on the TiO2 demand. Figure 1 illustrates the impact of Asia as a region on overall demand growth. Because nearly 50% of TiO2 demand is within Asia, the effects of its growth are nearly equivalent to the impact from the Americas and EMEA combined.
Many consider TiO2 a leading indicator of economic patterns. Import statistics tell an interesting story regardiing Asian demand. Outside China, import data indicate nearly flat demand growth with the exception of India. In addition, trade tensions are leading to overall economic concerns throughout much of Asia.
According to World Bank statistics, most economies peaked in terms of year over year growth in 3Q 2017, coinciding with TiO2 demand peaking throughout most of the world. As most economies outside the United States began to experience slower growth, demand for TiO2 slowed (Figures 2-3).
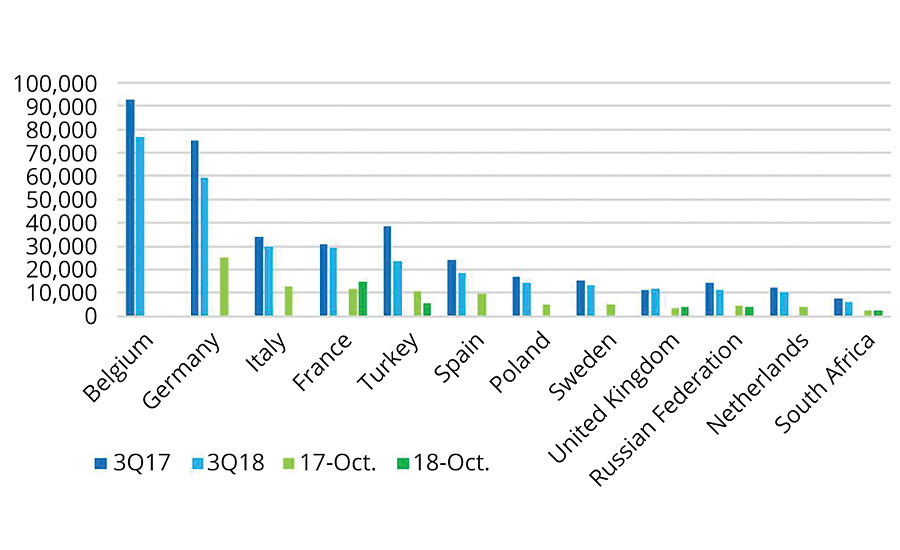
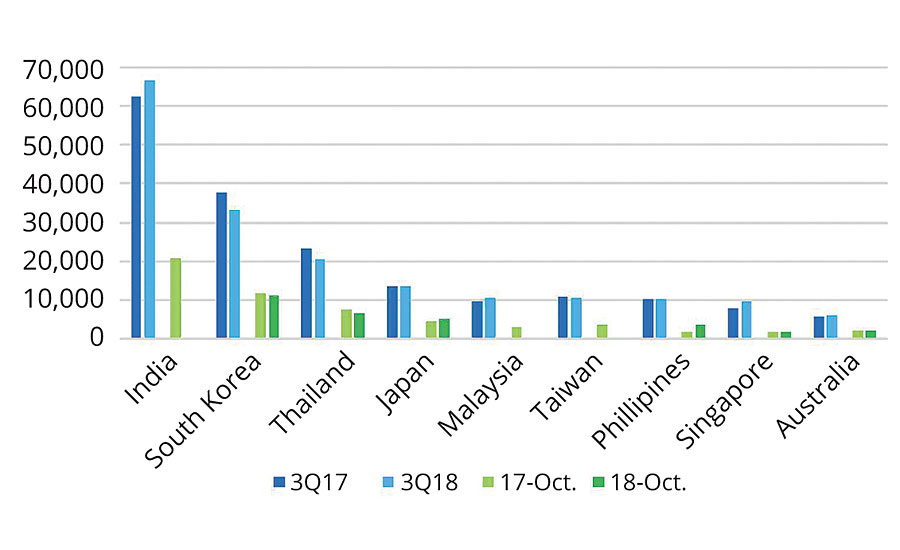
TiPMC estimates that demand growth slowed in 2018, decreasing approximately 1-2%. China showed some signs of strengthening in that production was strong during 2H 2018, yet, net exports were slightly down.
When trade tensions ease and the Chinese economic stimulus begins to make a meaningfully impact on its economy, the return of demand growth in Asia will contribute to restoring TiO2 demand growth.
Most estimates for yearly architectural coatings growth in Asia are in the 5.5-6% range for the next five years. Because Asia is the largest TiO2-consuming coatings segment, this is very good news for the TiO2 industry. The challenge appears to be getting back on track in the short term. n
To subscribe to TiPMC industry reports and forecasts, see our ad in this issue or visit www.TiPMCconsulting.com.
Looking for a reprint of this article?
From high-res PDFs to custom plaques, order your copy today!


