Study of Surfactant Tail Variations, Part One

Davizro / iStock / Getty Images Plus, via Getty Images.
Stabilizing pigments in water-based paint systems is a complex process that requires a highly robust pigment dispersion due to the need for compatibility in different coatings systems. In this month’s column we will evaluate the development of surfactant molecules for use as a carbon black pigment dispersant. To determine the best conditions for stabilization, compatibility and performance of the pigment dispersion, variations in the size of the polymeric chain that make up the tail of the surfactant were made and tested. In next month’s column we will finish this up by evaluating the effect of the amount of the dispersant in the formulation of the pigment concentrate, and data will be presented. I would like to thank Alann de O.P. Bragatto, Brandon L. da Silva, and Fabrício G. Pereira for generating the data for this and next month’s articles.
Carbon black is one of the most difficult pigments to disperse and stabilize in water. This is due to its highly hydrophobic character, with a composition of 90 to 99% elemental carbon. The primary particles tend to aggregate when the pigment is added to water, so a dispersant is needed to stabilize it. The choice of a suitable dispersant is essential to provide an optimized dispersion of the pigment in water, to minimize process time and energy costs. It will also maximize the pigment content in the formulation and ensure the stability of the pigment concentrate.
Simplified, the pigment dispersion process involves:
1. Wetting the solid surface of the pigment.
2. The physical separation of the pigment agglomerates during the dispersion and milling process.
3. The stabilization of the pigments. Smaller particles generated are stabilized to avoid re-agglomeration.
The choice of a suitable surfactant or surfactant system for pigment dispersion must consider its ability to reduce the surface tension during step 1 in order to facilitate the wetting of the pigment by water. It also must have the ability of its affinic group to adsorb onto the surface of the pigment quickly during step 2 in order to avoid the re-agglomeration of the smaller particles generated. Finally, the polymeric chain (tail) size must be long enough to provide stabilization of the pigment particles but not harm the balance of intermolecular forces and reduce the adsorption of the affinic group on the pigment during stage 3 of stabilization.
This work focuses on the evaluation of surfactant tail size variations on the performance properties of a carbon black pigment dispersion. Surfactants with different degrees of ethoxylation are evaluated. For the best performing surfactant, with optimized polymeric tail size, a study of the impact of the concentration used in the formulation of the pigment concentrate on the performance properties is presented in order to obtain maximum efficiency in terms of color development and stability.
Keeping the affinic hydrophobic group fixed, four different non-ionic surfactants were evaluated with different degrees of ethoxylation. 16, 18, 25 and 54 moles of ethoxylation were tested and identified as Surfactant 16, 18, 25 and 54, respectively. For the formulation of the pigment concentrates, a larger particle size carbon black designed for tint strength was used. To evaluate the performance of the formulated pigment concentrates, a standard commercial flat paint was used as a white tinting base.
For the physicochemical characterization of the surfactants, the surface tension versus log concentration curves were determined using a force tensiometer. The dispersion and milling of the pigment to prepare the concentrates was carried out using a high-speed disperser with a thermostat bath, in a total process period of 1 hour, with 30 minutes of dispersion and 30 minutes of grinding. The formulation used in the preparation of pigment concentrates is illustrated in Table 1.
TABLE 1 ǀ Formulation of prepared pigment concentrates. The dispersant concentration varies according to the actives content and the SOP (Solids on Pigment, also known as dispersant active on pigment solids) concentration determined for each surfactant.
The viscosity values of the pigment concentrates were determined in a spindle viscometer, and the particle size evaluations were performed. The tinting of the white base was carried out using a shaker. Tint strength was carried out using 2.0% of the pigment concentrate on the white base by weight. The paint and base were mixed for two 3-minute cycles. For determination of tinting power and rub-out evaluation, a spectrophotometer was used.
Surface tension curves as a function of dispersant concentration were constructed for all surfactants using an internal procedure. The surface tension values obtained, as well as the physicochemical parameters calculated from the curve obtained, are shown in Table 2.
TABLE 2 ǀ Surface tension, surface excess (Γ), area occupied by the molecule (As), adsorption free energy (∆Gads) and adsorption free energy per area (Γ∆Gads).
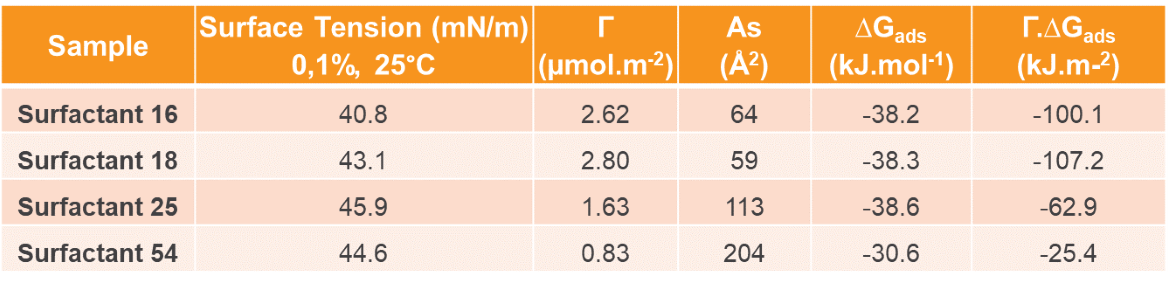
Figure 1 illustrates the curves of viscosity versus dispersant actives concentration over pigment solids content (SOP concentration) for the samples evaluated. As can be seen from the graph, Surfactant 18 showed a reduction in system viscosity at lower concentrations (8.0 – 10.0% SOP), while the other samples showed a reduction in viscosity at higher concentration levels (10.0 – 12.0% SOP). Among the surfactants, Surfactant 54 has higher viscosity levels and a lower working range, with a significant increase in viscosity being observed at the SOP concentration of 18.0%. Surfactants 16, 18 and 25 have similar viscosity levels at different SOP concentrations and similar working ranges, with a significant increase in viscosity starting at a concentration of 20.0% SOP. All samples of have the lowest viscosity at a concentration of 12.0% SOP.
FIGURE 1 ǀ Brookfield viscosity versus dispersant SOP concentration curves for the different surfactants evaluated.
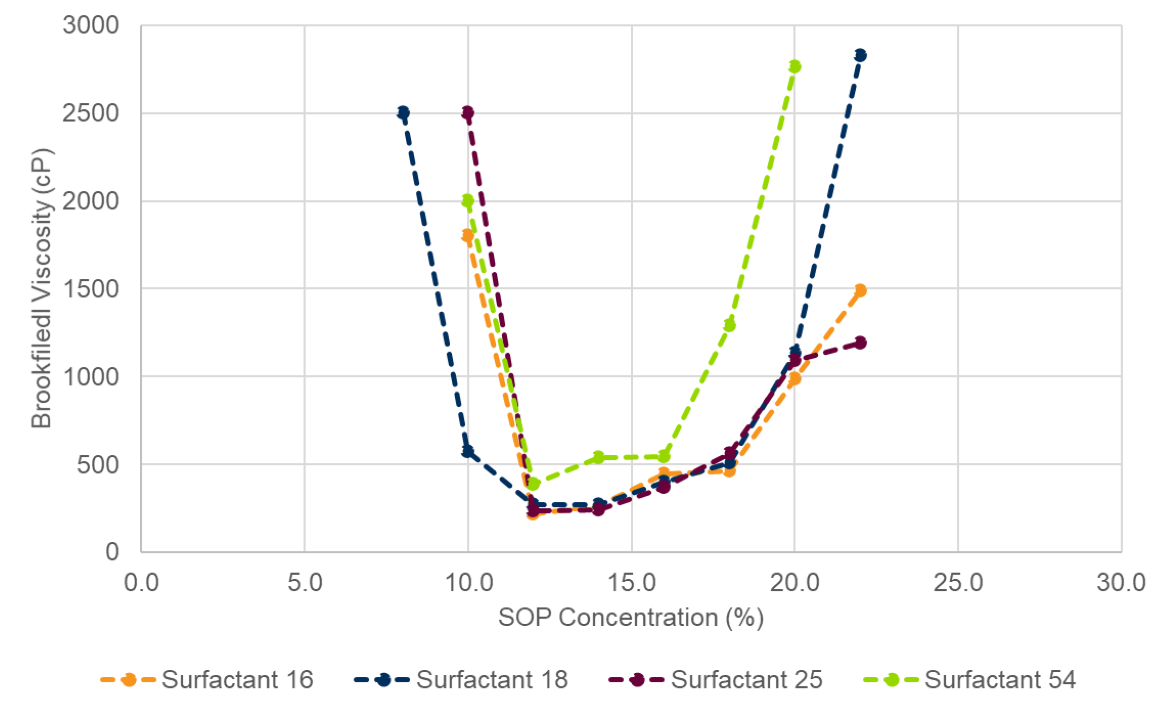
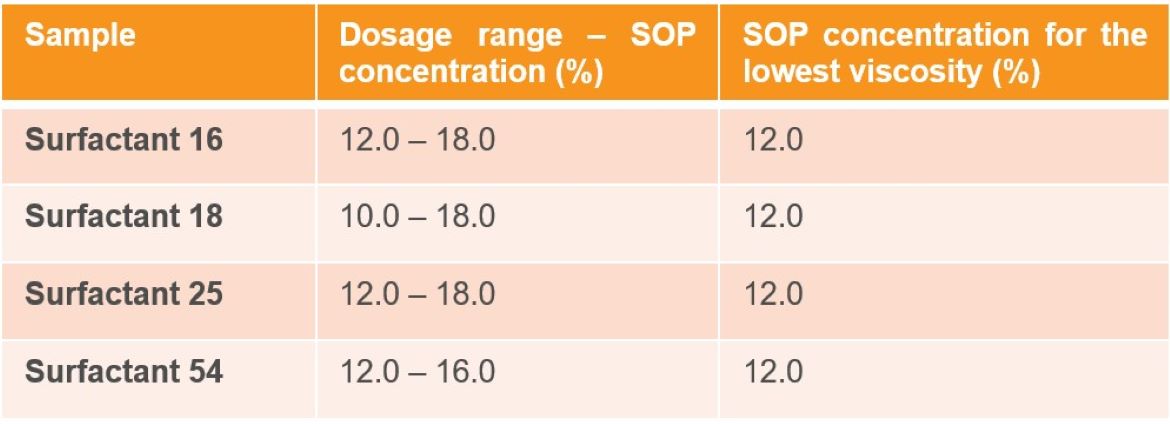
Table 3 presents a summary of the working ranges of each surfactant, corresponding to the ranges of SOP concentrations in which a viscosity at lower levels is observed, as well as the SOP concentration of each surfactant in which the lowest viscosity value is observed, in theory, corresponding to the optimal concentration of dispersant for the system under study.
TABLE 3 ǀ SOP concentration ranges determined for the different surfactants and SOP concentration equivalent to the lowest observed viscosity value.
Pigment concentrates were prepared, following the formulation described in Table 1 using the optimal dispersant concentrations determined, as indicated in Table 3. Figure 2 shows the initial viscosity values, after 24 hours at room temperature (25 °C) and after thermal stability test (7 days at 52 °C/125 °F) of the prepared pigment concentrates.
FIGURE 2 ǀ Viscosity assessment – initial and after thermal stability test of pigment concentrates prepared with different dispersants.
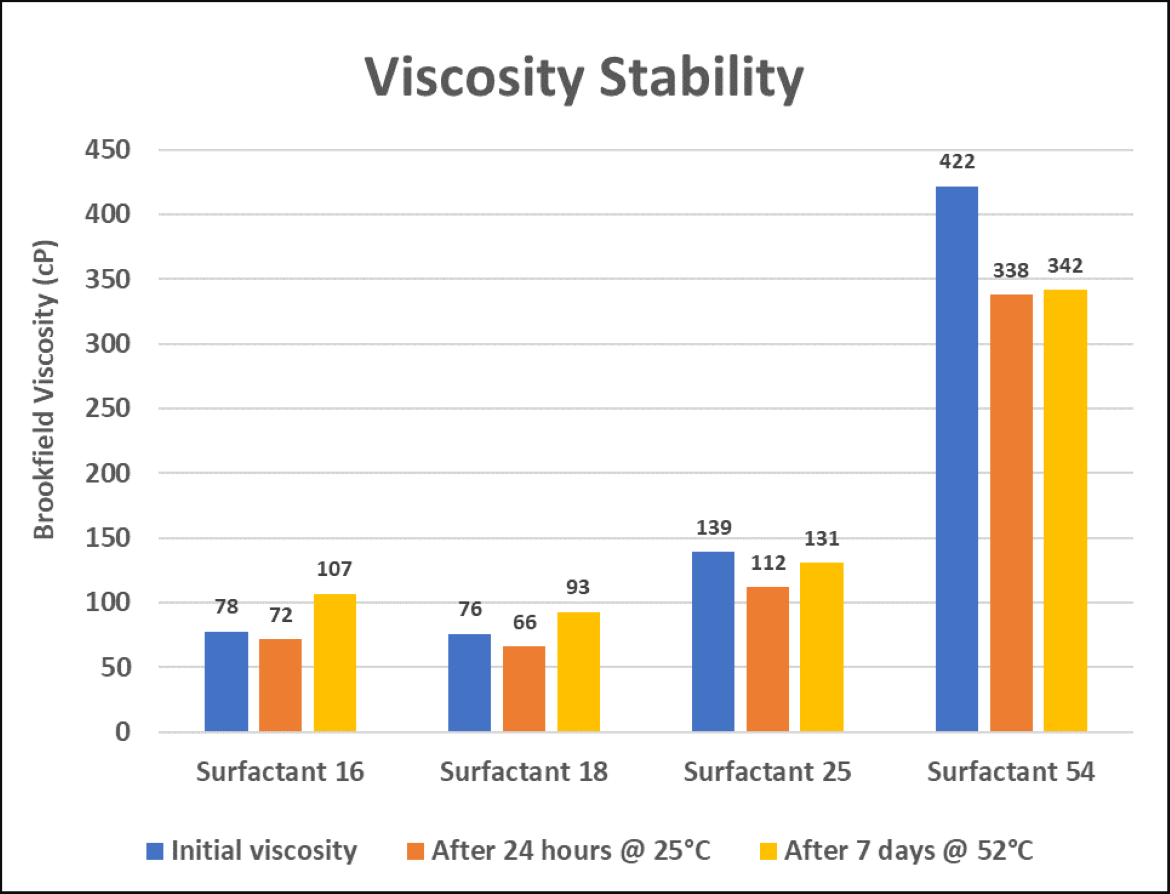
As can be seen from Figure 2, the pigment concentrates prepared with Surfactants 16 and 18 have the lowest initial viscosity values. As the degree of ethoxylation of the surfactants increases, an increase in the initial viscosity value is observed.
The higher viscosity levels observed for Surfactants 25 and 54 are associated with a worse distribution of the surfactant around the pigment particle. As the degree of ethoxylation increases, the greater the surface area occupied by the molecule and, consequently, the smaller the number of molecules that can adsorb on the pigment surface (see values of Γ and As in Table 2). The lower degree of adsorption of the surfactant molecule on the surface of the pigment particle consequently generates a lower degree of particle packing, contributing to the observation of higher viscosity levels. In addition, the increase in the polymer chain also makes the particles closer to each other, thus increasing the interaction between the particles and, consequently, increasing the observed viscosity.
For all samples, consistent viscosity levels are observed after the thermal stability test. The maintenance of the viscosity ranges indicates a good stability of the pigment concentrates, with no flocculation or phase separation observed in the systems.
Figure 3 presents the average particle size values obtained for the pigment concentrates formulated with the different surfactants in the initial condition and after the thermal stability test. No major differences are observed between the obtained particle sizes: in the initial condition, the average particle size varies between 159.4 nm (Surfactant 25) and 166.5 nm (Surfactant 54). There is also no significant increase in average particle size after the thermal stability test – the largest increase observed in absolute values was 8.8 nm for Surfactant 18, indicating that the prepared pigment concentrates have good thermal stability, the phenomenon of flocculation is not observed to a degree that impairs the performance of the pigment concentrate. The consistent viscosity levels after the thermal stability test, indicated in Figure 2, corroborates the good stability of the prepared pigment concentrates.
FIGURE 3 ǀ Average particle size for pigment concentrates prepared with different surfactants – before and after thermal stability test.
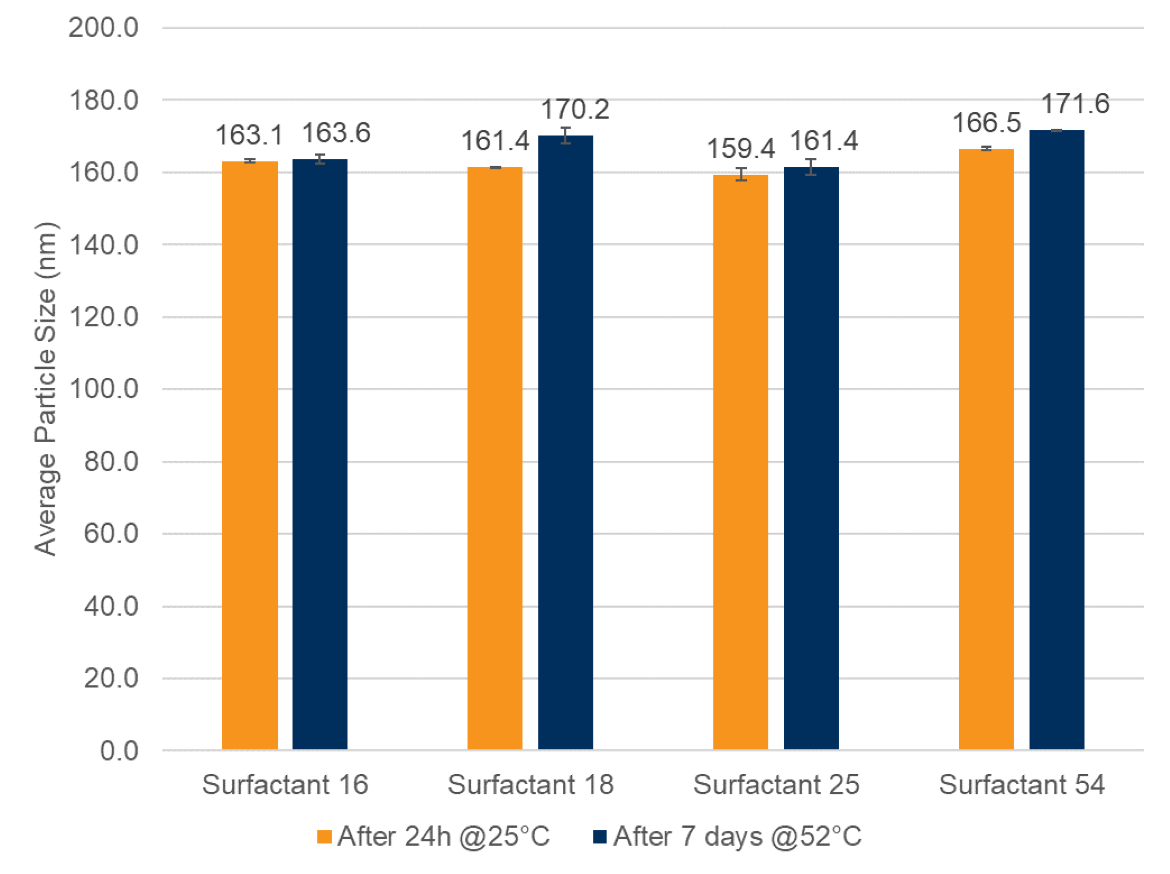
Figure 4 presents a comparison of the tinting power between the pigment concentrates prepared with the different surfactants, adopting the concentrate formulated with Surfactant 16 as the standard (100.0%). As can be seen from the analysis of the graph, Surfactant 18 is the one with the highest tinting power, with a decrease in tinting power being observed as the degree of ethoxylation of the surfactant increases. The first factor that could be associated with this difference would be the average particle size of the concentrate, however, as indicated in Figure 3, there is no significant difference between the average particle size values of the pigment concentrates prepared with the different surfactants.
FIGURE 4 ǀ Comparative evaluation of the initial tinting power of pigment concentrates prepared with different surfactants.
Another factor that may be related to the difference in tinting power observed in Figure 4 is the affinity of each surfactant for the pigment. Although all surfactants have the same affinic group for the pigment, the increase in the hydrophilic polymer chain can result in a decrease in the intermolecular forces of attraction between the affinic group and the pigment surface. This behavior is evidenced when the values of adsorption free energy per molecule area (Γ∆Gads) are analyzed, as indicated in Table 2, and illustrated in Figure 5.
FIGURE 5 ǀ Comparative evaluation of the initial tinting power of pigment concentrates prepared with different surfactants versus Γ∆Gads of the surfactants.
Evaluating the graph shown in Figure 5, the highest value of Γ∆Gads is observed for Surfactant 18 (107.2 kJ/m2), which indicates a greater interaction between the surfactant and the pigment surface for this degree of ethoxylation. This leads to an optimized balance between pigment-hydrophobic group intermolecular forces of the surfactant vs. water-hydrophilic polymer chain of the surfactant. This may be associated with the highest tint strength power observed among the surfactants. It is possible to observe that for higher degrees of ethoxylation, Surfactants 25 and 54, there is a decrease in the values of Γ∆Gads, indicating a decrease in the intermolecular forces of attraction between the pigment and the surfactant, accompanied by a decrease in the tint strength.
Figure 6 presents an evaluation of the initial tinting power of the pigment concentrates (after 24 hours of the manufacturing process) prepared with the different surfactants versus the tinting power of the pigment concentrate after the thermal stability test. In this case, for each sample, the initial value (100.0% for Surfactant 16 initial) is adopted and the value obtained after the stability test is compared to this.
FIGURE 6 ǀ Evaluation of initial and after thermal stability test tint strength of pigment concentrates prepared with different surfactants.
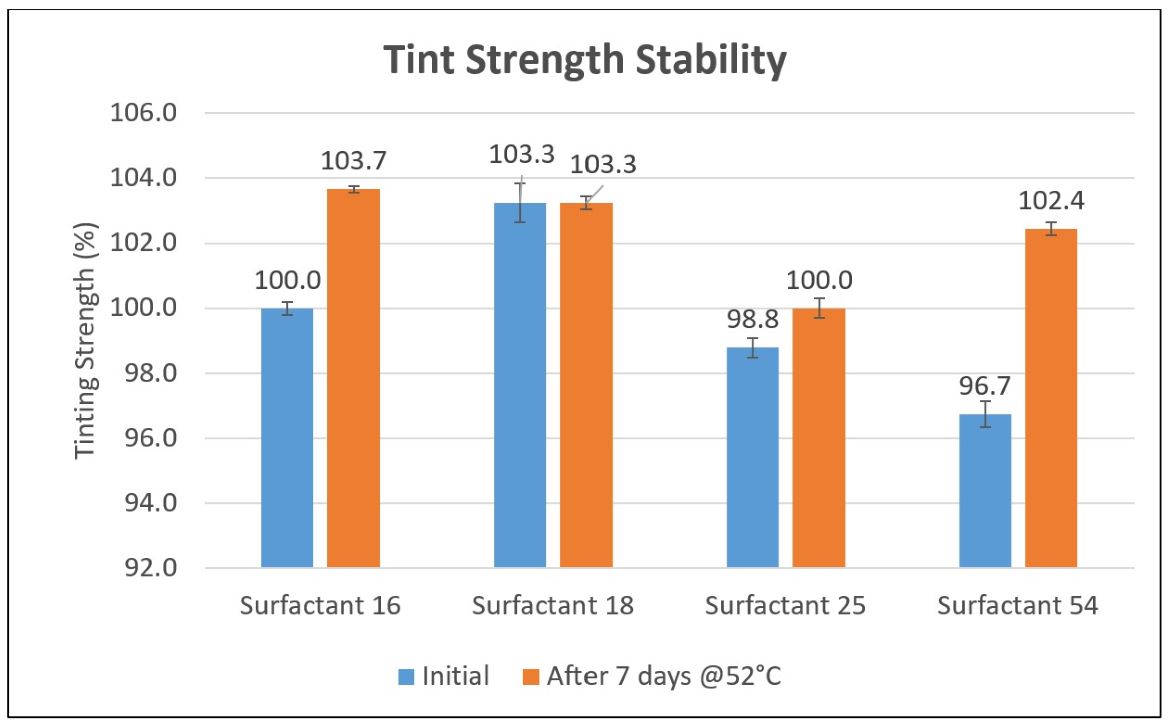
As can be seen in the graph of Figure 6, the pigment concentrate prepared with Surfactant 18 showed the smallest variation in tinting power after the thermal stability test, presenting a variation of only 0.1%. The pigment concentrates prepared with the other surfactants showed an increase in tinting power after the thermal stability test, with a variation from 1.0 to 5.8% being observed. This behavior has already been observed in other works with carbon black pigment dispersion and may be associated with a delayed wetting effect during the stability test, which leads to an improvement in the tinting power.
FIGURE 7 ǀ Rub out values before and after the thermal stability test for the pigment concentrates prepared with the different surfactants.

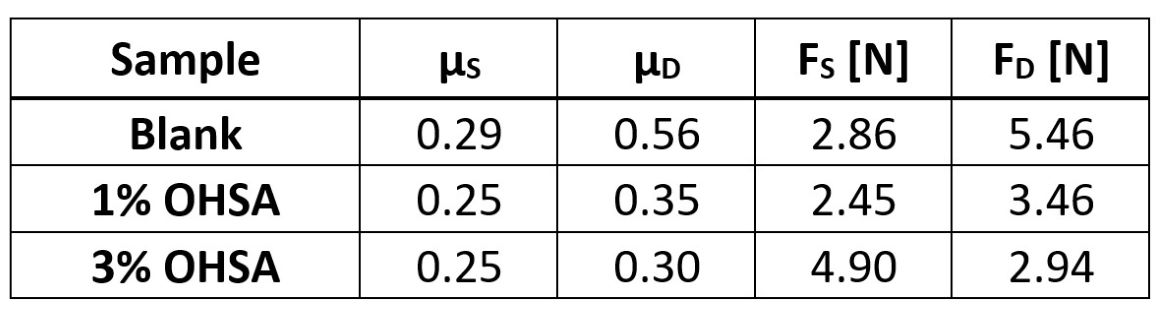
As can be seen from the graph in Figure 7, except for the pigment concentrate prepared with Surfactant 25, the other pigment concentrates present similar initial rub-out values, ranging between 0.68 and 0.79. It is observed that only the pigment concentrate prepared with Surfactant 16 shows an improvement in rub-out after the thermal stability test. Similar to what was explained in the above topic related to the stability of tinting power, one can think of the same reasoning of a delayed wetting process during the stability test considering that Surfactant 16, according to the values shown in Table 1, presents the better wetting properties due to the lower surface tension value.
On the other hand, Surfactant 18 is the one that presents, in absolute terms, the smallest rub-out variation, indicating once again the optimal balance between the intermolecular forces that contribute to the optimization of the pigment concentrate performance. For Surfactants 25 and 54, increments of rub-out values are observed, and the absolute value of variation is greater as the degree of ethoxylation increases, correlating with the values of Γ∆Gads, shown in Table 2 , similarly to what was explored in relation to tint strength.
In conclusion, varying the tail length of the surfactant will have a significant effect on the final properties of the pigment concentrate and coating. Optimizing the dispersant will lead to the best balance of properties. Next month we will look at how the amount of dispersant added will affect the pigment concentrate and the final film.
All information contained herein is provided "as is" without any warranties, express or implied, and under no circumstances shall the author or Indorama be liable for any damages of any nature whatsoever resulting from the use or reliance upon such information. Nothing contained in this publication should be construed as a license under any intellectual property right of any entity, or as a suggestion, recommendation, or authorization to take any action that would infringe any patent. The term "Indorama" is used herein for convenience only, and refers to Indorama Ventures Oxides LLC, its direct and indirect affiliates, and their employees, officers, and directors.
Looking for a reprint of this article?
From high-res PDFs to custom plaques, order your copy today!


