Study of Surfactant Tail Variations, Part 2
In last month’s column of “Formulating with Mike,” we discussed how varying the tail length (amount of ethoxylation) with a fixed hydrophobic head had an effect on properties of the pigment dispersion and the final tinted coating. In this month’s column, we will look at how the amount of actual dispersant added on pigment solids will have an effect on properties. I would like to thank Alann de O.P. Bragatto, Brandon L. da Silva, and Fabrício G. Pereira for generating the data for this article.
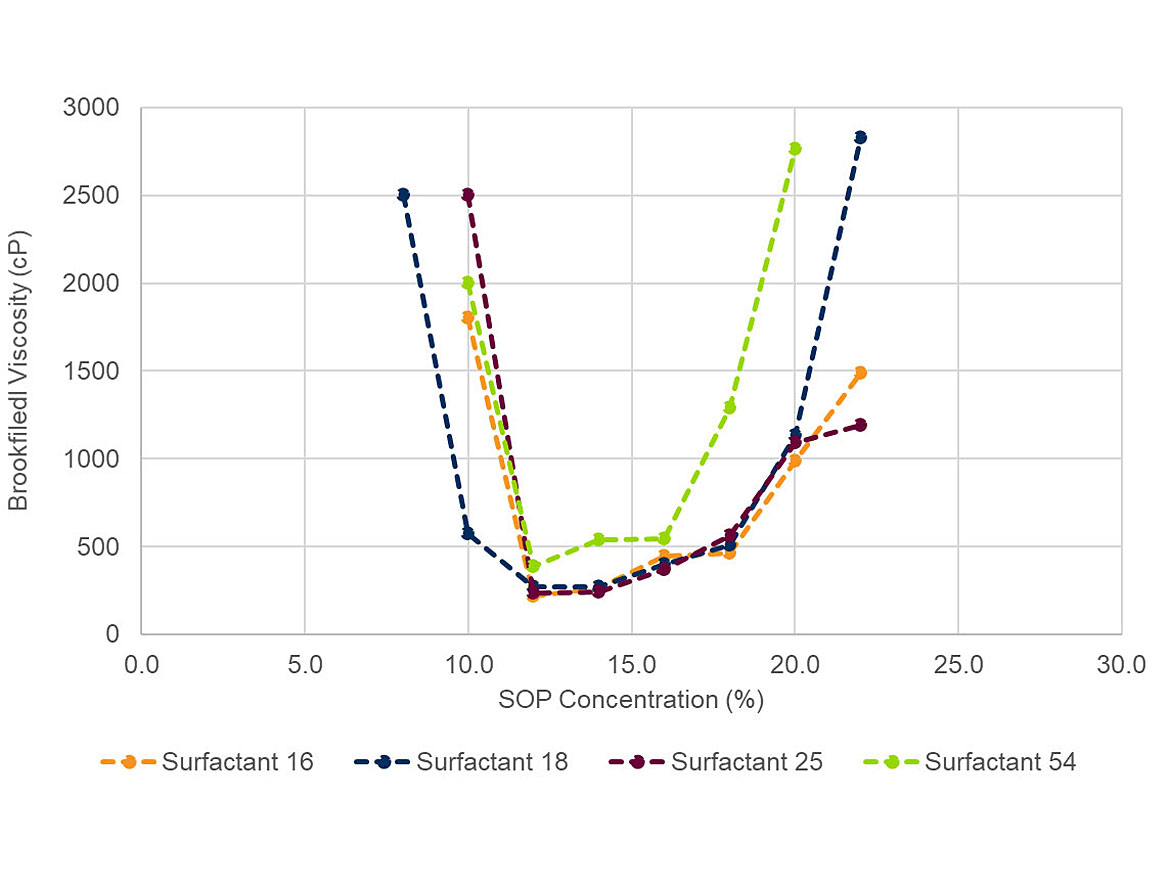
Last month, we kept the affinic hydrophobic group fixed, and four different non-ionic surfactants were evaluated with different degrees of ethoxylation. 16, 18, 25, and 54 moles of ethoxylation were tested and identified as surfactant 16, 18, 25, and 54, respectively. We determined that 18 moles of ethoxylation was optimum. This month we will test this dispersant at different levels. We prepared surfactant level versus viscosity graphs of the four dispersants as shown in Figure 1.
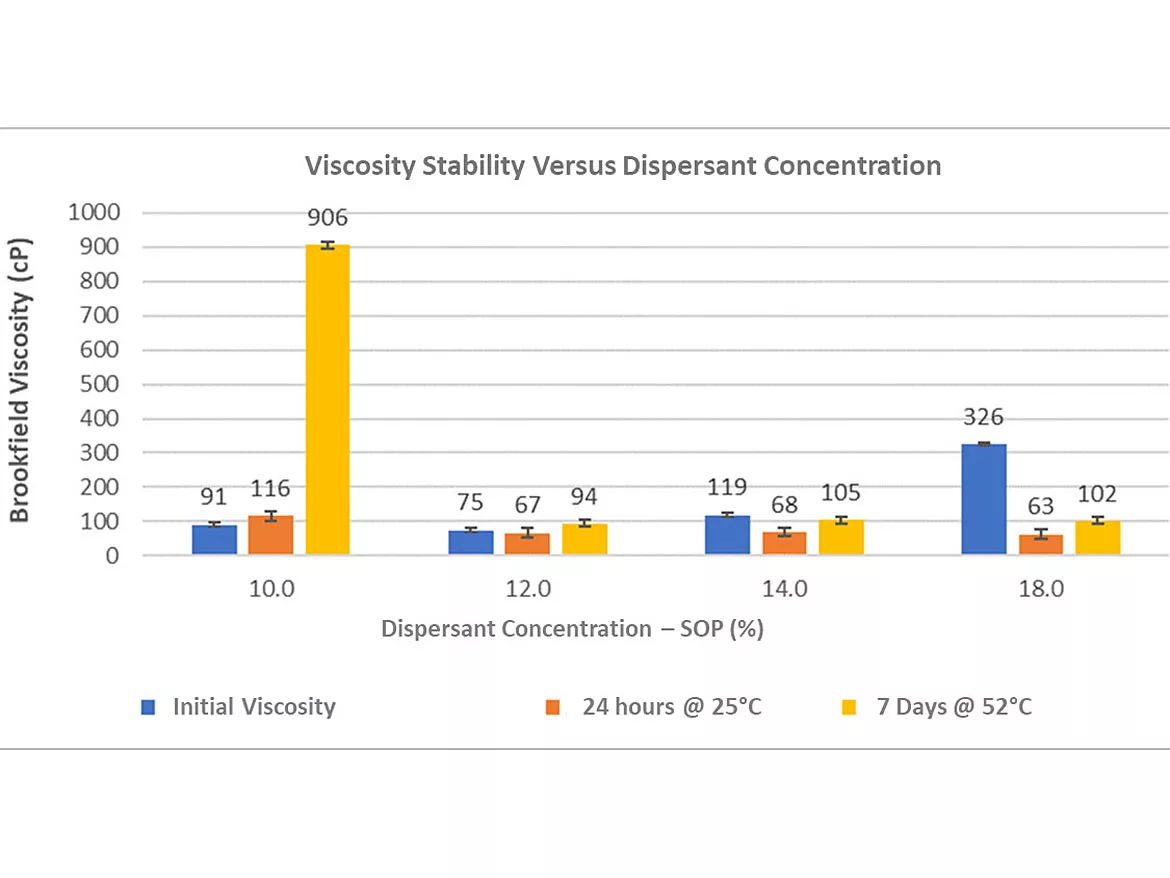
To illustrate the importance of using an optimized dispersant dosage in the pigment-concentrate formulation, pigment dispersions were prepared using the points established in the working range for the surfactant 18 viscosity curve; SOP (solids on pigment, also known as dispersant active on pigment solids) concentrations of 10.0, 12.0, 14.0 and 18.0%. The prepared pigment dispersions were evaluated immediately after the dispersion and milling process, after a period of 24 hours at room temperature (25 °C) and after the thermal stability test (7 days in an oven at 52 °C / 125 °F). Figure 2 shows the Brookfield viscosity values obtained under the different evaluation conditions.

From Figure 2, it is possible to notice that for the concentration of 10.0% SOP, the pigment concentrate does not show good stability, and it is possible to observe a small increase in viscosity with the sample kept at 25 °C for a period of 24 hours and a significant increase in viscosity after the thermal stability test, in which the sample was kept for 7 days at a temperature of 52 °C in an oven. For the concentration of 12.0% SOP, there is no significant difference in viscosity after 24 hours of the process, nor after the thermal stability test, indicating that at this concentration, a point is obtained where the stabilization of the pigment by the surfactant is maximized. At concentrations of 14.0% and 18.0% SOP, although a significant increase in viscosity was not observed after the thermal stability test, it is verified that there is a decrease in viscosity (after the process versus after 24 hours at room temperature), indicating the possibility of an overdosage of the surfactant, which can cause the formation of bubbles in the system and tends to decrease over time, thus justifying the decrease in viscosity as well as the greater difference in viscosity observed for the highest concentration of surfactant (18.0% SOP).
Figure 3 shows the mean particle size values of pigment concentrates prepared with surfactants at different concentrations. Although it is possible to observe that the smallest average particle size is obtained for the concentration of 12.0% SOP, which has the best behavior in terms of viscosity and thermal stability, the largest difference between the average particle sizes of the samples is not considered significant. The smallest average particle size of 161.4 nm is obtained for the sample prepared at a SOP concentration of surfactant of 12.0%, while the largest average particle size of 170.7 nm is obtained for the sample prepared with a SOP concentration of surfactant of 14.0%.
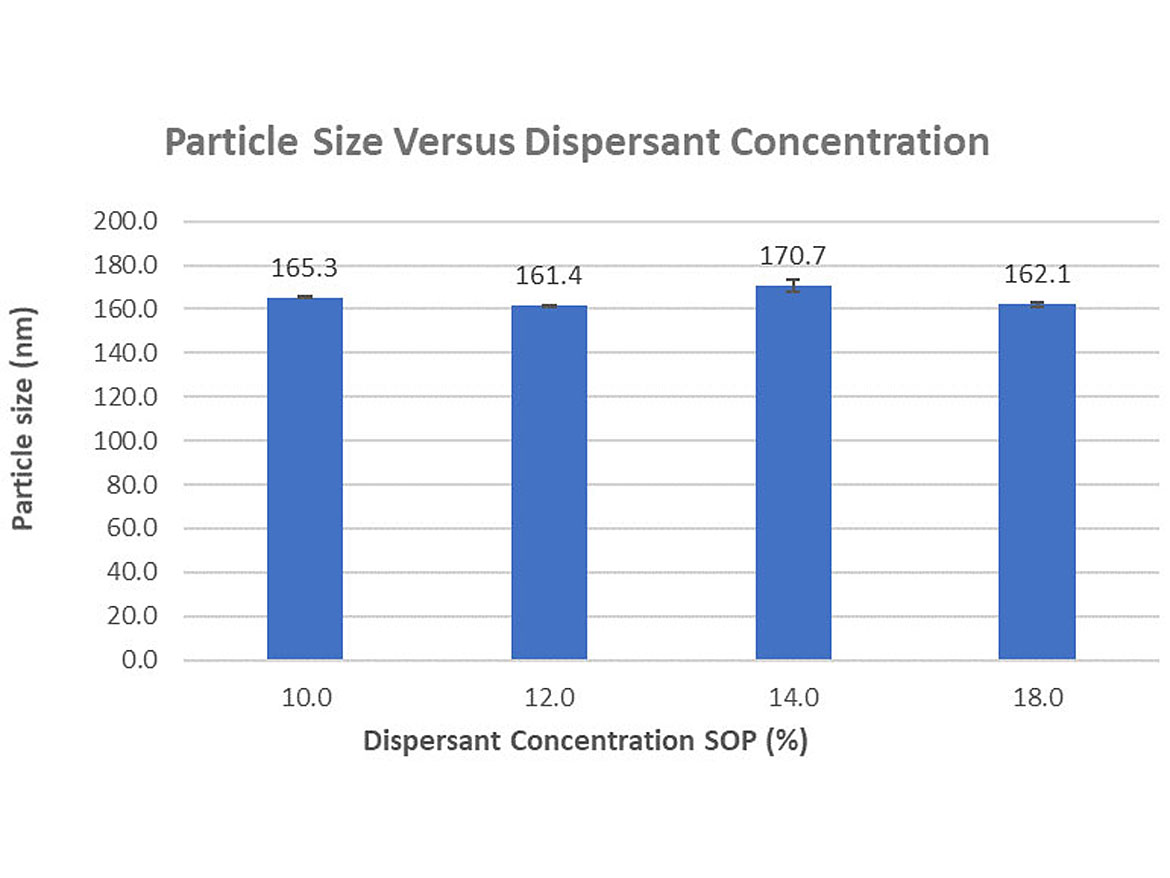
Figure 4 presents the initial tinting power test. The sample prepared with a surfactant concentration of 10.0% SOP was adopted as reference (100.0%). The graph shows the need to work with an optimized dispersant concentration. It is observed that the highest tinting power is obtained for the sample with a SOP concentration of 12.0%, and as there is an excess of dispersant in the system a loss of tinting power is observed. It is important to remember that all the dispersions prepared have the same concentration of pigment and that all samples have the same amount of pigment added (0.80 g of pigment concentrate for every 100.0 g of white base).
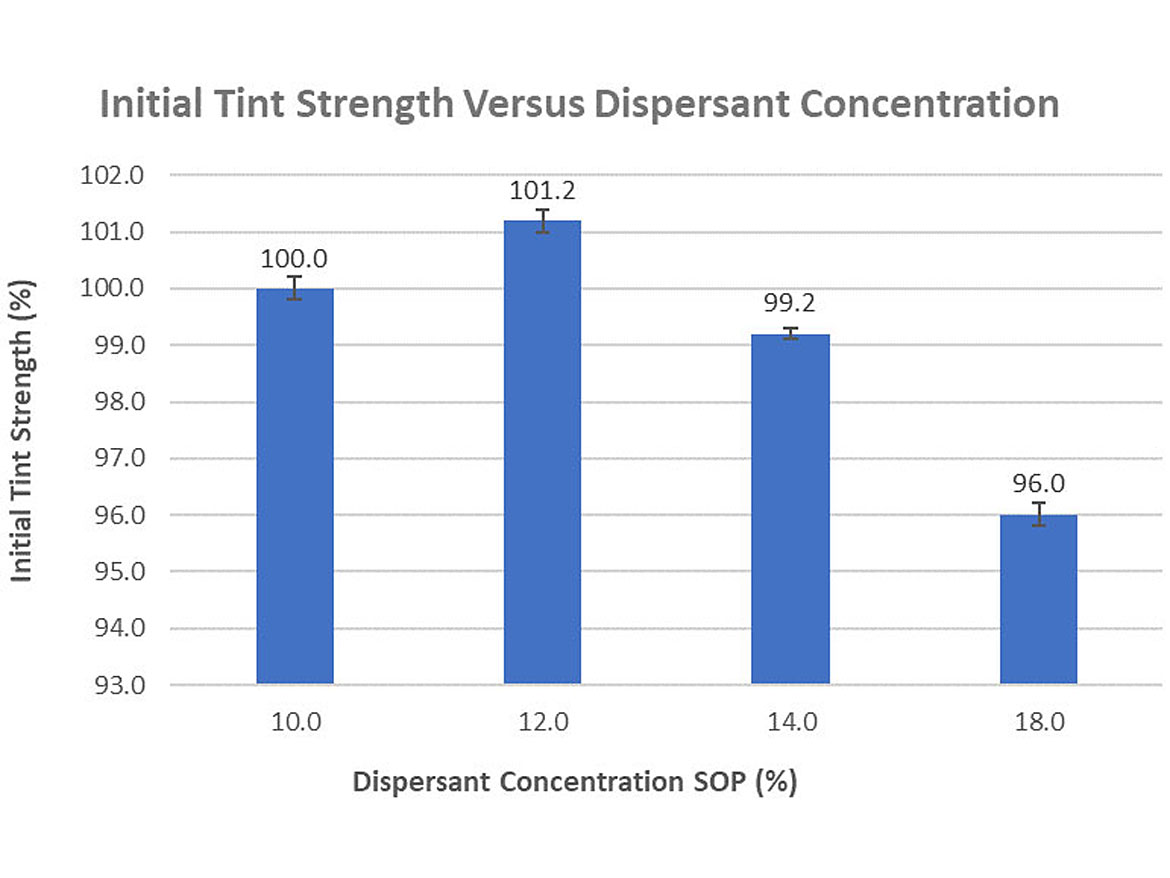
Figure 5 presents an assessment of the initial tinting power of the pigment concentrates (after 24 hours of the manufacturing process) versus the tinting power of the pigment concentrate after it has been subjected to a temperature of 52 °C for a period of 7 days. In this case, for each sample, the reference (100.0%) is adopted as the initial value and the value obtained after the stability test is compared to the initial value. The pigment concentrate prepared with a dispersant concentration of 12.0% SOP is the one that presents the best behavior in terms of stability, with no significant difference being observed between the initial tinting power and after the thermal stability test, indicating again that, in this concentration, there is the optimal dosage of dispersant for the system. Evaluating the results obtained for the pigment concentrate prepared using a concentration of 10.0% SOP, there is a slight drop in tinting power. At the higher concentrations, 14.0% and 18.0% SOP, there is a significant drop in tinting power after the thermal stability test, and this drop is more accentuated as the dispersant concentration in the system increases. The excess concentration of dispersant in the system will affect the stabilization of the pigment particles, which, consequently, will tend to aggregate and cause the loss of tinting power.
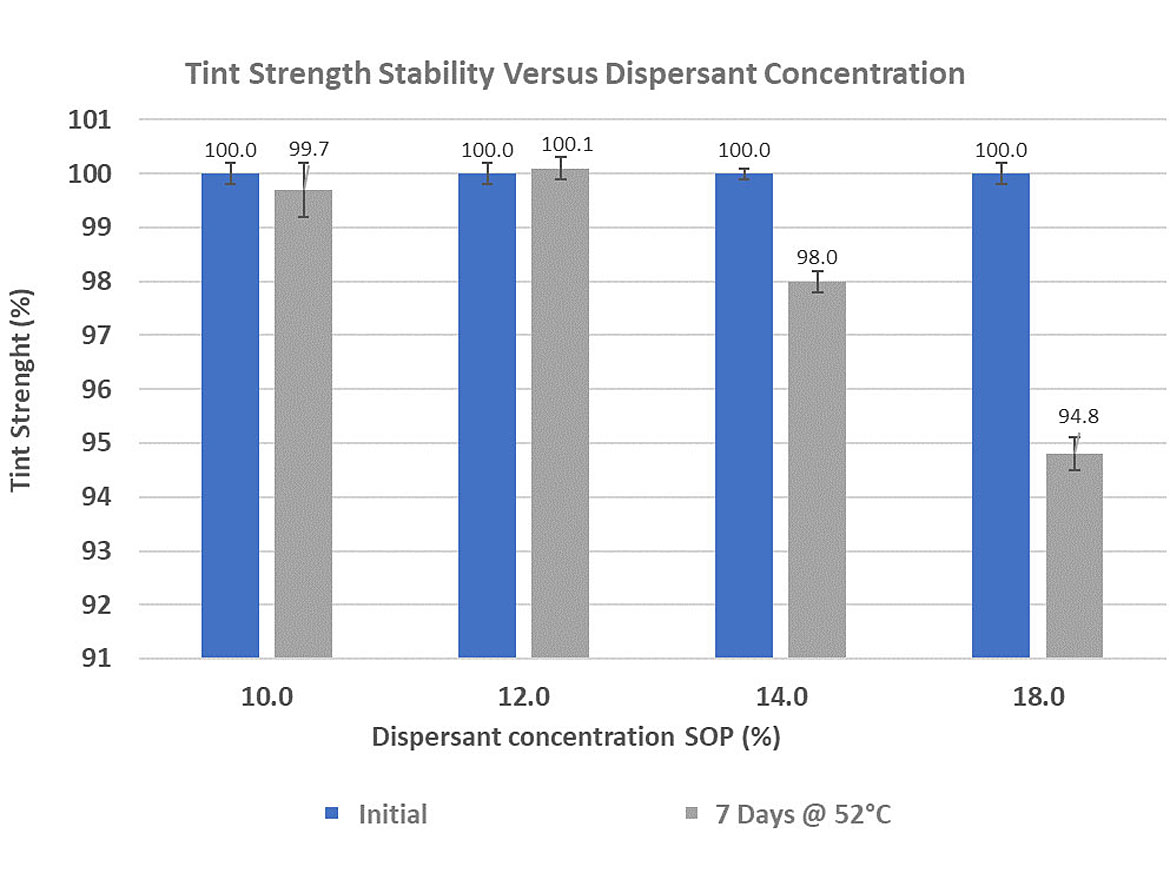
Figure 6 shows the rub-out evaluations performed with the pigment concentrates in the initial condition (after 24 hours of the manufacturing process) and after the thermal stability test. Evaluating the initial values obtained, it is verified that the pigment concentrates prepared with dispersant concentrations of 10.0% and 12.0% SOP are the ones with the best rub-out values; pigment concentrates prepared with higher concentrations of dispersant, 14.0% and 18.0% SOP, have the worst rub-out values, above 1.00, with a tendency to worsen as the concentration of dispersant in the system increases. Comparing the initial rub-out values and after the thermal stability test, it is verified that the pigment concentrate prepared with a SOP concentration of surfactant of 12.0% presents the smallest increase (0.04), while for the other evaluated dispersant concentrations higher increases are observed (0.11 to 0.30).

The combined evaluation of physicochemical and performance properties of pigment concentrates illustrates the need to establish, on a case-by-case basis, the optimal dosage of a dispersant in a system to obtain maximum performance at the lowest cost. The optimal concentration point corresponds to the minimum viscosity point obtained in the optimal dosage study curves. In this case corresponding to the concentration of 12.0% SOP for surfactant 18, which proved to be more efficient in all evaluations carried out: lower level of initial viscosity obtained, low-viscosity variation after thermal stability test, higher tinting power achieved using the same pigment concentration and lower initial rub-out value. Thus, providing evidence for the maximum efficiency in the dispersion process. Maintaining the tint power and rub-out after the thermal stability tests indicates maximum efficiency in the pigment stabilization process. Too low a level of dispersant causes loss of stability in the system, evidenced by the increase in viscosity and rub-out observed after the thermal stability test with the pigment concentrate (10% SOP). Too high a level of dispersant, in addition to increasing the final cost of the pigment concentrate, does not contribute to maximizing the properties of the pigment concentrate, as shown by the lower tinting power and higher rub-out values observed for pigment concentrates prepared with dispersant concentrations of 14.0% and 18.0% SOP.
This project demonstrated that even if the composition of surfactants has the same affinic group, the choice of an adequate size of the polymeric chain that composes the tail of the surfactant is essential to maximize the performance properties of the formulated pigment concentrate. In the study carried out, surfactant 18 was the one that presented the best balance between surface tension, As and Γ∆Gads, enabling the optimization of the performance of the pigment concentrate in terms of viscosity, thermal stability, color development, and rub-out. In addition, the study of the effect of the surfactant SOP concentration on the performance properties of the pigment concentrate demonstrated the importance of, in addition to selecting the most suitable dispersant for the system of interest, optimizing the dosage in order to maximize tinting power, stability, and compatibility of formulations.
All information contained herein is provided "as is" without any warranties, express or implied, and under no circumstances shall the author or Indorama be liable for any damages of any nature whatsoever resulting from the use or reliance upon such information. Nothing contained in this publication should be construed as a license under any intellectual property right of any entity, or as a suggestion, recommendation, or authorization to take any action that would infringe any patent. The term "Indorama" is used herein for convenience only, and refers to Indorama Ventures Oxides LLC, its direct and indirect affiliates, and their employees, officers, and directors.
Looking for a reprint of this article?
From high-res PDFs to custom plaques, order your copy today!


