Performance Advantages of Glass Bubbles in Energy-Related Coatings Applications
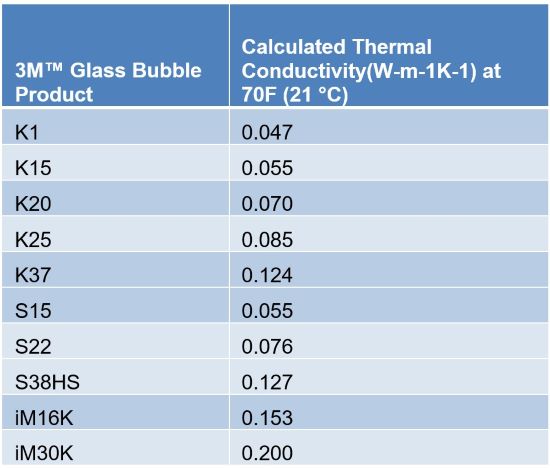
Glass bubbles* have been used for decades in construction, paint, and coatings applications to provide both application and performance benefits such as lightweighting, viscosity control, improved shrink and crack resistance in thick films, and thermal insulation. Thermal insulation is accomplished via the hollow structure of the glass bubbles, and the fact that they contain air, which provides more pore volume. There are many grades and chemistries available for glass bubbles. 3M offers true soda-lime borosilicate hollow glass bubbles that are specified by a strength/density relationship. Higher strength equates to a thicker shell, thus producing a higher density and a higher thermal conductivity due to less void space content. Conversely, the lower density glass bubbles offer more void space due to the larger particle size. This, in turn, yields lower thermal conductivity values, which can result in improved thermal insulation properties. Table 11 shows a condensed list of select 3M™ Glass Bubbles and their corresponding thermal conductivity values for the bubbles only.
TABLE 1| Calculated thermal conductivity.
When formulating coatings with 3M™ Glass Bubbles, care should be taken to select bubble(s) with the appropriate strength/density ratio to ensure survival during processing and application. While it may be desirable to choose a larger bubble for improved thermal insulation benefits, the final selection needs to be based on a balance of mixing, application, performance, and cost parameters. Glass bubbles exhibit much lower densities over other common mineral fillers, so substitutions in various formulations need to include adjustments for densities, which will typically result in much lower loading levels by weight. In the end, strength, density, and corresponding particle size are used to govern suitability for various coating applications. Typically, the isostatic crush strength for 3M grades ranges from 250-28,000 psi, densities range from 0.125-0.600 g/cc, and particle size averages range from 15-65 microns.
Rising energy costs and the growing urban populations have resulted in a continued focus on reducing the urban heat island effect. In recent years, many coatings have been developed that offer improved total solar reflectance (TSR) and emissivity. One way to accomplish this is by introducing small particle sized hollow glass bubbles in the coating matrix. The hollow glass bubbles scatter incident light and increase reflectivity, especially in the near-IR wavelength region, which comprises a significant portion of the sunlight’s solar footprint. Use of these coatings on certain grades of roofs and external facades can lower internal building temperatures and offer potential energy savings over time. Results of this work were demonstrated in previous submissions.2
Another area of interest is thermal-insulation coatings (TIC). These coatings are typically epoxy, acrylic, or silicone based and used to insulate objects such as tanks and pipes to offer improved energy savings via reduced heat loss. TICs are being offered as an alternative to mineral wool insulation to reduce corrosion under insulation (CUI), and potentially offer personal protection against incidental contact of hot/cold surfaces. Various studies have been performed on TICs involving mineral fillers, many of which can provide various degrees of performance benefits.
Glass bubbles are another option to consider when formulating TICs. Their hollow structure gives them ideal insulation properties. While the final insulation benefits may not outperform conventional materials (as related to R or U values), there are many other potential advantages to applying liquid TICs, such as full coverage of the substrate including complex geometries, minimal downtime due to application directly on all surfaces while equipment is running, and, potentially, a longer service life.
This section of the paper evaluates the effects of the addition of Glass Bubbles from 3M on thermal insulation benefits in a waterborne styrenated-acrylic latex paint. An example of some previous studies performed in this area can be found on Dow’s website.3
Experimental Methods and Materials
An example white paint formulation used for this study is shown in Table 2.4
TABLE 2| Basic paint formulation.

For all formulations, the mineral filler was added at 52.8 volume percent, which required varying the weight loading depending on the density of the filler. All formulations were targeted for a PVC of 74.6, and a percent non-volatiles by volume of 73.4. Note that the hollow fillers were added under low-speed impeller agitation towards the end of the formulation to help prevent breakage. The calcium carbonate example was mixed via Cowles agitation to obtain proper dispersion. The general properties of the fillers evaluated are shown in Table 3.5 For applications on steel surfaces, additional additives such as flash rust inhibitors may be needed.
TABLE 3| General properties of evaluated fillers.
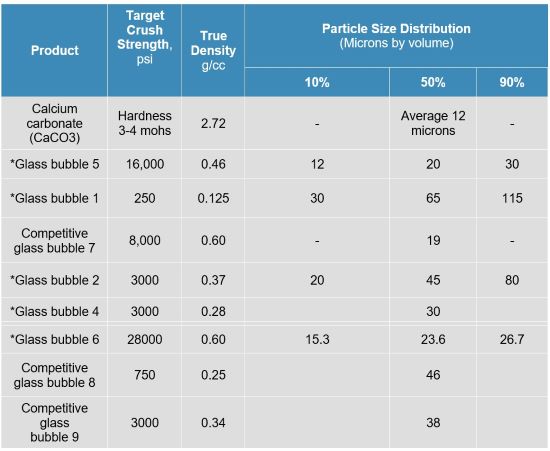
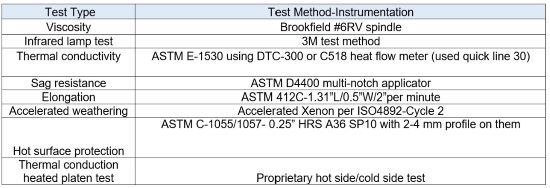
Glass bubbles were selected to cover a broad range of densities, strengths, and particle sizes. Calcium carbonate was chosen as a control since it is a common mineral filler for many paint formulations. Thermal conductivity measurements were conducted on 0.26” (6-7 mm) discs of each material, which were dried in several layers to obtain achieved thickness. Table 4 references the test methods used for these studies.
TABLE 4| Test methods.
Results and Discussion
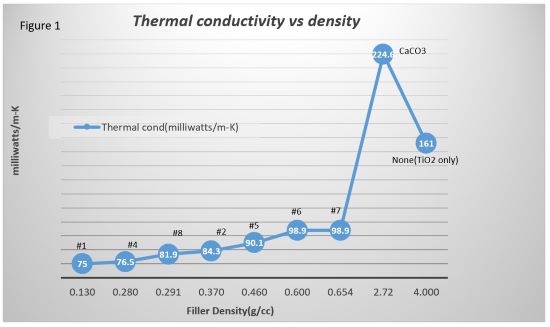
Thermal conductivity measurements exhibited good correlation to the filler densities, with the lower densities offering lower thermal conductivity and thus higher insulation potential. These cured paint discs were 0.26 thick and were measured using a heat flow meter. Results are shown in Figure 1.
FIGURE 1| Thermal conductivity versus density.
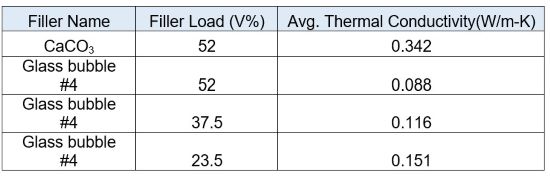
A second experiment was performed to evaluate effects of filler-loading concentration on thermal conductivity. For this experiment, ASTM method E-1530 (steady state) was performed on free film discs that were approximately 2.5 mm thick. The loading level of glass bubble #4 was varied from 23.5 to 52 volume percent and compared with calcium carbonate at 52 volume percent. Results are shown in Table 5, which averages two sets of measurements (9/23&11/23).
TABLE 5| Average thermal conductivity.
 Reference: GID31059/312629
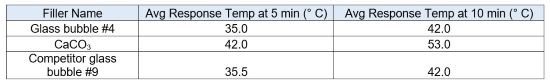
Results indicate lower thermal conductivity potential with increasing glass bubble loading levels, and much lower thermal conductivities compared to the conventional filler. To further demonstrate the insulative effects of using hollow glass bubbles in TICs, a third thermal conduction experiment was conducted using 2.5-3 mm-thick free films based on the formulation in Table 2. Films were subjected to a heated platen set at 150 ºC, and the bottom platen was set at 25 ºC. Response temperatures were measured at 5 and 10 minutes, and results are shown in Table 6.
TABLE 6| Average response temperatures.
 Reference: ESL-2023268-1-KJR
Results show that the glass bubbles can offer improved insulation capabilities as shown by a temperature difference of 11 °C over a 10-minute period versus the calcium carbonate.
All paints exhibited shear-thinning (pseudoplastic) behavior, ranging from 30 K cps at low shear to 500-2,000 cps at higher shear. This range should make it acceptable for various application techniques such as brush, roll, airless spray, or hopper spray. Care should be taken to choose an appropriate glass bubble for the intended application method to minimize chances of breakage.
For sag resistance, glass bubbles 1, 4, and 6 were compared to CaCO3, and all of them yielded improved sag at >60 mils versus <30 mils for CaCO3. This supports the fact that lower-density fillers could offer thicker films with fewer number of application passes and, thus, a potential for cost savings related to installation/application time. The lower-density glass bubbles also exhibit a lower tendency towards shrinking and cracking when drying, which results in a more uniform film with less chance for water ingress.
Infrared Heat Lamp Test
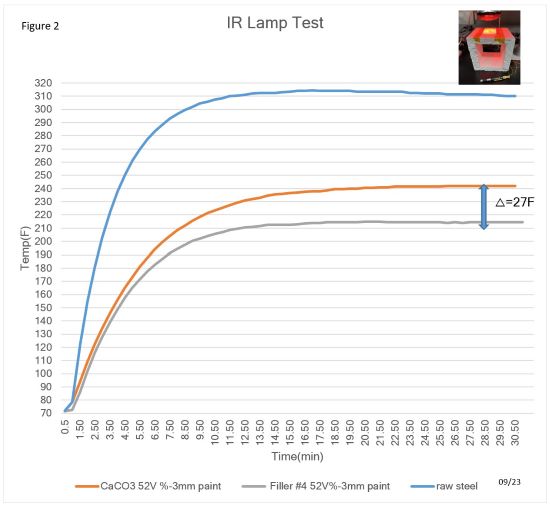
A laboratory experiment was developed to evaluate thermal benefits of TICs. Cold-rolled steel (.032”) panels were coated at various dry film thicknesses and exposed to a 250 W/R40 reflector/120V red heat lamp bulb for a period of 0.5 hours. The samples were approximately 4x6 inches, and the bulb was placed 3 inches from the substrate. A type K thermocouple and logger were attached to the backside of the panel, which was placed on a styrofoam stand. Temperature curves are shown in Figure 2 for glass bubble 4 versus the CaCO3 and a non-coated panel. The panel coated with glass bubble filler 4 exhibited temperatures 100 °F lower than an uncoated panel, and 27 °F lower than the conventional filler.
FIGURE 2 | IR lamp test.
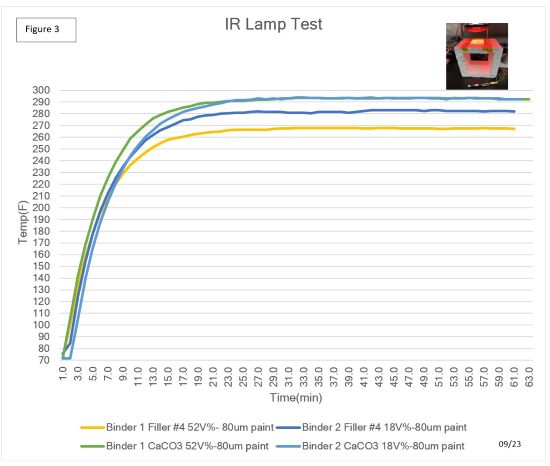
A second study evaluated two different binders with glass bubble 4 and CaCO3 at two different loading levels (18 vs 52 V%). This time, the dry film thickness was lowered to 80 microns (0.08 mm). Results in Figure 3 show that filler type, loading level, and dry film thickness influence thermal behavior of the coating, albeit the impact is less at lower dry film thicknesses compared to Figure 2 results.
FIGURE 3 | IR lamp test.
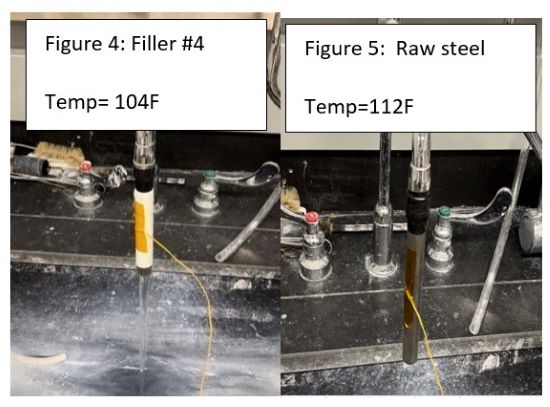
A simple visual demonstration using hot (120 °F) tap water flowing through a coated pipe, versus an uncoated pipe exhibited a temperature gradient of 5-10 °F after conducting the test for only 5 minutes. A pipe was coated with 1-2 mm paint containing filler 4 and compared to a raw steel pipe for external pipe temperature (Figures 4 and 5). The impact on this temperature gradient could be even greater depending on many variables such as dry film thickness, as shown in previous figures.
FIGURE 4 & 5 | Comparison between coated and uncoated pipe.
Mechanical properties tested on select samples do exhibit much-lower elongation with the addition of any filler, however glass bubble 4 does perform equivalent or better than a standard mineral filler and a competitive glass bubble as shown in Table 7. It should also be noted that a lower PVC did exhibit a higher-percent elongation, which supports the fact that a structured experimental design should be used to optimize all desired performance properties for each coating application. The formulations in Table 7 are based on the original model formulation in Table 2.
TABLE 7 | Performance evaluation. 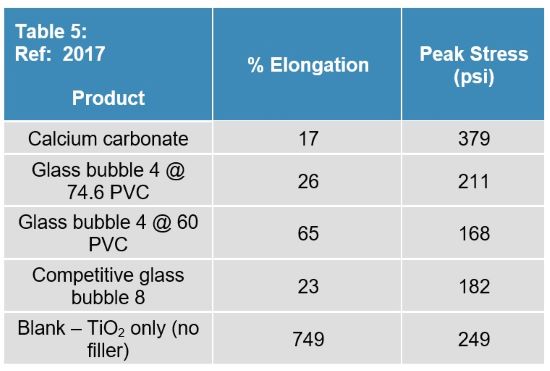
Personal Protection Coatings
Data has shown that hollow glass bubbles can help reduce thermal conductivity and provide insulation benefits when formulated into high-quality thermal-insulation coatings. One method to assess level of protection is ASTM C-1055/1057, which evaluates protective benefits as related to hot surface temperatures and the ability to prevent contact burns. Triplicate coated panels comparing three different fillers at 52 volume percent were subjected to a thermesthesiometer test at three different initial set points of 80, 120, and 150 °C, respectively. The dry film thickness target for all samples was targeted at 2.5 mm. The formulation from Table 2 was used for this study. Results are shown in Table 8.9
TABLE 8 | Dry film thickness results.
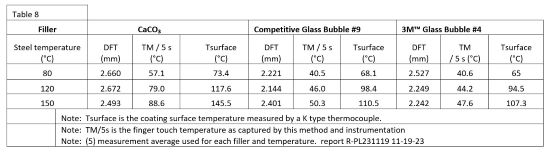
Results show much-lower temperature capabilities for both coating surface and finger touch at all three temperature settings when using hollow glass bubbles versus a conventional filler. In fact, even at the highest setting of 150 °C, the finger-touch temperature using glass bubble 4 came in the lowest at 47.6 °C, which is well below the typical threshold of 60 °C called out in the test methodology.
Energy: Storage and Distribution
More recent developments of the LH2 economy have opened the door for exploration into improving energy savings in areas like cryogenic storage and distribution, which are integral parts of the value chain. Hollow fillers such as Perlite and Glass Bubbles from 3M (#1) are already used in cryogenic storage to fill the annular space and reduce boil off of container contents.6,7 Knowing that hollow fillers such as glass bubbles can improve thermal insulation (conduction) and increase solar reflection (radiation), it makes sense to ponder their use and effectiveness in coatings for the exterior surfaces of storage tanks, cylinders, and transport vehicles. Many of these surfaces are already being coated with multi-coat primer/topcoat systems involving various technologies such as two-component polyurethanes, which typically offer excellent weatherability and chemical resistance.
A small study was performed on 0.032-inch CRS panels coated with a white, 2K solvent-based FEVE system, based on Lumiflon® LF-200F/Desmodur® N3300. 3M Glass Bubble #4 was added at 27 V%/7 W%, and compared to the base white for solar reflectance and IR lamp heat reflectance using the methods already described. Results are shown in Figure 6. The addition of glass bubbles increased the TSR by 5.2% and decreased the backside of the panel temperature by 30 °F. Lower temperature and higher TSR should both be desirable properties in protection of the contents in storage containers.
It should be noted that the addition of any grade of hollow glass bubbles will cause a decrease in the final gloss. For this 2K system, the gloss decreased from 76 to 24.
FIGURE 6 | IR lamp testing results.

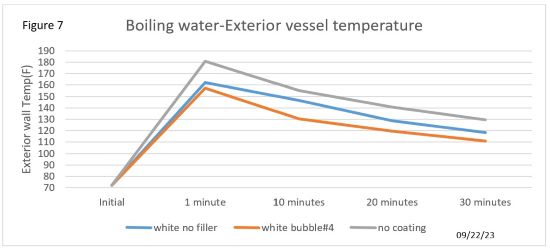
To further demonstrate insulation benefits on storage systems, a steel can was filled with boiling water, and the exterior temperature was monitored over a 30-minute period. For this study, the basic formulation from Table 2 was used, and glass bubble 4 was compared to a standard white paint (1-2 mm applied to exterior of can) and an uncoated can. Results, as shown in Figure 7, demonstrate the thermal insulation benefits as depicted by lower temperatures on the exterior surface when using Glass Bubbles from 3M. Future studies could focus on quantifying the thermal insulation benefits for transportation of materials such as liquid hydrogen or nitrogen.
FIGURE 7 | Boiling water exterior vessel temperature.
Accelerated weathering studies were also performed on two different water-based latices and compared to the two-component solvent-based FEVE paint. The filler type and PVC levels were varied, and some samples used both a white basecoat and 2K FEVE clear coat.
After 1,000 hours accelerated weathering, the FEVE system performed very well, with minimal gloss or color change. To get the optimal benefits for total solar reflectance, the hollow glass bubbles need to be added to the white coating and be close to the surface. As an example, when glass bubble 4 was added at 27 V% to the FEVE white coating, the TSR increased from 83 to 88%. When a base white latex was top coated with a FEVE clearcoat containing the same amount of glass bubble 4, the TSR dropped to 79.
Comparisons of the standard latex formulation from Table 2 showed an increase in TSR from 85.8 to 91.8 when replacing CaCO3 with glass bubble 4. Binder chemistry can have a major impact on final weathering properties. While the FEVE performed very well, the latex from Table 2, which contains an acrylic styrene co-polymer, showed much more yellowing and gloss loss versus a different 100% acrylic latex. Both latex systems were worse than the 2K FEVE solvent-based coating for overall color and gloss change, but all systems had overall color change (DE) values of less than two units after 1,000 hours, except for the formulation from Table 2 with CaCO3. This system had a DE of 4.8, but most of that came from the Db, which showed more yellowing than the other systems.
Summary
Glass Bubbles from 3M are one cost-effective inorganic filler option that have been used for decades to provide application and performance benefits such as lightweighting and thermal insulation for many industries such as construction, general industrial, and automotive. With the continued interest on energy and resource conservation, glass bubbles may provide formulators with another “toolbox” option as they develop the next generation of coatings for the industry. Energy-savings estimations for applications such as cool roof coatings can be ascertained by inputting laboratory data into cost calculation modeling programs such as the one listed on the DOE’s ORNL website.8
References
1 3M reference 98-0212-3859-1, issued 03/13.
2 Rink & Rodriguez, CoatingsTech, September 2016.
3 Maincote IC-1001 Resin, 884-00438-0314-NAR-EN-CDP, February 2014, REV 0.
4 All trademarks */registered materials are property of their respective owners.
5 Glass bubble #8 true density via gas pycnometer measured 0.291 g/cc & #7 was 0.6543 g/cc
Reference for designations #7-#9: Sphericel General PDS-2011-lr; CaCO3 reference Duramite SYL-2019-07; 3M™ Glass Bubble designations: #1=K1, #2=K37, #4=S28HS, #5=iM16K, #6=iM30K.
6 nasa.gov-citation 20180006604, Fesmire, Glass Bubbles Cryo Insulation History, Sept. 2017.
7 https://www.3m.com/3M/en_US/power-generation-us/solutions/cryogenic-insulation/.
8 https://web.ornl.gov/sci/buildings/tools/cool-roof/.
9 Testing performed by 3rd party lab per ASTM C1055/1057.
Technical information, recommendations and other statements contained in this document or provided by 3M personnel are based on tests or experience that 3M believes are reliable, but the accuracy or completeness of such information is not guaranteed. Your results may vary due to differences in test types and conditions. This information is intended for use persons with the knowledge and technical skills to analyze, handle, and use such information.
*For this study, glass bubbles and HGMS-hollow glass microspheres terminologies can be used interchangeably.
For more information, contact Kevin Rink at kjrink@mmm.com.
Looking for a reprint of this article?
From high-res PDFs to custom plaques, order your copy today!


