Cure Monitoring of Paints by Dielectric Analysis - Even in-Situ

Proven thermoanalytical methods are an excellent tool for describing the glass transition of a partly cured or totally cured paint film. Also, the curing process itself can be studied by Differential Scanning Calorimetry (DSC) and Dynamic Mechanical Analysis (DMA). DSC is ideal for analyzing the curing of powder paints.1 The endothermal melting of the resin followed by the exothermal curing can be easily measured, and the heat of curing can be determined. However, solvent-containing or waterborne liquid paints create a large endothermal evaporation effect in the DSC curve, which can superimpose on the curing effect or conceal it. The tension mode of DMA enables measurement of the increase in Young Modulus during curing, but the handling is more time consuming due to the need for an inert carrier for the liquid paint, e.g. a silk fabric.2 With Dielectric Analysis (DEA), these problems and efforts are minimized. Using application-tailored comb sensors, the course of the flowing, drying and curing of a liquid paint can be described by plotting the ion viscosity as a function of time and/or temperature and frequency. The greatest advantage of the DEA technique is that it is not restricted to laboratory use, but can be applied to in-situ monitoring under real processing conditions3 and is ideal for this purpose.
This paper presents new measurement results for thermal and UV curing of liquid paints. By applying thermokinetic analysis4 to the DEA data for the thermal curing of a powder coating, the degree of crosslinking can be predicted and the curing process thereby optimized.
Cure Monitoring by DEA -
Method and Instrumentation
The measuring principle of DEA is based on the paint being in direct contact with a dielectric sensor. Both this measuring principle and the instrumentation used are described in detail.5 The two comb-shaped electrodes can be arranged in an interdigitated design. A sinusoidal voltage (input signal) is applied to one electrode. The second electrode acts as a receiver for the resulting current (output signal). During the curing of a reactive resin, in the alternating current field the ionic mobility (ion conductivity) decreases and the alignment of the dipoles attenuates. The change in dielectric properties, i.e. in permittivity e' and loss factor e'', is then calculated from the measured amplitude and phase change. The plotting of the logarithm of the ion viscosity (the reciprocal value of the logarithm of the ion conductivity) has proven to correlate to the dynamic viscosity h measured with a rheometer.The NETZSCH DEA 230 Epsilon series with signals for both dielectric properties and temperature can measure over the widest ion conductivity range in multi-frequency sweeps from 0.001 Hz to 100 kHz. Of this series, the high-performance DEA 230/2 can be equipped with two external interface boxes for different conductivity ranges. The low-conductivity Integrated Circuit (IC) sensor can be utilized for highly accurate measurements. The single-channel DEA 230/1 or the 10-channel DEA 230/10 are designed to handle nearly all reactive paints and coatings. Due to their high data-acquisition rates, the high-speed DEA 231/1 is preferred for fast UV (ultra violet) light or EB (electronic beam) curing at one selected frequency.
Every instrument channel can be equipped with one of several types of comb sensor, each of which penetrates the coating to a different defined depth. The implantable (disposable), interdigitated electrode (IDEX) standard sensors are resistant to temperatures up to 375 °C and measure 115 µm into the coating. The Micron Sensors (MS) are available with fringing fields of 1, 5 and 25 µm in different temperature ranges. Finally, the IC Sensor works up to 250 °C to a depth of 12.5 µm. An integrated thermal diode measures the temperature at the same position as the dielectric signal.
The DEA 234 CurePak Thru-Oven Cure Analyzer is a remote, battery-operated, four-channel dielectric measurement system. It can collect data in multi-frequency mode by using IDEX or MS sensors and is designed for paint lines, kilns or conveyor ovens. The CurePak is protected by a thermally insulated enclosure, which allows it to withstand elevated temperatures for long periods.

Experimental
Three experiments were performed. In the first, a liquid acrylic paint was applied to the comb-shaped IDEX sensor using a drawbar to achieve a wet paint thickness of 80 µm. Afterwards, UV light was applied in an industrial conveyor device with conventional lamps. For monitoring this fast curing, the NETZSCH DEA 231/1 Epsilon was used at a frequency of 10 kHz.In the second experiment, two types of single-component liquid polyurethane clear coats were applied to the IDEX sensors by using a drawbar (wet thickness of 90 µm). For the two-step temperature program, a lab furnace was used. Isothermal holds were programmed at 80 °C for 7 min and at 160 °C for 23 min. The heating rate between the two isothermal holds in each of the measurements was set at 30 K/min. Multi-frequency scans of 1, 10, 100 and 1,000 Hz with NETZSCH DEA 230/1 Epsilon were performed. For the discussion of the results, the 1,000-Hz curves were evaluated.
Thirdly, three powder coating samples of the same type were evenly applied to the IDEX sensors electrostatically (spray gun), put into a laboratory furnace and cured for 60 min at three different isothermal temperatures: 140, 150 and 160 °C. The thickness of the paint layer was approximately 100 µm. The measuring frequencies of the DEA 230/1 used were 1, 10, 100, 1,000 and 10,000 Hz. For the kinetic analysis (NETZSCH Thermokinetics software), the ion viscosity curves at 10 Hz were used.
DEA Measurement Results
UV Curing of a Liquid Acrylic Paint
Figure 1 illustrates the fast UV curing of a liquid acrylic paint. After 12.3 s, the logarithm of the ion viscosity (reciprocal value of log ion conductivity, blue curve) arrives at its minimum value as a result of the slight temperature increase. This effect provides a good wetting of the paint on the substrate. Thereafter, curing starts with a sharp increase in ion viscosity over approximately 0.7 orders of magnitude from 4.7E6 to 2.3E7 Wcm within a time of only 1.1 s. The corresponding temperature increase (red curve) of the exothermal curing from 29 °C to 50 °C occurs with a time lag.
Thermal Curing of Two Liquid
Polyurethane Clear Coat Types
As illustrated in Figure 2, the two PUR clear coats show a different drying and curing behavior at the same temperature profile, measured at 1 kHz. Neither sample is totally cured after 20 min at 160 °C, as can be seen in that the ion viscosity level is still rising. Paint 1 (red curve, filled triangles) shows a higher reactivity (higher slope) and an earlier start of curing than paint 2 (blue curve). This is due to the catalyst/accelerator system used in paint 1. Additionally, paint 1 reaches a higher ion viscosity level than paint 2. In general, a higher level of ion viscosity yields a higher network density, which can be proven by mechanical testing of hardness, rigidity or stiffness.
It should be pointed out that a comparable thickness of the wet paint layer is important, especially regarding the evaporation of the solvent during the drying phase. The use of a drawbar is therefore recommended. For thinner coatings, the Micron Sensors (MS) are preferred for a better fit to the fringing field of this sensor type.

Thermal Curing of a Powder Coating
Based on Epoxy/Polyester
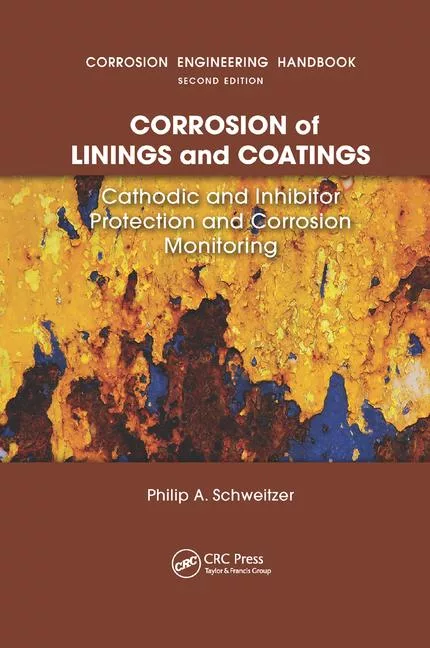
Figure 3 shows an example of the DEA raw data for the curing of the hybrid powder coating at 160 °C with the logarithm of ion viscosity (blue curves) and the logarithm of loss factor (green curves) at 1, 10, 100, 1,000 and 10,000 Hz. As temperature increases, the best flow behavior (minimum viscosity for an optimum wetting) occurs first; this can be ideally determined by using high measuring frequencies (e.g. 1 or 10 kHz). After this minimum, the ion viscosity increases by more than one order of magnitude (10E7.1 to 10E8.3 Wcm) and arrives at a horizontal course after approx. 50 min. Near the end of the curing, one should refer to the lower measuring frequencies (e.g. 1 or 10 Hz), at which the ions are still able to follow the alternating current. Finally, the ion viscosity reaches its highest level at the end of curing.
Thermokinetic Analysis for the Optimum Degree of Crosslinking of the Powder Coating
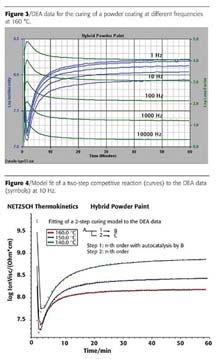
Shown in Figure 4 is the logarithm of the ion viscosity for the three different isothermal temperatures of 140°C (green curve), 150 °C (blue curve) and 160 °C (red curve), presented as a direct curve comparison at a measuring frequency of 10 Hz. It can clearly be seen that the ion viscosity reaches lower values as the curing temperature increases. This applies to both the minimal value, which is accountable for the best paint course, and the final value for the entire curing.By employing non-linear regression with the NETZSCH Thermokinetics software, a two-step model for a competitive reaction (straight lines) can be found that perfectly fits to the DEA data (symbols). A correlation coefficient of 0.9988 was achieved here.
It must be pointed out that this is a formal kinetic analysis. It is here assumed that product A is on the one hand converted into product B (here, under an autocatalytic effect of B), but on the other hand also into product C. These individual reaction steps cannot be attributed to any chemical reaction steps (reaction equations).
Both the individual parameters and the statistical values for the thermokinetic analysis are presented in Table 1.
Contrary to liquid paints as already discussed in reference 3, the common objective for powder coatings is to achieve the maximum degree of crosslinking. This is important for superior mechanical properties (hardness, rigidity and scratch resistance), a high heat deflection temperature (high glass transition) and a better resistance of the coating to corrosion and weathering.
The Thermokinetics software not only describes the kinetic parameters but also can perform predictions for the degree of curing. After having found a suitable kinetic reaction model for a comprehensive description of the curing behavior, the conversion rate (corresponding to the degree of curing) can be calculated for different temperatures as a function of time (Figure 5).
Even practice-related temperature/time steps or cycles can be simulated by means of the Thermokinetics software. Based on a practical temperature pattern in an industrial infrared furnace, the curing degree can be predicted. The progress of curing can clearly be seen in Figure 6, where the powder coating temperature increases stepwise to 120 °C, 140 °C and finally 160 °C. After cooling back to room temperature, a conversion rate (corresponding to the degree of curing) of approximately 94% is achieved.
Summary
DEA is complementary to other thermoanalytical techniques such as DSC and DMA. Contrary to DSC and DMA, DEA can be easily used for very fast UV-curing reactions. By measuring the ion viscosity (reciprocal value of the ion conductivity) using DEA, the drying and curing process of liquid and powder paints and coatings can be monitored not only in the lab environment but also in real continuous processes (in-situ).
By carrying out a comprehensive thermokinetic analysis of the DEA measuring data, even complex processes can be excellently described, and predictions of the degree of crosslinking at freely selectable temperature/time programs can be made.
References
1 Knappe, S.; Möhler, H.; Opfermann, J.; Walter, H. DSC - An advanced research tool for characterization and simulation of powder paint curing. Paper at 6th Nürnberg Congress 2001 presented by S. Knappe, NETZSCH-Gerätebau GmbH, Selb, Germany.2 Knappe, S.; Möhler, H.; Opfermann, J.; Walter, H. Clear Coats: Dynamic Mechanical Analysis (DMA) of Liquid Paints and Films, in: Focus on Thermal Analysis for Paints, p. 30-37, NETZSCH-Gerätebau GmbH, Selb, 2001.
3 Knappe, S. Characterizing Liquid Paints by Using Dielectric and Kinetic Analysis, Paper at 7th Nürnberg Congress, 7-8 April, 2003, NETZSCH-Gerätebau GmbH, Selb, Germany.
4 Opfermann, J. Kinetic analysis using multivariate non-linear regression. Journal of Thermal, 60 (2000), p. 641-658.
5 Knappe, S. Vernetzung verfolgen, Optimierte Lackhärtung durch dielektrische und kinetische Analyse, in: Farbe&Lack, 9/2003, pages 18 - 22.
This paper was presented at the 8th Nürnberg Congress, Creative Advances in Coatings Technology, April 2005 in Nürnberg, Germany. The Congress is sponsored by FPL, PRA and the Vincentz Network.
For further information contact NETZSCH-Gerätebau GmbH, www.ngb.netzsch.com.
Looking for a reprint of this article?
From high-res PDFs to custom plaques, order your copy today!