The Flaws in Accelerated Weathering of Automotive OEM Coatings
It is well known in the coatings industry that the light sources in these tests are not an exact match for sunlight. There are different intensities and distributions of wavelengths in the artificial light sources compared to sunlight that can provide different weathering results in accelerated weathering compared to field tests. Recent work by Ford and 3M has potentially reduced this disparity, but there are other issues to be solved. It has also been revealed by many sources, including Ford1 and GE2, that the humidity and water control in the accelerated tests are not correct. Both GE and Ford have gotten better correlation to field test results by combining humidity-related tests such as water exposure or soak tests along with accelerated weathering techniques.
Factors in Accelerated Weathering
While the current efforts are on the right track, there are still many more factors to control to bring the accelerated weathering tests into complete correlation with field results for automotive OEM coatings. In order to control all of the factors in accelerated weathering, one must know what the real field conditions are. Given that these accelerated tests are designed to match a Florida summer environment, weather data was collected in Jacksonville, FL, throughout the summer of 2004 from a weather station installed by Bayer MaterialScience (Figure 3). The weather station measured rainfall volume and pH, panel temperatures, dew point, % relative humidity, solar radiation, and the load cell output every 5 minutes for the duration of the study (May 25 - August 30, 2004). The reason for choosing this location is that one could look at this data in relationship to both the acid etch phenomena and overall weather conditions in an environment similar to that in South Florida, where most of the field test sites are located. A comparison of this data to actual data collected in South Florida showed the weather conditions to be comparable during the time period the data was collected. A separate publication has evaluated this data versus the acid etch phenomena.4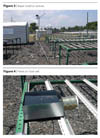
Intensity and Distribution of Light
Since the light issue seems to be on the way to being resolved by work at Ford1 and 3M3, the first issue to address is the testing orientation. While testing in a vertical orientation might have some logistical advantages in terms of equipment design, it may be difficult, if not impossible, to correlate the results for all types of coatings in a field environment. For example, architectural coatings that are used mostly in a vertical orientation might correlate with vertical accelerated tests. However, in automotive coatings, where the majority of failures are seen on horizontal surfaces, it may be very difficult to obtain correlation in a vertical testing orientation. While most factors can be obtained in a vertical orientation equivalent to horizontal, such as temperature and light exposure, it may be difficult or impossible to match the effects of humidity and exposure of a horizontal surface to water sprayed in a test cabinet with a vertical orientation. There are the issues of gravity, where there might be more washing action but less penetration of water into a coating in a vertical orientation compared to a horizontal orientation with the opposite effect of less washing but more water on and inside the coating film. Since the real issue of orientation is related to the ability to control the humidity and water exposure to test specimens, specific data must be generated to understand how to control this area of accelerated testing.
Water
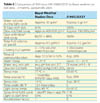
While data such as percent relative humidity and time of wetness are reported by various field test locations, data on the total amount of water contacting a test surface (including both rain and dew), and the total amount of water inside the coating as a function of time and temperature has never been obtained or reported by the companies that perform the field testing service. In order to try to generate this data, a 9 1/2 x 9 1/2-inch aluminum panel was exposed in Jacksonville, FL, on a load cell that recorded a current output that could be converted to units of mass or volume (assuming a density of the water of 1 g/cm3). An aluminum panel was used to meet the output requirements for the load cell while having the rigidity to keep its geometry when exposed to water (Figure 4). In order to determine the relationship between current and mass, specific weights were placed on the panel to obtain an equation to convert the current output to mass units. Calibrations were done every two weeks during the exposure to verify the load cell output (Table 3).The load cell output was recorded as one data point every five minutes from May 25 until August 30, 2004. While there were a couple of events that interfered with the load cell output, very good data was collected from June 30 - August 25, 2004 (56 days). The data from the load cell can actually tell us the total volume of water contacting the panel surface, the temperature of the panel with water on the surface, and the amount of time that the panel was wet. The factors of wind and debris on the panel interfered with the ability to gain the actual amount of water inside the coating layers.
In the 56-day period from June 30 - August 25, 2004, the load cell recorded a total water weight of 41 gallons. It is known that much of this is the same water standing on the surface of the panel for increments of time. Three months of outdoor exposure correlates to approximately 300 hours of SAE J1960/J2527 exposure (this has been verified at BASF using photo-oxidation measurements) where approximately 3 gallons of water is sprayed on a panel (approx. 0.2 gal/ square inch of coating surface area) based on laboratory measurements. The largest difference is the amount of water contacting the surface during the daylight hours in the field versus the light + spray cycle in J1960/J2527. There are many instances in the field where the coating surface is totally covered by water at temperatures from 70 - 120 degrees F (approximately 20 - 50 degrees C) for time periods up to 18 hours (8-12 hours is a typical value). These instances occur typically when the panel collects dew in the evening, eventually evaporating off the coating surface as the sun rises and the panel temperature increases. This takes place at little or no solar radiation. In J1960/J2527, the light + spray cycle that is near this temperature is occurring at a high irradiance value and only provides a small amount of water to the coating surface.

While it is impossible to directly compare the vertical spray from J1960 with horizontal field exposure, it can be reasonable to perform water soak experiments in the laboratory that match the exact field conditions and compare them to water uptake values found in the light and dark cycles of the J1960 process. Water soak experimental results indicate that total water uptake is increased by panel temperature and by the total coating weight/thickness. The maximum amount of water contained in a coating film in a standard weatherometer capable of running J1960/J2527 is at most 1% by volume in the light plus spray cycle and approximately 3% by volume after the dark plus spray cycle based on volume water vs volume of the topcoat layers. This value is low compared to soak tests and regular humidity tests. Soak tests of panels in a horizontal position can pick up as much as three times the amount of water (3-10%) depending on the soak temperature and time.
Temperature and Time
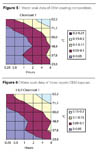
A variety of temperatures and times were evaluated that match specific field conditions when the load cell panel was totally covered with water. It appears that the majority of the water uptake and humidity-related damage occurs during the 8-12 hours with dew sitting on a coating at ambient temperature. Tables 4 and 5 show some of the weather data that demonstrate the transitions into the dew/dark cycle and eventual drying of a panel during the daylight. The last three columns of Table 4 show the start of water uptake from a rain event, and the values in red in Table 5 show the significant changes, such as the point where the water finally has totally evaporated off the panel surface. While a coating can uptake more water in a shorter time at a higher temperature, the amount of time that a coating sees when it is saturated with water at temperatures of 50 degrees C and higher is quite low. However, even in this short amount of time, a coating can uptake more water than during the light plus spray cycle of J1960/J1885. Examples of some of the water soak data and uptake data are as shown in Figures 5-8.

Water Temperature
The temperature of the applied water also has to be considered. Data from a Florida summer indicates a typical water temperature of approximately 20 - 25degrees C. There is no specific control on the water temperature used to spray in J1960/J2527. Water sprayed in accelerated weathering cabinets at BASF has varied from 10 to 25 degrees C. The varying water temperature will have an effect on the panel temperature as a function of time, and also the ability of an accelerated device to control the panel temperature. More stress could be induced into a film when very cold water is sprayed onto a hot coating surface vs. when room temperature water is sprayed onto the same surface. Also, as the water temperature and resulting coating temperature is lower, there will be less water penetration into the coating film.
pH
Another consideration is the pH of the applied water. While it is certainly convenient to use deionized water in the spray applications for accelerated weather testing, there is no such thing as deionized water falling as rain or condensing as dew. The real water in the field has varying ion concentrations and pH values. Most of the dew and rainfall collected and analyzed during the summer of 2004 in Jacksonville was acidic. The average pH of the dew collected was approximately 6.4, and the average pH of the rainfall collected was 6.1. The average pH from all of the water collected was 6.4, and minimum pH was 3.6. Dew and rainfall contain the ions typically associated with acid rain, such as SO4, NO3, Cl, Na, K, Mg and Ca ions. While it would be inconvenient from both a mechanical and logistical perspective to use water other than deionized water, we are probably missing the effects of hydrolysis reactions among others, by not using water that is more representative of the Florida environment. There is etch-type damage that is found on actual units as well as field exposure panels. The use of some acidic spray could duplicate this damage.
Panel Temperature
While the temperature of the applied water has been discussed, another critical factor is the panel temperature. While the highest panel temperature measured in Jacksonville in the summer of 2004 was 78.9 degrees C (174 degrees F), the panel temperature exceeded 70 degrees C for only approximately six hours of the three-month period. This would compare with approximately 150 hours at or above this temperature in a J1960/J2527 cycle. Assuming an average of 13.5 hours light and 10.5 hours dark in the field, this would translate into 0.5% of the light time that the panel temperature was at 70 degrees C or higher. This compares with about 50% of the time in the J1960/J2527 process. This in itself indicates that 70 degrees C may be too high for an accelerated test. However, one can argue that since the maximum temperature is this high, it is proper to use it as the accelerated test temperature. Also, there has been data recorded that shows the real temperatures on actual vehicles to be higher as well. The issue might not be the maximum temperature as much as the rates of temperature change.
In the Florida weather data, the panel temperatures indicate that the surface cools to the ambient temperature every night. This value is typically 20-25 degrees C. So for the approximately 10.5 hours that comprises the dark cycle, the temperature should be near or at ambient temperature. This would be a condition of low mechanical stress for most coatings. There could be some minor reactions taking place due to the fact that water does sit on the panels most of the night. Despite this data, in the J1960/J2527 protocol the panel temperature never cools to ambient. The typical minimum temperature in J1960/J2527 during the dark cycle is approximately 100 degrees F (38 degrees C). While it is known that it takes more water and more time for the actual horizontal surfaces of a vehicle to cool to ambient temperature than it does for a panel, those surfaces do eventually cool to ambient temperature. By not allowing panels to cool to ambient temperature during the J1960/J2527 process, there are undue mechanical stresses placed on coatings not present in real field conditions. While it is known that water penetration into the coating film is minimized at lower temperatures, the dark plus spray at 100 degrees F (38degrees C) in J1960/J2527 is still not sufficient to saturate the coating film with water and to produce humidity related defects.
Another issue is the fact that in J1960/J2527 the spray during the light cycle occurs at maximum temperature, with the panels still being heated to maintain a temperature higher than ambient during the spray. In contrast, the weather data from Florida shows an approximate 20 degrees C drop before a typical rain event takes place. Typically clouds form first and the panel temperature drops before rain occurs. This simple fact is ignored by J1960/J2527. While one can argue that this is because there might be an instantaneous circumstance where water would hit a panel at 70 degrees C, this will happen very seldom under actual field conditions. Out of more than 30 hours of rainfall recorded by the weather station in Jacksonville, the panel temperature was over 100 degrees F (38 degrees C) for only 10 minutes (0.55%). This compares with over 40% for a J1960/J2527 test. Water hitting a coating surface at a lower temperature causes much less mechanical stress than when the panel at a higher temperature is sprayed with water. This data indicates that more water is needed at slightly lower panel temperatures in order for a sufficient amount of water to soak into the coating film without unnatural mechanical stresses to the film in the process.
Cycle Time
The cycle time also needs to be addressed. The generic weather data does show more than 50% light time in a summer in Florida. The average for the summer months is approximately 13.5 hours light, 10 hours dark. This translates into about 56% light, 43% dark. This might indicate that the 67/33-light/dark cycles in J1960/J2527 are not appropriate to match a Florida summer exposure. The current acceleration factor of a J1960/J2527 cycle is 8:1; meaning that one year of accelerated exposure is approximately equal to eight years of Florida exposure. It is hard to say at this point if an acceleration factor of 8:1 can actually be modified to match field results. It is obvious that the current process does not reflect actual field conditions. Table 6 summarizes those factors.
Conclusion
In light of these differences, it is quite obvious that a new test method needs to be developed for accelerated weathering exposure that better correlates to real field results for automotive OEM coatings. It is imperative in these days of constant change that better products will be needed in the coatings industry over a shorter amount of time. These products will need to demonstrate cost effectiveness as well as improved performance. In order to meet the increased industry demands, every laboratory test that is used needs to be reliable and provide excellent correlation to real field results. The current accelerated weathering tests for automotive coatings are definitely lacking in a number of areas, that need to be addressed so that more durable coatings can be provided to the industry in a time efficient manner.
Acknowledgements: A. St. Pierre, D. Campbell, H. Valatka, D. Barber, M. Garner and P. Jacobs are also recognized for their contributions to this paper.
Looking for a reprint of this article?
From high-res PDFs to custom plaques, order your copy today!


