Evaluation of Various Organic Color Pigments
Methods of pigment evaluation are described that should be useful for those formulating paint with organic pigment colors.
This report on the evaluation of 17 commonly used organic color pigments is of interest in several respects. First, it provides relevant test methods and procedures particularly suited to paint laboratories. Second, it reports the effects of more than two years weathering when all of these pigments were exposed side by side in an alkyd enamel formulation at two levels of color pigment loading. Third, by employing uniform pigment loadings throughout, comparisons of both durability and optical properties are facilitated. And fourth, the formula design keeps pigment loading equal between each tint formula and each deeper color formula for the same pigment; this permits the evaluation of the effects of pigment loading on gloss, viscosity and other properties.
Introduction
When organic coating formulation involves the selection of one or more organic color pigments, the performance characteristics and cost of the pigments chosen often determine, more than any other factor, the suitability of the coating for a particular purpose and its success or failure in the market. This work is intended to assist the formulator in making this important choice, by (1) suggesting procedures for comparative evaluation of pigments that are particularly suitable for use in paint laboratories, and (2) reporting the results of such an evaluation involving a broad group of organic color pigments commonly used in architectural, commercial and light-duty industrial coatings.(1,2)
Test results reported for each pigment will measure coating properties that are heavily influenced by the choice and concentration of the pigment employed, with each test involving an essential aspect of pigment performance.(3) References to specific test methods are included in the text where ASTM methods were used. Other test methods are described in Appendix I.
The present work is not intended to be comprehensive either in coverage of all pigment types or of all important aspects of pigment performance. Many of the pigments tested have limited application to high-performance coatings, as do some of our results derived from a single, solvent-based system. We did not consider the heat or chemical resistance of pigments, or the possible positive or negative synergistic effects of pigment blends.
Relative to selection of the kinds of data to be gathered and reported, it should be noted that a large amount of information related to the contents of this paper is available from publications by earlier investigators and pigment suppliers, but even this comprises only a part of the considerable accumulated art that informs the use of these pigments. Our focus was on demonstrating approaches to testing that would provide information not so readily at hand. Aspects of pigment performance such as the influence of pigment on rheology, gloss and relative dispersability were included because it was felt that useful test methods could be suggested. Also, comparative weathering data were developed by simultaneous testing of a wide range of organic colored pigments. Such results have not been reported in detail for this particular group of pigments.
 Credit: Lansco Colors and SSCT Credit: Lansco Colors and SSCT |
| Table 1 Click to enlarge |
Formulation of Experimental Enamels
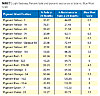
Pigment Selection
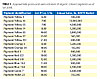
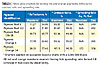
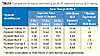
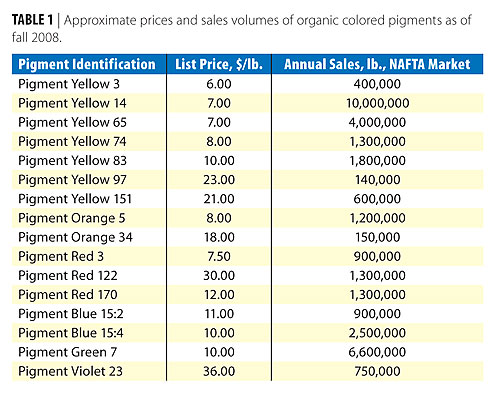
The pigments tested were selected to cover the color spectrum, to the extent that is practical, using types of pigments proven by industry experience to be commercially suitable for wide use in the coating categories previously mentioned. Each pigment was tested at two degrees of color depth, in high-gloss alkyd enamels, for optical and rheological properties, for solubility (bleeding) and for the effects of exposure to artificial and natural weather. The organic pigments used in the investigation are described below. For an estimate of the list price and North American sales volume of each pigment, as of autumn 2008, see Table 1.
Pigment Yellow 3, often referred to as a “10 G type”, is the greenest shade in the Hansa Yellow class. Its tendency to bleed and to migrate in baking enamels dictates its use primarily in water-based coatings and in some printing inks. It can, however, be used in air-dry solvent-based systems when testing indicates suitability.
Pigment Yellow 14, or OT Yellow, finds its market mostly in printing ink, with usage in plastic and rubber being limited by a temperature ceiling of 200 oC. The small amount that goes into coatings is mostly for low-end types such as drum enamels, with usage driven by low price per pound. The several grades offer different degrees of gloss, transparency/opacity and strength.
Pigment Yellow 65, a Hansa type, is the red shade, lead-free yellow that predominates in traffic-marking paint, which accounts for its largest market, by far. Lower cost and superior durability have permitted it to replace Yellow 75 in this application. Surface treatments to make it Cowles dispersible can be designed for either solvent or water systems.
Pigment Yellow 74, another Hansa type, is available in unstabilized transparent types, or alternatively, in redder shade, weaker, more opaque and weatherfast types, stabilized against recrystallization. The stabilized pigments are used primarily in coatings, with the largest volume going into universal colorant systems as the exterior yellow. The unstabilized types are employed in interior coatings and printing inks.
Pigment Yellow 83 is also offered in opaque and in semi-opaque or transparent types. The opaque types, slightly more weatherfast in deep shades although both types perform well, were designed as a lead-free replacement for medium chrome yellow. Common usage for both types is in liquid and powder coatings for the general industrial market. Semi-opaque types are stronger. Use in plastics and rubber is limited by a maximum service temperature of 200 ºC. Highly resinated, very transparent types are used mostly in printing ink, where brilliant gold shades may be achieved by printing on metal.
Pigment Yellow 97, a monoazo FGL type, is a bright, greenish to mid-shade, yellow with useful opacity and color strength and good light and weatherfastness in masstone and tint. In universal color systems its weatherfastness is somewhat superior to Pigment Yellow 74, but, by consensus of users, this does not justify its higher cost. Consequently it has been replaced in this application. Its tendency to bleed in enamels baked over 180 ºC accounts for its use primarily in air-dry systems.
Pigment Yellow 151, a benzimidazolone H4G type, has a clean, greenish-yellow shade and generally very good performance properties that include weatherfastness and good flow and gloss in highly loaded formulas. Accordingly, it is commonly chosen for high-grade general industrial coatings including some well-known name colors such as John Deere Yellow. In automotive coatings, Pigment Yellow 154 is usually selected instead because it has a similar shade and better UV properties. A limitation on Pigment Yellow 151, preventing its use in powder coatings, is that in strong alkaline systems the color may shift and UV resistance be diminished.
Pigment Orange 5, or DNA Orange, has long-established, extensive usage in solvent-based air-dry coatings and in water-based coatings and printing inks. As a relatively clean, bright orange with good weatherfastness, useful opacity and favorable pricing, it is the pigment of choice for many industrial coating applications. However, in baking enamels it will bloom and bleed, and its economic attractiveness sometimes leads users to push the limits of where it should be used.
Pigment Orange 34, a pyrazalone orange RL-70 type, is offered in a standard grade that is suitable only for interior applications, but also in a redder but weaker opaque type that has good weatherfastness in masstone (although not in tint) and is one of the most opaque dry colors on the market. It is recommended as a lead-free replacement for molybdate orange in industrial coatings. Opaque Orange 34 is the pigment of choice when Pigment Orange 5 does not meet performance requirements. When opacity is the criterion, the two pigments are economically competitive.
Pigment Red 3, or toluidine red, comes in light, medium and dark shades, all of which offer very good weatherfastness in masstone, at an attractive price. This combination of properties leads to its common use in “barn red” and some traffic marking applications. Its poor bleed resistance limits it to air-dry systems, and this limitation also accounts for infrequent success when attempts are made to substitute Pigment Red 3 for Pigment Red 170. A decline in the price of Pigment Red 170 has made these efforts less attractive.
Pigment Red 122, or quinacridone magenta, is available in transparent types employed in automotive metallic finishes, and in opaque types widely used as an exterior blue shade red in universal colorant systems. Both types of Red 122 are frequent choices in many coating, printing ink and plastic products. FDA-approved grades are used for plastic food packaging.
Pigment Red 170, a naphthol red F5RK-A type, is a workhorse for general industrial liquid and powder coatings including automotive applications requiring less than the ultimate UV resistance. It has some low-temperature plastics applications. It comes in a yellow shade and a blue shade.
Pigment Blue 15:2, or phthalo blue red shade, non-crystallizing, non-flocculating (NCNF), is used in industrial liquid and powder coatings including automotive, and in printing inks and plastics. Additives incorporated in or on the pigment confer the NCNF properties, stabilizing against reversion to a greener shade, by crystallization in strong solvents, and against the appearance of separation into blue and white pigment by flocculation, especially when used in universal color systems. However, no manufacturer will ensure the stability of his product in every system, so testing in specific systems is very important.
Pigment Blue 15:4, or phthalo blue green shade NCNF, is used largely in solvent-thinned printing inks, as well as in industrial coatings including automotive.
Pigment Green 7, or phthalo green, is available in yellower and bluer shades and is used in coatings of all types and in printing inks and plastics. An FDA-approved grade can be used in food packaging.
Pigment Violet 23, or carbazole violet, is an intense red shade blue pigment available in somewhat different degrees of redness and in several grades designed for specific processing and performance requirements. It is often used at very low levels to tint whites to provide a blue undertone for brighter appearance. It is used in coatings, printing inks and plastics although its hard texture and high cost limit its acceptance. Also, at low concentrations in solvent systems it has a tendency to flocculate.
 Credit: Lansco Colors and SSCT Credit: Lansco Colors and SSCT |
| Table 2 Click to enlarge |
Enamel Formulation
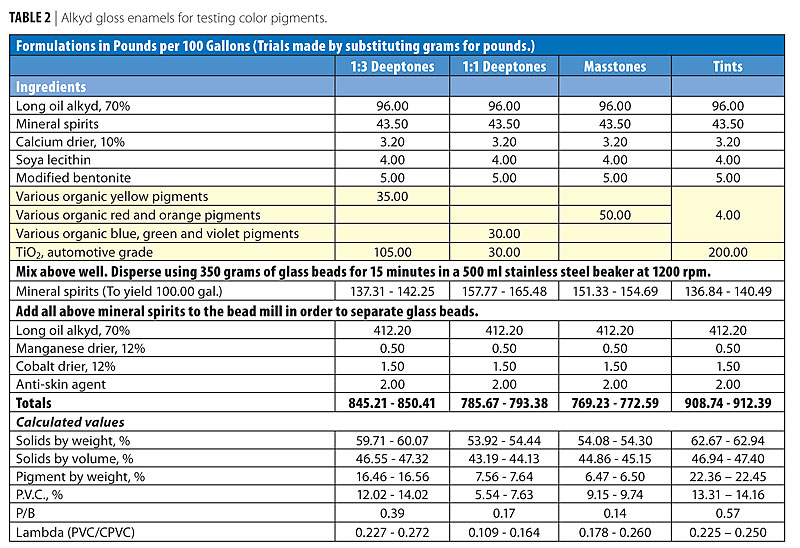
In planning the present work, paint formulations and manufacturing procedures were chosen to represent current U.S. industry practice in the pertinent market segments. We employed enamel based on a long-oil alkyd resin, similar to formulations widely used. This type of paint finds frequent application as ready-mixed color (most often in masstone or deeptone), and also certain of the pigments tested find considerable use in tinting colors for in-store color systems. A high-gloss formulation was chosen because the use of dry organic color pigments in masstone and deeptone (other than in tinting systems) is largely limited to gloss finishes. Enamel formulas are shown in Table 2.
All of the raw materials used are in common use by the U.S. paint industry. In no case were materials chosen based on requirements of the pigments being tested. Therefore, the performance of these pigments, except where pigment solubility is a factor, may reasonably be expected to be similar in other systems.
Pigmentation
Two enamels were prepared with each color pigment. One was a deep color, either masstone or deeptone. The other was a much lighter color, designated as a tint. The depth of color of the first enamel varied, with masstone (color pigment alone) being used for some pigments and deeptone (color pigment combined with titanium dioxide either 1:1 or 1:3 by weight) for others.
For each pigment, the choice between masstone, 1:1 deeptone and 1:3 deeptone was based on practical considerations imposed by pigment characteristics. Masstones were used whenever the color displayed, and pigment opacity, permitted it, because it is well known that this usually enhances color fastness. However, some pigments appear essentially black when used in masstone, and require combination with TiO2 to properly exhibit the true color. Conversely, some are used in deeptones to overcome their very low opacities without unacceptably altering the color produced. The depth of color of the tint was, in every case, achieved by using a ratio of 1:50, color to TiO2.
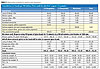
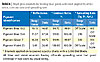
All enamels of the same color concentration – masstone, 1:1 deeptone, 1:3 deeptone, or tint – contained equal weights of pigment per unit of enamel volume, regardless of the color pigment used. Specifically, in 100 gallons of enamel, pigment loadings were 50 pounds of color pigment in masstones, 30 pounds of color pigment with 30 pounds of TiO2 or else 35 pounds of color pigment with 105 pounds of TiO2 in deeptones, and 4 pounds of color pigment with 200 pounds of TiO2 in tints.(6,7) As discussed in the following paragraph, this uniformity in pigment loading facilitated evaluation of the relative effects of the different pigments on viscosity, opacity and gloss.
The pigment loadings were chosen as useful and practical averages for the entire pigment group, based on the balance of opacity and cost, and on the effects of pigmentation on other enamel properties. This included an attempt to achieve, as nearly as possible, equal binder demand between the deep color and the tint for each pigment tested, by equalizing the pigment volume value known as Lambda. (Details are in the next paragraph.) Test results should provide guidance to formulators for adjusting loading of a specific pigment in a formulation, a task that is both important and demanding when working with organic color pigments. Although, ideally, all paints should have adequate opacity to provide excellent hiding power in not more than two coats, in practice some pigments cannot be used at sufficient loading to provide such opacity, particularly in masstone. This may be because of cost, but quite often it is due to high viscosity, poor leveling or low gloss caused by excess dispersed pigment.
The value Lambda, computed approximations of which are shown in Table 2 for the enamels used in this study, is defined as the ratio of the pigment volume concentration (PVC) of a coating, to the critical pigment volume concentration (CPVC) for that same coating. Thus Lambda represents the degree to which PVC approaches CPVC, and if two formulas made using the same binder (such as a deeptone and a tint enamel pair in the present work) have equal Lambda values, their pigmentations should have equal binder demand. Properties such as viscosity and gloss should be similar. Approximations of Lambda are computed using oil absorption or related data for each individual pigment. For these approximations to be useful, dispersions must be of good quality and the degree of dispersion must be similar.(4,5)
Pigment Dispersion
A method of pigment dispersion is described in Table 2 and in Appendix I that is quick, simple and effective but that permits duplication of dispersive energy input in duplicate batches, and very similar input when different pigments are dispersed in otherwise similar formulations.
There are two alternatives in using this method. One is to disperse all trial paints for an equal amount of time, and draw conclusions as to ease of dispersion of the pigments by comparing fineness of grinds achieved. This was the approach adopted in the present work, except in one case where a very difficult-to-disperse pigment (carbazole violet) required additional time to achieve a usable dispersion.
The second alternative is to use additional dispersion times, as necessary, to reach essentially equal fineness of grind for all pigments being evaluated. At the cost of considerably more time required for paint preparation, this approach permits more accurate comparisons of gloss and opacity, while still allowing evaluation of ease of dispersion by comparison of dispersion times required for the different pigments.
To determine fineness of grind at intervals during dispersion, advantage can be taken of the fact that it is always necessary to prepare a larger mill paste than will actually be needed for the paint being compounded, in order to separate the glass beads and still have adequate mill paste. Also, where several paints are being prepared that have essentially identical letdowns, use of a master batch letdown will be the logical approach. This situation allows small samples to be separated from the mill paste at intervals, thinned with proportionate amounts of the letdown master batch, and tested for fineness of grind, without excessively depleting the available mill paste or letdown.
 Credit: Lansco Colors and SSCT Credit: Lansco Colors and SSCT |
| Table 3 Click to enlarge |
Evaluation of Experimental Enamels
Initial Testing
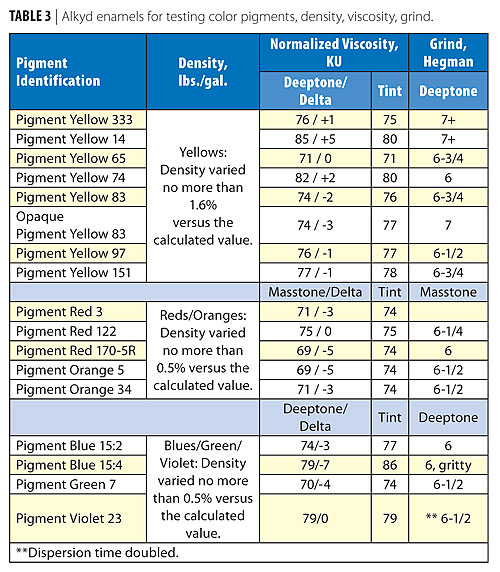
Density, viscosity and fineness of grind were measured on each trial batch (ASTM D 1475, ASTM D 562, ASTM D 1210) to assure valid test results by confirming proper compounding. Viscosity is further discussed below. Fineness of grind and time of dispersion are, of course, also indicators of ease of dispersion, although this will depend on the liquid composition used for dispersion, and thus on the type of coating being produced.
Normalizing of Data for Alkyd Viscosities
Practical considerations prevented the use of the same batch of commercial alkyd resin solution in the preparation of all enamels. This caused small differences in viscosity. Since viscosity was one of the enamel characteristics to be used to measure the effects of different pigments on physical properties of coatings, a normalizing calculation was necessary on each enamel batch. Correction factors were derived by comparing the mean viscosity values of groups of enamels in which the same alkyd batch was used throughout. To minimize the influence of the various individual pigments, only data from the tints were used. Normalized data were treated as though all batches had been prepared from the same alkyd batch. For details of calculations to normalize viscosities, see Appendix I.
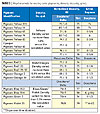
Calculation of Delta Viscosity Values
Values in Table 3 that are labeled as “Delta” and appear after the slash in the third column were computed by subtracting the viscosity of the enamel tint from that of the deeptone or masstone enamel. This viscosity difference (Delta viscosity) thus represents the effect on enamel viscosities, positive or negative, of any difference in binder demand between masstone/deeptone and tint. Comparisons of this effect can then be made between different color pigments, provided deeptone or masstone enamels made with the pigments being compared have the same color:TiO2 ratio and similar degrees of dispersion. Note the importance here of the experimental design with equal pigment loadings of the different pigments.
Viscosity and Pigment Loading
Since it is desirable to obtain high pigment loading for good opacity, tests were run that indicate relative pigment loading potential. These included measurements of viscosity at certain points in the preparation and aging of each enamel batch, with lower viscosity indicating a potential for higher pigment loading.
The previously discussed strategy of using equal loadings of pigments was applied first to viscosity. The tinted enamels, regardless of color, were the viscosity standard for comparison, since the preponderance of TiO2 in their pigment loadings assured that pigment effects on viscosity would be similar throughout. By comparing viscosities of the deep-colored enamels, each to its own tint and each to all other pigments having the same concentration of color in the formula, it may be possible to estimate potentials for higher pigment loadings within each of the two deeptone groups (color:TiO2 ratios of 1:1 and 1:3) and within the masstone group.
Optical Properties
 Credit: Lansco Colors and SSCT Credit: Lansco Colors and SSCT |
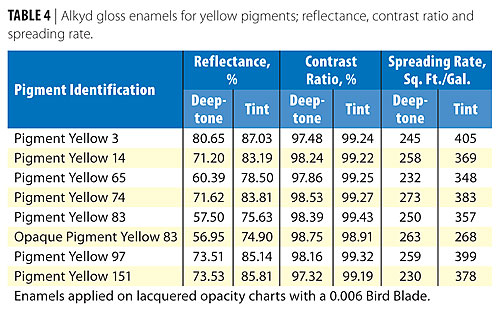
| Table 4 Click to enlarge |
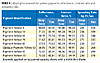
Instrumental color measurements were made using a Microflash instrument, and color difference units from the CIELAB scale. Reflectance (ASTM E 308), opacity (ASTM D 2244 – measured as contrast ratio) and color coordinates were calculated. The color characteristics of a pigment, described by reflectance and color coordinates, determine its usefulness and commercial value relative to pigments of similar color. Value increases, in general, with increased opacity and/or cleaner, brighter color.
Spreading Rate
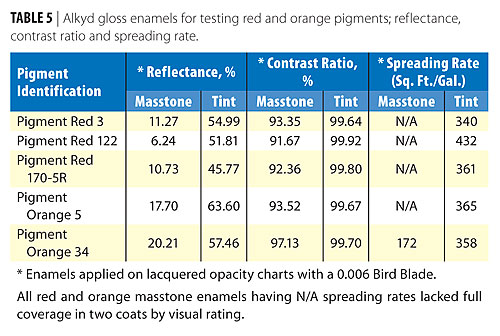
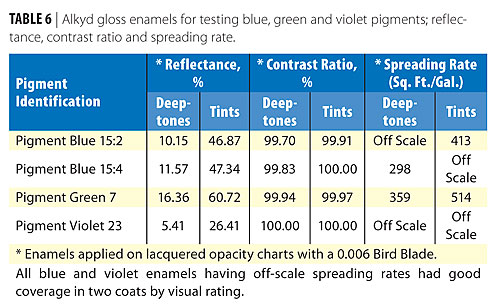
An approximation of spreading rate of enamel, in square feet per gallon at complete opacity, is shown for most of the enamels in Tables 4, 5 and 6. These values were determined, where possible, by a simplification of ASTM D 2805 - 80, Hiding Power of Paints by Reflectometry.
 Credit: Lansco Colors and SSCT Credit: Lansco Colors and SSCT |
| Table 5 Click to enlarge |
This method is subject to possible errors in estimation of film thickness and in determination of reflectivity. However, it should provide good approximations of spreading rates at complete opacity, for enamels that 1) have Y tristimulus values (i.e., reflectances) greater than 15%, and that 2) yield contrast ratios, at 6 wet mils film thickness, of very close to 98%. Spreading rates are not shown for enamels that did not meet these criteria.
Opacity and Pigment Loading
Since pigment loadings at comparable color concentrations were equal, contrast ratio data provided a means of ranking the opacities of the different pigments. Also, by taking complete coverage at a wet film thickness of 6 mils (about two coats of enamel) as indicative of a desirable degree of opacity, those color pigments were identified for which additional pigment loading would be desirable.
Gloss
Maximum gloss in a coating of this type generally adds to the aesthetic value of the coating. Alternatively, pigments that give higher gloss may allow formulation at lower cost by permitting use of extender pigment to increase PVC; if total volume of solids is held constant, cost is reduced while maintaining gloss equal to that obtainable with an alternative color pigment that gives lower gloss. All enamels were tested for 20º and 60º gloss (ASTM D 523).
Those pigments having appreciable effect on gloss could be identified by comparing each deeptone or masstone enamel gloss to the gloss of the tint of the same pigment. Also, some comparison of gloss developed with different pigments may be possible, where deeptones or masstones have equal pigment loadings and can be compared. Like viscosity, gloss can be a useful indicator of potential for additional pigment loading.
 Credit: Lansco Colors and SSCT Credit: Lansco Colors and SSCT |
| Table 6 Click to enlarge |
Solvent Bleed Resistance
Some pigments can cause problems due to solubility in specific solvents, resulting in the tendency for color to bleed into overcoats containing such solvents. Since bleeding problems can remove a pigment from consideration for use in multi-coat systems, bleeding was evaluated using white overcoats containing three different solvent combinations.
Enamels were applied to lacquered charts by a 6 mil Bird blade applicator, and allowed to dry thoroughly under ambient conditions. Three white overcoats, each containing 2.6 pounds TiO2, were prepared using formulas that can be briefly described as follows:
1) Enamel based on a vinyl-toluene copolymer and only aliphatic hydrocarbons as solvents.
2) Enamel based on a chain-stopped short-oil alkyd resin and only aromatic hydrocarbons as solvents.
3) Gloss lacquer based on an acrylic resin and a solvent blend of aromatic hydrocarbon, propylene glycol methyl ether acetate and methyl ethyl ketone. Overcoats were toned with black to increase opacity. For details of the formulas for overcoats, see Appendix II.
Each overcoat was applied by a 6 mil Bird blade over a portion of each colored enamel chart. Also, the three overcoats were similarly applied over white lacquered paper charts in order to obtain the true color of each overcoat without influence from bleeding or color of substrate. After all overcoats had dried for 48 hours, color coordinates were measured and color differences (i.e., Delta E) were calculated between the same overcoats applied over the white lacquered charts and over each enamel. Errors due to incomplete coverage were essentially eliminated by the high opacity of the white overcoats and the thick films in which they were applied.
Exterior Performance
Accelerated weathering, often used to predict the ability of a coating to withstand exterior exposure, was included in this study, with emphasis on fading (ASTM D 4587). Coated panels were exposed to continuous ultraviolet radiation (UV-B), in a QUV cabinet, for at least 1000 hours at elevated temperature.
 Credit: Lansco Colors and SSCT Credit: Lansco Colors and SSCT |
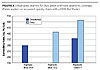
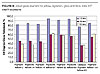
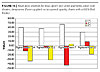
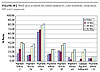
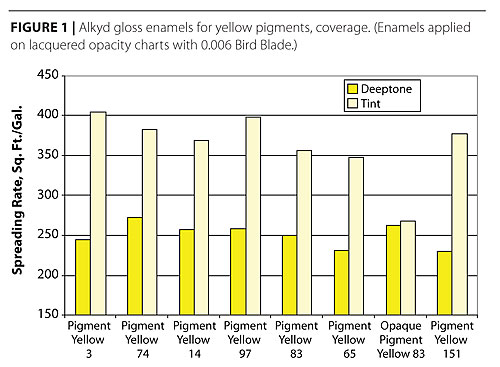
| Figure 1 Click to enlarge |
Natural weathering is the ultimate method for evaluating durability of coating systems. In the United States, data are commonly obtained from exposure in the southern states where ultraviolet radiation is more intense and temperatures are higher. Accordingly, panels were exposed in August 2003, in rural Georgia facing south at 45º to the horizontal. Each panel consisted of one coat of enamel, applied with a #60 wire-wound rod on a 6-inch-by-12-inch aluminum panel. Panels were allowed to air dry for 7 days and measured at three points on each panel for color and gloss, before exposure. Panels were examined and color and gloss measured at appropriate intervals.
 Credit: Lansco Colors and SSCT Credit: Lansco Colors and SSCT |
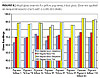
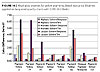
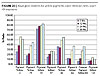
| Figure 2 Click to enlarge |
Only a few pigments were exposed in masstone and the deepest color exposed in many cases contained three parts of TiO2 to one part of color pigment. All deeptone colors, including those containing equal weights of color pigment and TiO2, actually should be considered as deep tints for the purpose of evaluating light-fastness. It is quite likely that many of these color pigments would show significantly greater light-fastness if exposed in masstone.
Results and Discussion
 Credit: Lansco Colors and SSCT Credit: Lansco Colors and SSCT |
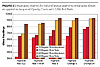
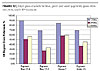
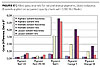
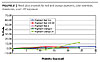
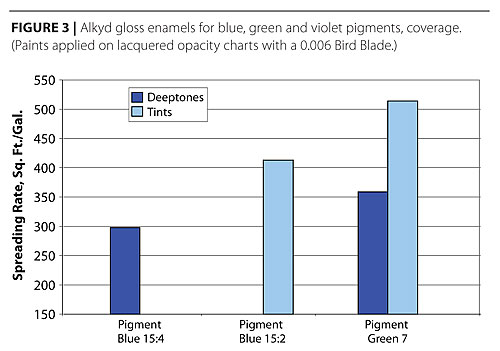
| Figure 3 Click to enlarge |
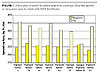
Generally, lower reflectance equates to higher deeptone opacity, and higher opacity in tints indicates higher tinting strength. These generalities were illustrated by the performance of the two versions of Pigment Yellow 83 that were tested: a brighter standard grade and a slightly less bright “opaque” grade. The latter exhibited superior opacity in deeptone, relative to the brighter grade, but its low tinting strength made it the only yellow pigment tested that showed no significant increase in opacity for the tint relative to the deeptone.
 Credit: Lansco Colors and SSCT Credit: Lansco Colors and SSCT |
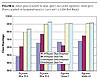
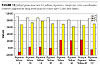
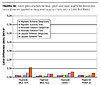
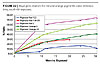
| Figure 4 Click to enlarge |
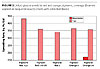
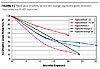
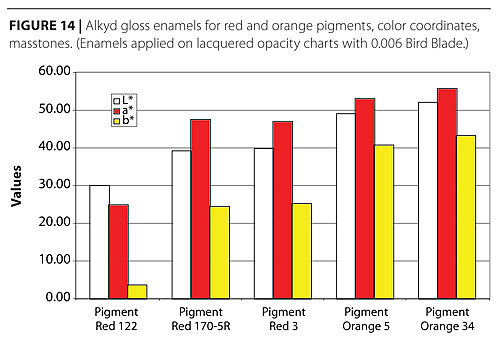
In Table 5 and Figure 2, the only red or orange pigment that exhibited full visual coverage in two masstone coats and had a high enough contrast ratio to permit calculation of coverage was Pigment Orange 34. Tints were much more opaque. The relatively high coverage of Pigment Red 122 in tint is somewhat of an anomaly but indicates high tinting strength. Note that this was true despite a rather poor degree of dispersion, so tinting strength of a better quality dispersion could have been even higher.
Gloss and Gloss Retention
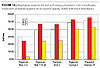
 Credit: Lansco Colors and SSCT Credit: Lansco Colors and SSCT |
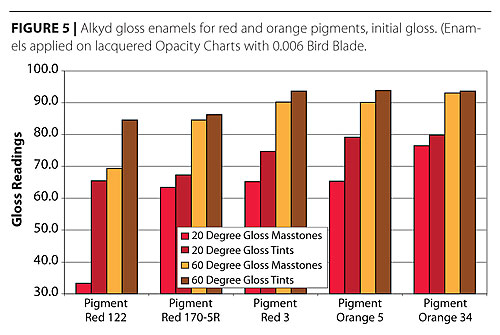
| Figure 5 Click to enlarge |
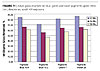
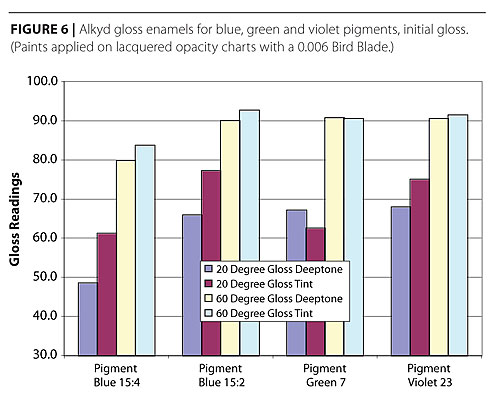
Initial gloss values measured at 20º, in Figures 4, 5 and 6, provide greater distinction between the performance of different pigments than do 60º data and show that with the exception of Pigment Yellow 14 and Pigment Green 7, the higher concentration of color pigment in deeptones and masstones detracts from initial gloss compared with the corresponding tints.
 Credit: Lansco Colors and SSCT Credit: Lansco Colors and SSCT |
| Figure 6 Click to enlarge |
The low gloss of Pigment Red 122 was probably related to poor dispersion.
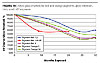
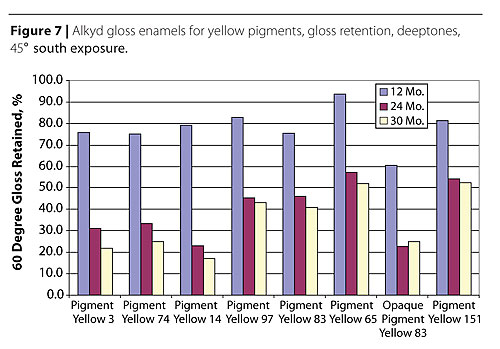
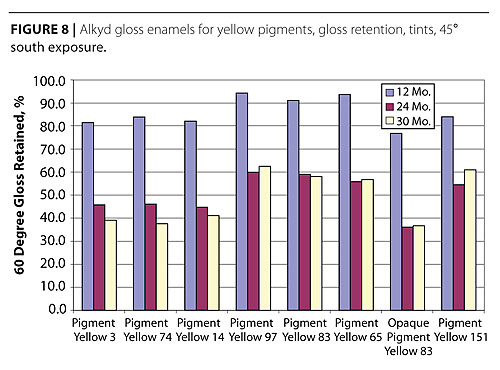
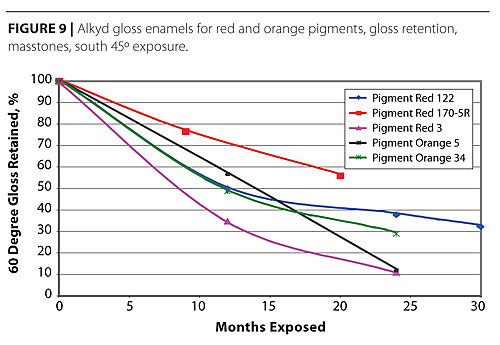
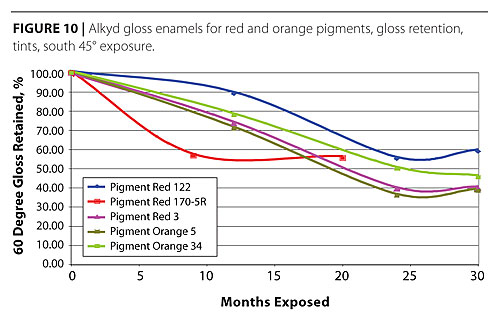
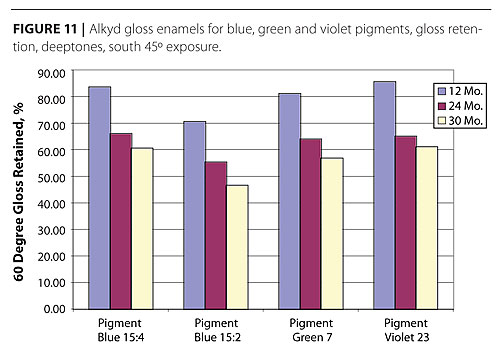
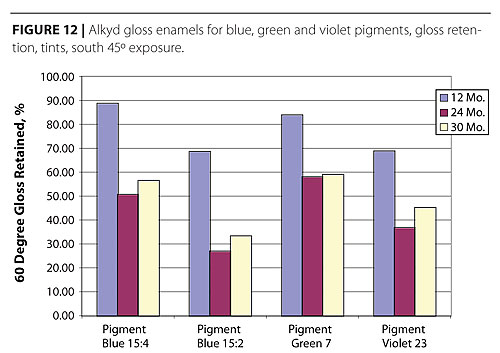
The data for gloss retention after weathering, for masstones/deeptones in Figures 7, 9 and 11, and for tints in Figures 8, 10 and 12, show that yellow and red tints are generally superior to the masstones/deeptones, with the reverse being true of the blues, greens and violets except that Pigment Green 7 performs about equally in deeptone or tint.
 Credit: Lansco Colors and SSCT Credit: Lansco Colors and SSCT |
| Figure 7 Click to enlarge |
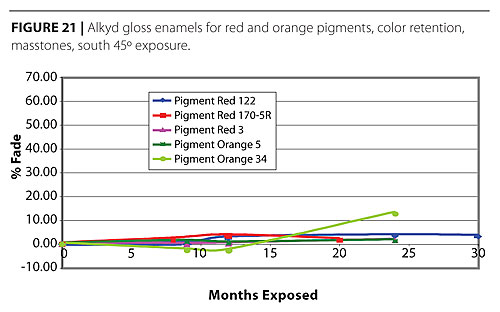
The panels used to expose Pigment Red 170 were required for other purposes and removed after 20 months, at which time this pigment was performing the best of the reds and oranges.
Pigment Red 122 also performed well in masstone and tint.
 Credit: Lansco Colors and SSCT Credit: Lansco Colors and SSCT |
| Figure 8 Click to enlarge |
Initial Color
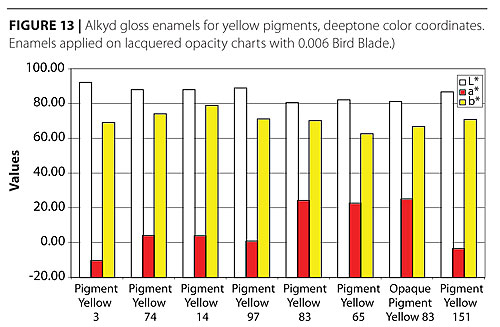
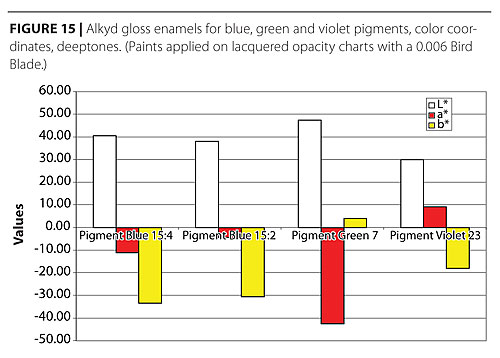
For interpretation of the color coordinates in Figures 13, 14 and 15, a lower value of L* indicates muddier color; a higher a* value indicates redder shade or more intense red; a higher b* value indicates yellower shade or more intense yellow.
In the case of the blues, the green and the violet, the same principle applies but one or both of the a* and b* coordinates are negative.
 Credit: Lansco Colors and SSCT Credit: Lansco Colors and SSCT |
| Figure 9 Click to enlarge |
The data show the exceptional brightness and intensity of Pigment Yellow 14, the blue shade of Pigment Red 122 and the similarity in color of Pigment Red 170 to Pigment Red 3, and of Pigment Orange 5 to Pigment Orange 34.
Bleed Resistance
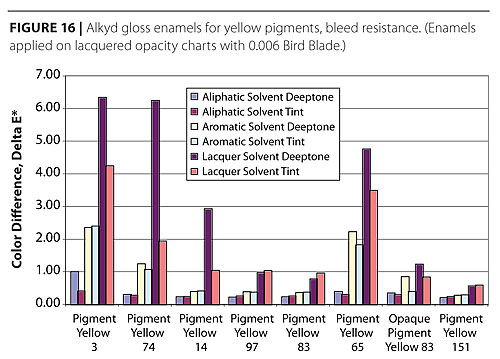
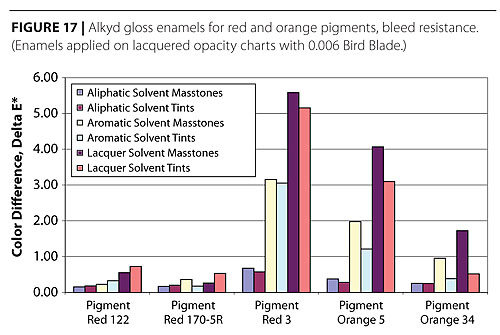
The bleeding data in Figures 16, 17 and 18 show distinct differences, with some tints bleeding more than might be expected.
 Credit: Lansco Colors and SSCT Credit: Lansco Colors and SSCT |
| Figure 10 Click to enlarge |
This result warns against the use of such pigments for shade adjustment in color matching. Pigments Yellow 3, 65 and 74, and Pigment Red 3 and Pigment Orange 5 are bleeders.
Pigments Yellow 83 (both grades), 97 and especially 151 are quite resistant to bleeding. Bleeding increases as would be expected, from aliphatic to aromatic to lacquer solvent.
 Credit: Lansco Colors and SSCT Credit: Lansco Colors and SSCT |
| Figure 11 Click to enlarge |
Film Failure
The exposed films containing Pigment Orange 5 and Pigment Red 3 in masstone failed by cracking and peeling before completion of the 30 month test.
This failure is evidence that the pigment failed to protect the binder from ultraviolet degradation.
It provides a caution concerning the types of application in which these pigments may be expected to perform successfully.
 Credit: Lansco Colors and SSCT Credit: Lansco Colors and SSCT |
| Figure 12 Click to enlarge |
An alternate choice of binder might produce different results. Films containing the corresponding tints did not fail.
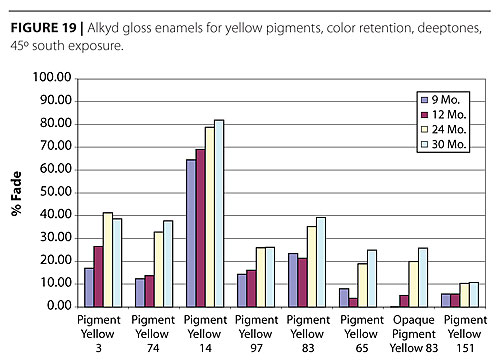
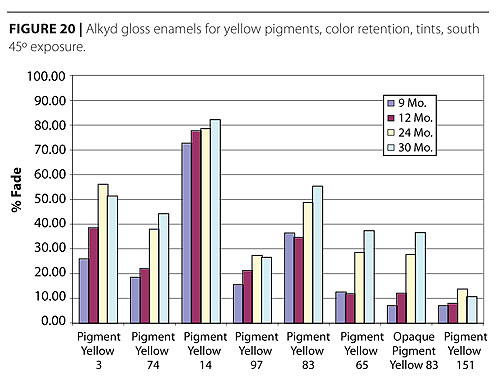
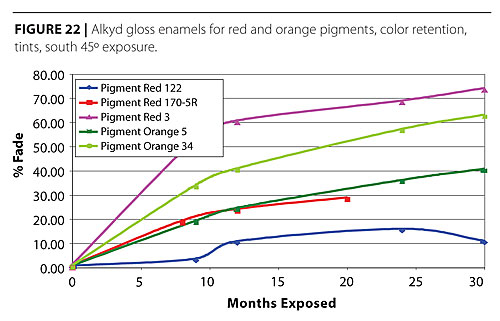
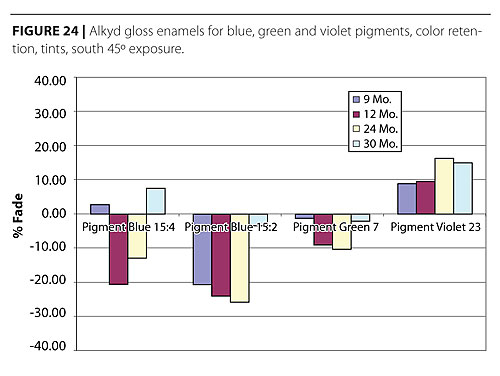
Similarly, Figures 20, 22 and 24 show fading of the corresponding tints.
This calculated value agrees well with visual observation, whereas the numerical color difference, Delta E, between initial and weathered colors, does not.
 Credit: Lansco Colors and SSCT Credit: Lansco Colors and SSCT |
| Figure 13 Click to enlarge |
To obtain percent fade, Delta E was calculated versus “pure white” for each initial color and for each exposed color, where “pure white” was taken as having an L* value of 100.00 and a* and b* values of zero.
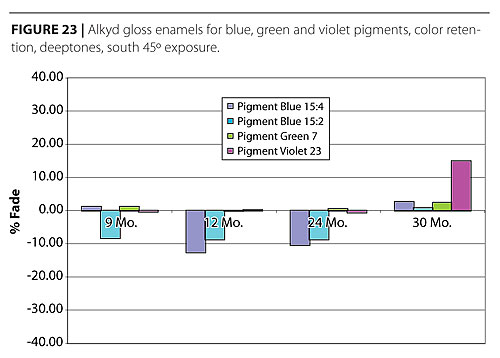
It must be understood that since the quantity shown is the degree of fade toward pure white, values of the data increase with more severe fade, so that a high value indicates poor color retention. When colors darken with exposure, they increase in intensity, producing a negative percent fade.
 Credit: Lansco Colors and SSCT Credit: Lansco Colors and SSCT |
| Figure 14 Click to enlarge |
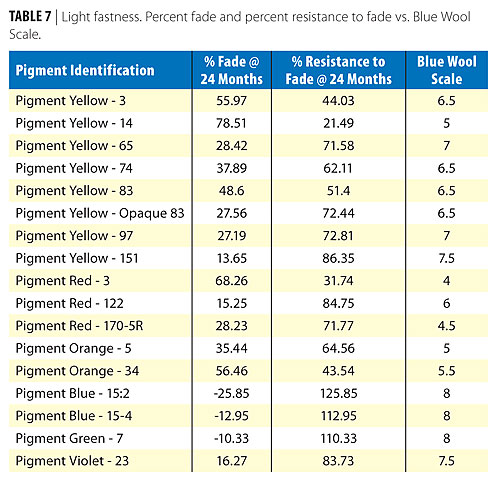
This approach to evaluation of resistance to fading is believed to be a significant improvement over the previously used Blue Wool Scale. It will now be further considered and an alternative and perhaps more intuitive method of reporting the percent fade data will be suggested. First, however, the question of correlation with the Blue Wool Scale, and hence with previously published data, must be examined.
 Credit: Lansco Colors and SSCT Credit: Lansco Colors and SSCT |
| Table 7 Click to enlarge |
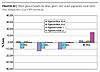
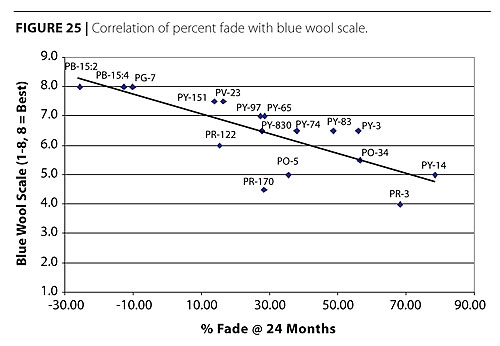
Fading data from the literature7,9 based on the Blue Wool Scale and employing the same pigments at the same concentrations as those exposed in the present study, are plotted in Figure 25 against percent fade for tints. The data are tabulated in Table 7.
 Credit: Lansco Colors and SSCT Credit: Lansco Colors and SSCT |
| Figure 15 Click to enlarge |
All data are for 24 months of weathering exposed at 45o south. Figure 25 shows a general linear negative correlation. Statistically, Spearman’s Rank Correlation Coefficient is -0.78. This statistic is useful when the units of measurement for two sets of data cannot be converted to agree, which was the situation here. It was expected that any correlation would be negative because the Blue Wool Scale measures resistance to fade, versus percent fade on the other axis. This relatively high correlation roughly agrees with the visual impression from Figure 25.
 Credit: Lansco Colors and SSCT Credit: Lansco Colors and SSCT |
| Figure 16 Click to enlarge |
Some sources of disagreement between the two methods are predictable. The weathering data derive from exposures conducted at different times and locations. Also, the Blue Wool Scale method is very subjective, and the assignment of values is difficult when it involves faded colors that differ greatly from the color of the visual standards. This and other sources of disagreement actually argue for the superiority of the percent fade method. Another is that the upper limit of the Blue Wool Scale is the original color before weathering, so it cannot accommodate the darkening of colors during weathering, such as occurs with phthalocyanine blues and greens.
 Credit: Lansco Colors and SSCT Credit: Lansco Colors and SSCT |
| Figure 17 Click to enlarge |
However, the percent fade method does measure the degree of darkening, producing negative values, so these values are necessarily plotted against the maximum value of 8.0 on the Blue Wool Scale, which is equivalent to a percent fade of zero. Thus an artifact is created which interferes with the correlation. Furthermore, a comparison of the measure of degree of fade of two red pigments, by the two methods, illustrates the limitations of the Blue Wool Scale. Pigment Red 170 is well known to be markedly superior in tints to Pigment Red 3, but this difference is quite small as measured by the Blue Wool Scale, whereas it is much more nearly in agreement with experience, as measured by percent fade.
 Credit: Lansco Colors and SSCT Credit: Lansco Colors and SSCT |
| Figure 18 Click to enlarge |
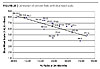
In Figure 26, the previously mentioned alternative method for display of percent fade data is illustrated. Each percent fade value is subtracted from 100, yielding a percentage measure of resistance to fade, rather than a direct measurement of degree of fade. The data are shown in Table 7. When the data are expressed in this way, correlation with the Blue Wool Scale is numerically the same but is positive, and darkening of color during exposure leads to values for percent resistance to fade that exceed 100, rather than negative values. Expressed this way, the data may be more easily related to visual impressions.
In any case, more data are needed in order to fully evaluate the correlation of the percent fade method with previously used methods of evaluating fading. We hope that other investigators will provide the necessary data and perhaps establish percent fade as an improved approach to this kind of measurement.
Tabulated Summary of Test Results
 Credit: Lansco Colors and SSCT Credit: Lansco Colors and SSCT |
| Figure 19 Click to enlarge |
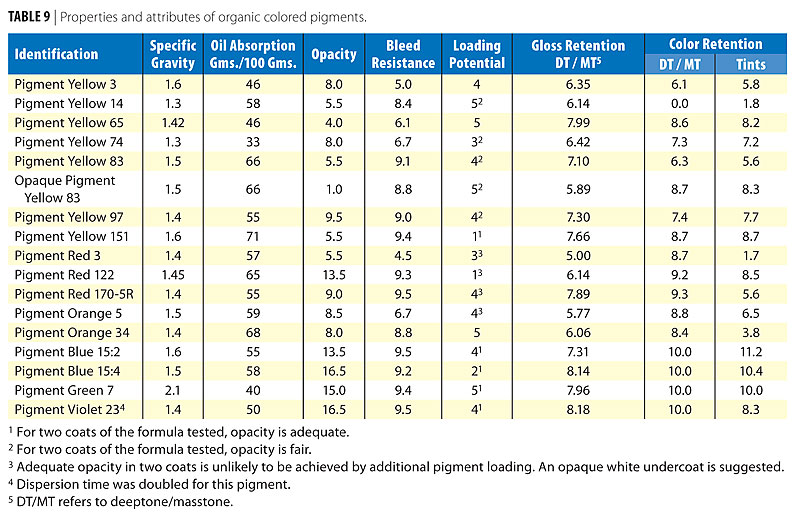
Table 9 summarizes the results of our pigment testing and also shows pigment specific gravity and oil absorption data from the literature.6, 7, 8 In several columns, rating systems have been used to indicate individual pigment performance relative to the other pigments tested or else in terms of an estimate of the degrees of specific kinds of usefulness of various pigments. These rating systems are explained below.
Rating of opacity is based on contrast ratios and spreading rates for deeptones and tints. A simple ranking system employs a scale on which the best performance in each color group has been rated “8” and the poorest rated “0”.
 Credit: Lansco Colors and SSCT Credit: Lansco Colors and SSCT |
| Figure 20 Click to enlarge |
Rating of resistance to bleeding is based on Delta E values for overcoated films of both deeptones and tints, using data from all three topcoats containing different solvent systems. The poorest (Pigment Yellow 3) showed potential for overcoating with aliphatic solvent systems and therefore has been assigned a rating of “5” where the rating “10” would correspond to a theoretical pigment with perfect bleed resistance. Other pigments were rated relative to this scale. In general, pigments bleed most severely in lacquer solvent, next most in aromatic and least in an aliphatic system. Therefore a pigment with a moderate bleed rating would probably be ruled out for overcoating with lacquer, but might be suitable (with testing) for overcoating with another type of solvent system.
Potential for additional pigment loading is based on a scale of “1” (low) to “5” (high), derived from the degree of pigment dispersion achieved, initial and normalized viscosities, and gloss.
 Credit: Lansco Colors and SSCT Credit: Lansco Colors and SSCT |
| Figure 21 Click to enlarge |
Ratings for gloss retention are based on percent gloss retained by deeptones and masstones. Pigment Red 3 was the poorest, but is known to be suitable for many applications. Therefore, it has been assigned a value of “5” and a perfect score of 100% gloss retention has been assigned a value of “10”. Other pigments are rated on this scale. Ratings are based on averages of gloss measurements taken after 9, 12 and 24 months.
Ratings for color retention are based on Delta E and percent fade. The poorest (Pigment Yellow 14) has been deemed to have little usefulness in exterior coatings and therefore has been assigned a value of “0”, with a theoretical prefect score (no color change) assigned a value of “10”. Thus a 0-10 scale has been developed. Ratings are based on averages of measurements taken after 9, 12 and 24 months.
 Credit: Lansco Colors and SSCT Credit: Lansco Colors and SSCT |
| Figure 22 Click to enlarge |
Conclusions
The primary focus of this work was to demonstrate and, to some extent, to develop, methods well adapted to typical paint laboratories, for evaluation of organic color pigments and for optimization of paint formulations that employ them. Test formulations can be designed and test methods selected, as demonstrated, to maximize the information obtained in proportion to the effort exerted. For ready comparisons, these formulations can employ uniform pigment loadings and similar proportioning of pigment to binder over a wide range of color pigments. In this way, it is not difficult to compare and optimize the impact of individual color pigments on viscosity and gloss.
 Credit: Lansco Colors and SSCT Credit: Lansco Colors and SSCT |
| Figure 23 Click to enlarge |
A method of pigment dispersion has been suggested that is quick, simple and effective but that permits duplication of dispersive energy input in duplicate batches, and very similar input when different pigments are dispersed in otherwise similar formulations. For pigments that are more difficult to disperse, it provides a rough measure of the additional effort involved.
The color retention method of measurement by calculating “percent fade” provides a quantifiable determination that offers considerably better correlation with visual observation than does a comparison of “Delta *E” values, and is less subjective than other commonly used methods.
 Credit: Lansco Colors and SSCT Credit: Lansco Colors and SSCT |
| Figure 24 Click to enlarge |
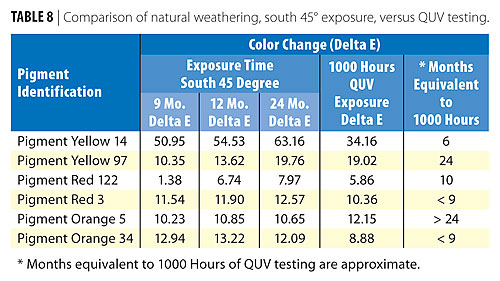
Accelerated testing for light fastness and gloss retention, by exposure to UV-B radiation in a QUV cabinet, was found to show very poor correlation with natural weathering. Considerable caution is recommended when using this equipment to evaluate color pigments for exterior durability.
Conclusions concerning pigment performance agree with those of many earlier investigators. They will be summarized here because doing so offers a concise review that includes a wide variety of organic colors.
A very broad range of colors and other properties is available in organic color pigments. Rarely, among the yellows, reds and oranges, does one pigment type provide all the necessary properties needed for a full range of coatings. This is true to a lesser extent for the blues, greens and violets.
 Credit: Lansco Colors and SSCT Credit: Lansco Colors and SSCT |
| Figure 25 Click to enlarge |
Organic yellows in particular, but also reds and oranges, generally have low opacity. Blends of these pigments with TiO2 provide much better coverage than darker or more intense colors. The opposite is true for blues, greens and violets.
The effects of higher pigment loading with organic colors, on viscosity and gloss, may limit the concentration of pigment that can be usefully added to a formulation.
Certain organic color pigments bleed to a significant or even severe degree when paint containing them is over-coated. Darker colors bleed the most, but even pastel tints were found in this study to bleed more than expected.
 Credit: Lansco Colors and SSCT Credit: Lansco Colors and SSCT |
| Table 8 Click to enlarge |
Some organic color pigments, when used in high ratios to other pigments, do a poor job of protecting paint films from the photochemical destructive effects of sunlight. Verification of the durability of such formulations is imperative. Alternative pigment choices or more durable resin systems may be required.
In addition to film durability, the choice of organic color pigment profoundly affects exterior color retention and gloss retention. In general, darker or more intense colors give better color retention than tints, with the reverse being true for gloss retention and film durability, but there are exceptions in both cases. The phthalocyanine blues and greens, and carbazole violet pigments, perform outstandingly in all respects.
 Credit: Lansco Colors and SSCT Credit: Lansco Colors and SSCT |
| Table 9 Click to enlarge |
Summary
Methods of pigment evaluation have been described that should be useful for those formulating paint with organic pigment colors, and we have illustrated the use of these methods by developing and reporting performance data for seventeen widely used pigments. Protocols for testing have been suggested that, when alternative organic pigment colors are being considered, will assist in pigment selection and formulation. The suggested approaches to testing can not only facilitate optimization of color fastness, gloss retention and bleed resistance, but can also help to maximize opacity without sacrifice of rheological properties or gloss.
As experienced formulators know, there is no “best pigment” in each color group. Any one of the pigments tested may become the preferred choice for a particular set of performance requirements. The goal of the formulator, toward which we hope we have provided an assist, is to utilize the best available pigment for the purpose at hand, and to arrive at the optimum combination of materials and production processes, by the most efficient means.
Acknowledgments
The SSCT Education Committee would like to thank the following for their contribution to this work:
- EC Pigments for furnishing pigment samples, defraying much of the cost and permitting this work to be published; John Combs, EC Pigments, for giving advice and guidance;
- John Rawe, Tennessee Technical Coatings Corporation, Jules Senentz, Jr., Sheboygan Paint Company, John Anspach, Induron Protective Coatings, Charles Carneal, Safety Coatings, Inc., and Steven Halliday, Marine-Industrial Paint Company, for helping select the pigments for evaluation;
- Millie Powell, Clariant Corporation, for furnishing pigment samples;
- Reichhold Chemicals, Inc. and Hexion Specialty Chemicals for furnishing resin samples; and
- J.M. Huber Corporation for the use of its QUV cabinets.
Appendix I: Methods of Batch Preparation, Test and Calculation
Method of Pigment Dispersion
As described in Table 2, pigment was dispersed by charging equal volumes of mill paste and glass beads to a 500 ml stainless steel beaker and agitating the mixture for 15 minutes on a laboratory high-speed disperser, using a 2-inch, 3-bladed impeller.
Fineness of Grind (or Fineness of Dispersion) of Liquid Paint, ASTM D 1210
Paint is spread by a scraper in a calibrated path that is tapered in depth from zero to 4 mils (100 microns). At some point in this path, depending on their size, particles and/or agglomerates in the paint are pushed up through the liquid surface by the sloping floor of the path, and become visible. The grind is read on the 0-to-8 Hegman scale, which parallels the path, where 0 represents the coarsest dispersion measurable and 8 represents no visible particles.
Density of Liquid Paint, ASTM D 1475
A calibrated weight-per-gallon cup allows weighing of a precise volume of paint in grams, with direct conversion to pounds-per-gallon. Paint is brought to 25 ºC before measurement. A cover prevents evaporation loss.
Viscosity of Liquid Paint Using Stormer Viscometer, ASTM D 562
This is the method most commonly used for measuring viscosity (consistency) of architectural and light industrial paints and coatings. With the paint at a temperature of 25 ºC, adjustable weights are used to drive an off-set paddle immersed in the paint, at a rotational speed of 200 rpm. Krebs units (KU) of viscosity are determined empirically from the weight required. A stroboscopic timer may be used to facilitate control of the rotational speed of the paddle.
Data Adjustments for Changes in Alkyd Viscosities
After preparation of the first 18 trial enamels, the supply of the alkyd was exhausted, and it was necessary to replace it. The replacement alkyd resin was extremely similar chemically to the original, but somewhat lower in viscosity. Another resin replacement was necessary after the 29th enamel, so mill pastes for subsequent enamels were prepared using a third very similar alkyd resin. An additional supply of the original resin was then obtained, and used in the thindowns for these subsequent enamels. This final combination also had a somewhat lower viscosity than did the original.
In order to allow meaningful comparisons of viscosities between enamels made with different resins, normalizing factors were calculated for viscosities of enamels containing the first replacement resin, and likewise but separately for enamels containing the final resin combination. In each instance, the appropriate factor was then multiplied by the equilibrated viscosity, thus computing the normalized viscosities in Table 3. The method of calculation is explained below.
To minimize interference by viscosity differences caused by pigment rather than by alkyd resin, data used in calculations of normalizing factors were limited to those from the enamel tints, where pigmentations were primarily TiO2 and therefore all very similar. Arithmetic means were computed for initial viscosity, and separately for equilibrated viscosity, exhibited by the nine enamel tints containing the original alkyd resin. The same two means were computed for the 5 tints containing the first replacement resin and again for the seven tints containing the final resin combination. Four ratios of these viscosity means were computed. The first was the ratio of the mean initial viscosity of the first nine enamels tints to the mean initial viscosity of the five enamel tints containing the first replacement resin; the second was the ratio of the mean initial viscosity of the first nine enamel tints to the seven made with the final resin combination, and similarly the same two ratios were computed for the equilibrated enamel tints. A normalizing factor, to be applied to viscosities of all enamels made with the first replacement resin, was then computed as the mean of the appropriate initial and equilibrated viscosity ratios and was found to be 1.15. Similarly the normalizing factor for all enamels containing the final resin combination was found to be 1.21.
Gloss, Specular, 20º and 60º, ASTM D 523
Specular gloss is the amount of light reflected from a surface in the mirror direction – that is, where angles of incidence and reflection are equal. Angles of 20º and 60º (from the perpendicular) are most representative of visual perceptions of gloss (shininess) from high gloss, and semi-gloss, surfaces, respectively. To measure gloss, the test paint is applied by applicator bar to a test panel at the wet thickness specified in the Table of Test Results, and dried. Gloss is then measured using a meter of the desired geometry, consisting of a light beam directed against the paint surface at the desired angle and reflected into a photosensitive device at the opposite equal angle, where this receptor drives the pointer on a scale of 0-to-100. The meter is calibrated on a glass standard of known gloss immediately before use.
Reflectance of Dry Paint Film, ASTM E 308
Measurement of light reflected from a surface under daylight conditions, as perceived by the human eye, represents the brightness of the surface, being equal to light received, minus light absorbed, by the surface. To measure reflectance, a paint is applied by applicator bar to a sealed surface at a thickness that achieves complete opacity so that additional paint will not change the reflectance. A spectrophotometer is calibrated on a standard surface having similar reflectance, and light reflected from the dry paint surface at the perpendicular, when illuminated at a 45º angle, is measured at the Y tristimulus wave length, representing the sensitivity of the average human eye. Reflectance is stated as a percentage of the reflectance of a theoretical perfect reflector.
Opacity (or Hiding Power) of Dry Paint Film by Contrast Ratio, ASTM D 2805
The procedure used was based on the ASTM method and was closely adhered to throughout this work to allow comparison of the relative opacities of all the paints. Paints are applied to sealed paper charts that have both black and white areas, using an applicator bar to apply wet films of the thickness specified in the Table of Test Results. Reflectances (see Reflectance, below) are then measured on the dry films over both white and black backgrounds. The ratios of reflectance-over-black to reflectance-over-white (Contrast Ratios), which are less than 1.000 and are measures of opacity, are then computed, converted to percentage and compared. Differences in the first decimal place may be visually significant.
Color Difference, ASTM D 2244
Color differences between a reference and a test specimen are determined by use of a spectrophotometer or color-difference meter, which provides direct read-out of values for the CIELAB color scale. This scale describes an approximately uniform color space in which L* represents lightness-darkness (larger values lighter), a* represents red-green (larger positive values redder) and b* represents yellow-blue (larger positive values yellower). Measurements are made on dry paint films applied at thicknesses that achieve complete opacity on paper charts.
Solvent Bleed Resistance
Enamels were applied to lacquered charts by 6 mil Bird blade applicator, and allowed to dry thoroughly under ambient conditions. Three white overcoats were prepared, toned with black to increase opacity and using formulas shown in Appendix.II. Characteristics and properties of these overcoats are also shown in Appendix II.
Each overcoat was applied by 6 mil Bird blade over a portion of each colored enamel chart. Also, the three overcoats were similarly applied over white lacquered paper charts in order to obtain the true color of each overcoat without influence from bleeding or color of substrate. After all overcoats had dried for 48 hours, color coordinates were measured and color differences (i.e., Delta E) were calculated between the same overcoats applied over the white lacquered charts and over each enamel. Hence, each color difference calculated represented a total of any discoloration from pigment bleed plus any lack of complete coverage by the overcoats. Errors due to lack of complete coverage, however, were essentially eliminated by the high opacity of the white overcoats and the thick films in which they were applied.
Weathering, Accelerated, ASTM D 4587
The QUV cabinet, a product of the Q-panel Company, simulates natural weathering by exposing coatings to various cycles of UV light and moisture condensation. 3-mil wet films are applied to duplicate aluminum panels, dried for seven days and exposed in random positions within the cabinet. Exposure to ultraviolet light is provided by fluorescent tubes producing UV-B radiation. Temperature is maintained at 60 ºC. To evaluate fade resistance of the present series of enamels, panels were exposed to UV light, without moisture condensation, for a total of 1030 hours. Color coordinates were measured initially, after 770 hours and after 1030 hours at both top and bottom of each panel. Thus each set of color coordinates reported is an average of four readings. Color changes (Delta E) were then computed.
Weathering, Natural
For the present series of enamels, panels were exposed in August, 2003, in rural Georgia facing south at a 45o angle. Each panel consisted of one normal coat of enamel, applied with a #60 wire-wound rod on a 6-inch-by-12-inch aluminum panel. Panels were allowed to air dry for 7 days and measured before exposure, at three points on each panel, for color and gloss, as described above. Panels were examined at three-month intervals, including color and gloss measurements.
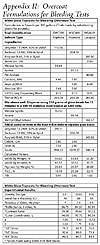
Appendix II: Overcoat Formulations for Bleeding Tests
Looking for a reprint of this article?
From high-res PDFs to custom plaques, order your copy today!


