2002 Finishing Forecast: Reason for Optimism
Despite 2001’s soft economy and the events of September 11, finishers responding to Industrial Paint & Powder’s 2002 Finishing Market Survey are generally predicting that operating levels will not change much in 2002 compared to last year, or that they will increase. In fact, they were slightly more optimistic about business prospects for 2002 when polled in October 2001 than they were about prospects when polled around the same time in 1999 and 2000, according to the 15th annual survey.
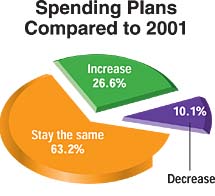
Nearly 88% of respondents said operating levels would be about the same as last year’s (44.7%) or higher than last year’s (42.8%). About 12% said operating levels would decline. While the percentage of finishers who expect more business in 2002 is lower than the last couple of years and the percentage of finishers who expect less business is higher, the percentage of finishers expecting the same amount of business is consistent with the last two years’ surveys.
Nearly 8% of respondents indicated that they were “pessimistic” about business prospects in 2002, up somewhat from the previous two years. But more than 25% of respondents were “optimistic” about 2002 operating levels, which is slightly higher than last year and up from 20% two years ago. Nearly 22% of respondents indicated that “incoming orders on increase” while just over 9% said “incoming orders on decrease.”
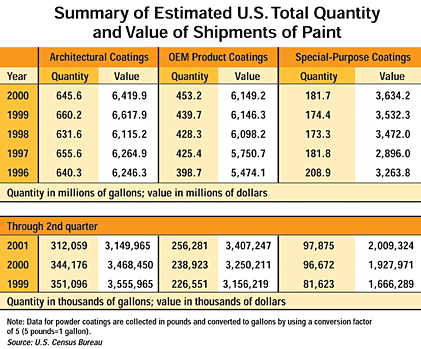
While the country officially moved into a recession last March and world events have been volatile, the most recent Census Bureau data looks good for users of OEM coatings. The OEM coatings market saw a 3.1% increase in volume in 2000 and a slight increase in value. And OEM coatings shipments for the first half of 2001 (the latest available Census data) were up more than 10% over the first half of 2000.

Other reasons for purchasing new equipment include:
- Increase capacity, 36.6% (down from 44.9% last year)
- Improve coatings appearance/performance, 34.5% (down from 37.4% last year and 41.7% two years ago)
- Environmental compliance, 32.3% (about the same as last year, but down 4.5% from two years ago)
- Expand/improve color-change capabilities, 12.2% (about the same as the last two years)
- Conversion to new coating system, 12.2% (roughly the same as the last two years)

Flashback--1987
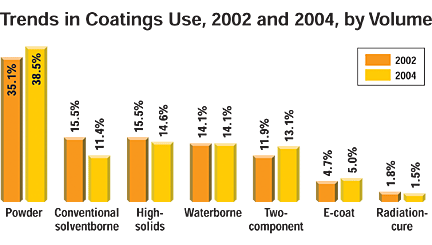
Industrial Paint & Powder conducted its first Finishing Market Survey back in 1987. Some things, such as the use of powder coatings, have changed dramatically; others, such as the use of waterborne coatings, have been less dramatic. Here are some of the results from that first study.
In the plant
Capacity-utilization rates in 2001 changed little from 2000 rates. The only utilization-rate category to show a statistically significant change is the 80 to 89% category, which increased from 16.2% of respondents last year to 21.7% this year. The other capacity-utilization rate categories were:- Less than 50% capacity, checked by 23.5% of respondents
- 50 to 59% capacity, 13.0%
- 60 to 69% capacity, 10.3%
- 70 to 79% capacity, 16.0%
- 90% capacity or more, 15.5%
Editor’s note: Industrial Paint & Powder would like to thank the many readers who took time to participate in this year’s market survey. To gather information for the survey, questionnaires were mailed in September to a representative sample of senior-level manufacturing managers at 3,500 U.S. finishing locations. A total of 811, or 23.4%, were returned. (Only responses from the 750 that apply paint or powder coatings were tabulated in the results.) A sample this size offers a 3.6% margin of error at a 95% confidence level. This survey’s intent is to highlight industry trends rather than set specific dollar expenditures for individual sectors of the market.
The “Typical” Finisher
Finishing operations vary widely in size and scope of operations; thus, attempting to provide a snapshot of the “typical” finisher is no easy task. But the responses to Industrial Paint & Powder’s 15th annual Finishing Market Survey provide detailed information about staffing, spending, application methods and much more for small and large finishers alike.While finishing facilities that use a relatively small amount of liquid paint comprise a huge portion of all facilities using liquid coatings, the same is less true for powder finishers. Of those respondents using liquid coatings, a little more than 41% use less than 100 gallons per month; 14.6%, 100 to 249 gallons; 7.6%, 250 to 499 gallons; 13.1%, 500 to 999 gallons; 10.4%, 1,000 to 2,499 gallons; and 12.9%, 2,500 gallons or more. Conversely, less than 14% of shops applying powder use less than 100 pounds per month; 11.5%, 100 to 249 pounds; 6.3%, 250 to 499 pounds; 13.5%, 500 to 999 pounds; 15.6%, 1,000 to 2,499 pounds; and 39.2%, 2,500 pounds or more.
A majority of the respondents (59.1%) say their finishing operations occupy less than 10,000 square feet; about 37% occupy less than 5,000 square feet. A little more than 11.2% take up 50,000 square feet or more. Perhaps because of consolidations in the industry, about 20% of respondents say they occupy 30,000 square feet or more, compared to around 12% the last two years.
When asked about the age of their equipment, 22.4% of respondents said their liquid application equipment was less than three years old; 34.9%, three to five years old; 23.9%, six to 10 years old; 18.8%, more than 10 years old. Nearly 33% of finishers responded that their powder application equipment was less than three years old; 29.9%, three to five years old; 27.7%, six to 10 years old; 9.7%, more than 10 years old.
On average, respondents say about 29 people are directly involved in the company’s finishing activities, though nearly 59% say they employ 10 people or fewer. These numbers also could reflect consolidation in the industry. Last year’s average number of finishing personnel in respondents’ plants was only 20, and more than 66% of respondents said they employ 10 people or fewer. Those respondents saying they employ more than 50 people in their finishing operations (9.4%) is also up over last year (7.9%) and two years ago (6.4%).
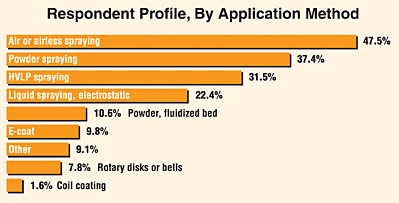
How are those employees applying paint and powder? More than 47% of respondents use air or airless spraying, which is down from more than 52% three years ago. That category is followed by powder spraying (37.4%), slightly up from three years ago (34.3%). Nearly one-third employ HVLP spraying, and 22.4% use electrostatic liquid spray equipment (Figure 4).
And what are they coating? Ferrous metals account for about 62% of total coating volume, while nonferrous metals account for nearly 22%. Those numbers haven’t changed much the last couple of years and respondents say the numbers will remain about the same over the next two years. Plastic accounts for a little more than 7% of total coating volume and wood represents about 6%. Glass and other substrates account for about 3% of the market.
Of the total volume of parts being coated, the majority (65.1%) is finished manually with hand-held equipment, while nearly 35% is coated with automated equipment. But the trend is toward automation. Two years ago, respondents reported that more than 71% of total volume was finished manually and less than 29% was coated automatically.
Fewer companies (20.2%) say they are reformulating their coatings than in the past. Of those that do, the vast majority add solvents (86.4%), as well as additives (61.1%), pigments (48.1%) and resins (35.2%).
Looking for a reprint of this article?
From high-res PDFs to custom plaques, order your copy today!


