Polyurethane Dispersions from Sustainable Polyols with Recycled and Renewable Content

In the interest of overall sustainability in the coatings industry, Resinate Materials Group has committed large efforts to demonstrate utility, practicality, performance and advantages in tapping recycled and biorenewable streams for polyol development. This approach is very much aligned with the concept of accounting for the full impact of coatings from raw material cradle to grave.1 Much of the work has been driven toward neat polyester polyols for coatings, adhesives, foams and plasticizers, however, a few of the materials have been reduced with appropriate solvents to enable formulation work at lower viscosity. One of the recent areas of focus has therefore been enabling the translation of high-performance polyols from solvents into water-based platforms to create even higher sustainability properties. Emulsions and dispersions have demonstrated their ability to convert high-viscosity, high-molecular-weight materials into a water-continuous, low-volatile organic compound (VOC), low-viscosity package. Our recent work has successfully demonstrated this conversion of several new sustainable, performance polyols into polyurethane dispersions, suitable for coatings and adhesives. The resulting dispersions were tested against commercial benchmark products, and provided both matching and superior performance, making this sustainability option advantageous in multiple categories.
Introduction
Plastic waste from packaging of various products continues to be of growing global concern. These materials typically pollute and persist in the environment, derived from limited petroleum feedstock reserves. Finding other uses for spent plastics, especially “upcycling”2 (uses where the new target application is considered a higher performing, longer life cycle purpose than the original), is a viable, but currently limited outlet. Alternatives to having discarded materials polluting the environment are mostly based on incineration and landfilling. Recycling efforts to repurpose the material in the same or similar application area are ongoing, but cannot keep pace with the supply of waste. According to the Wall Street Journal,3 40% of discarded plastic exports from the U.S. ended up in China last year. China is planning to end the import of used plastics in 2018 due to the oversupply from their domestic sources and cannot continue adding more volume. One of the appropriate markets for recycling condensation polymers (polyester, polycarbonate, polyamide) is the coatings, adhesives, sealants and elastomers market (CASE), where many of the useful components for high performance already rely on varying levels of condensation polymers. So, chemically breaking down the used plastics and rebuilding them with various co-ingredients (esp. biorenewable) to achieve sustainable, high-performance materials for CASE applications with high levels of recycled content is, at least in theory, a necessary and exemplary undertaking in preserving global resources.
A Family of PUD Polyols
Resinate Materials Group, Inc. has been working in this area to develop polyols for high-performance CASE applications. There are a number of commercial offerings currently with this type of pedigree, available mostly as 100% solids, and several are diluted in various solvents. Some of the target sustainable streams include polyethylene terephthalate (PET), glycol-modified PET (PETG), poly(bisphenol A carbonate) (PBAC), lignin, various post-industrial waste glycols, and other natural oils and derived acids. One area where these polyols have recently found a good fit is for waterborne polyurethane dispersions (PUDs). A natural extension of the sustainability theme behind the polyol design is the demonstration of their performance in waterborne coatings and adhesives, which allows for reduction of VOC usage. Reducing environmental impact further by removing the need for solvents through the use of water is in alignment with the Resinate mission. To that end, this work is a more detailed look at the latest performance data from these PUDs based on polyols containing high “green” content (Table 1), which includes recycled and renewable components.4
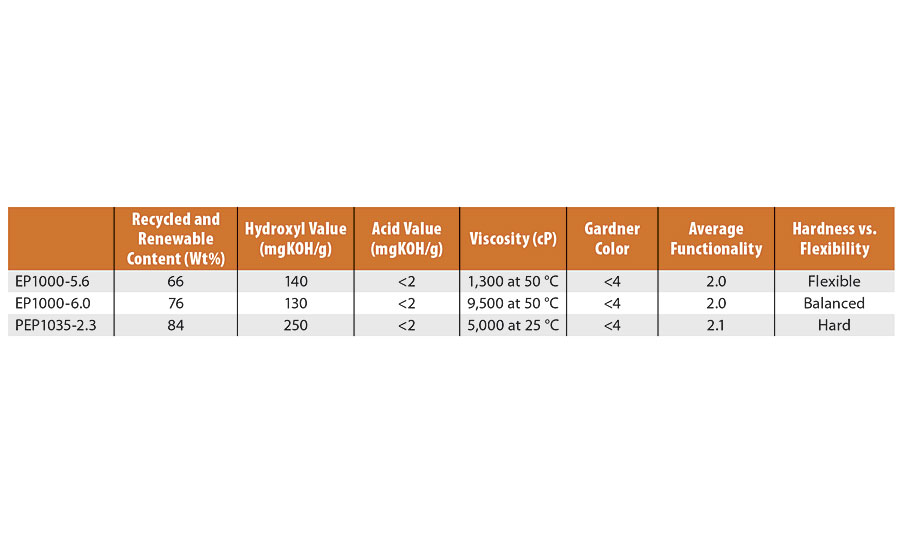
TABLE 1 » Experimental polyols.
Here, we demonstrate utility and performance of these novel polyols for PUD applications by optimization of the system components using statistical modeling from design of experiments (DOE). This affords a starting-point composition for which the highest performance can be achieved using a robust, well-defined process. These results can then be leveraged to making other PUDs from various polyols to develop insightful knowledge for blending and formulating to meet specific goals.
The work described in the DOE portion was all done using a single resin, developmental polyol Resinate® EP1000-5.4. We previously5 introduced the series of polyols shown in Table 1 and their respective PUD properties, ranging from very flexible to very hard. From the table, a comparison of the properties can be made, where viscosity and hydroxyl value have the greatest differentiation. The green content (combined recycled and renewable content), acid value, color and functionality are all similar. The Resinate PEP1035-2.3 has the lowest equivalent weight (224) and molecular weight (471) based on the functionality average. The resulting high percentage of hard segment in the prepolymer for this PUD probably accounts for its high overall hardness. These polyols were all taken through the same process described here to successfully convert them to waterborne dispersions.
Experimental
Process Design Parameters
In order to perform numerous designed experiments with controlled variables related to the composition, we had to define our PUD process to as much detail as possible. This included mixer type, mixing speed, agitation blade type and size, vessel type and size, ingredient addition and charge order, neutralizer type and addition method, water temperature and addition rate, and all associated hold times. Ingredients and materials were all acquired from commercial sources and dried as needed before use. Polyols were all synthesized in our lab, and all properties tested internally. Batch sheets were made according to individual polyol quality control data.
A two-piece reactor was chosen for this work, to allow the use of large Cowles-type mixing blades on a center metal shaft (Figure 1). The reactor bottom fit into a heating mantle controlled by internal temperature probe. The mixer used was a Caframo model BDC1850 high-torque stirrer. The polyol was converted to the prepolymer at temperature in this vessel, neutralized and then inverted in the same vessel as a single tank inversion process. This worked very well to limit or eliminate any material losses typically encountered with two-tank transfer processes. That resulted in more accurate calculations for all variable parameters and better control over final composition with minimized variability.
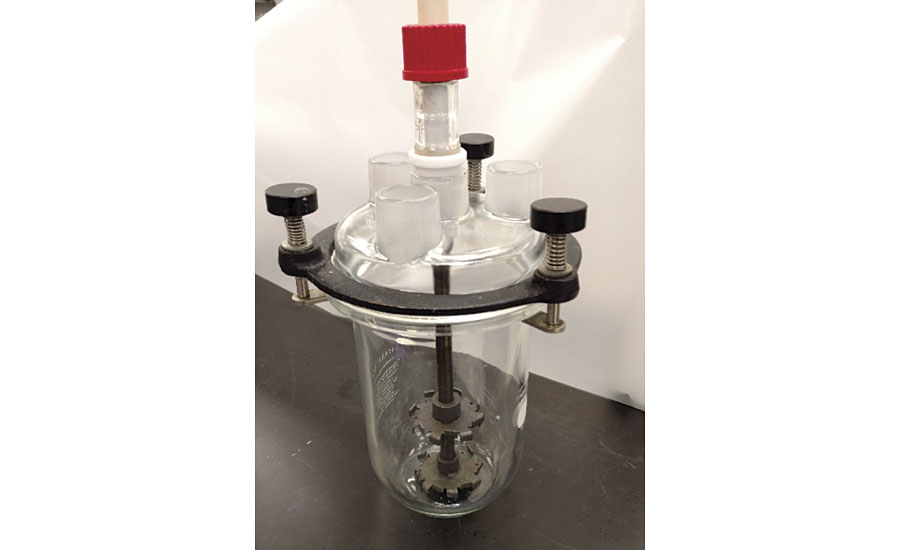
FIGURE 1 » PUD reactor vessel.
Single Tank Inversion Process5
The single tank inversion process was defined for these batches as the following steps: 1) charge hydroxyl components and any NMP solvent; 2) homogenize at 45 °C; 3) add isocyanate while monitoring exotherm below 85 °C; 4) heat to 85 °C and hold until target %NCO is achieved; 5) increase mixing to 1,200 rpm and add neutralizer (with antifoam); 6) increase mixing to 1,800 rpm and add water slowly over 10-15 min (water temp 40-45 °C); 7) add chain extender in water then reduce mixing to 1,200 rpm and allow continued reaction for 2 hours to 30-35 °C final temp; 8) filter dispersion through medium mesh paint filter.
Formulation Variables
The variables chosen for this work were the NCO/OH ratio on prepolymer, the dimethylolpropionic acid (DMPA) level used as a percentage on solids, the ethoxylated trimethylolpropane nonionic surfactant used as a percentage on solids, and the percent neutralization of the DMPA acid groups, where all were independent, continuous variables. We also added a categorical variable based on the chain extender used, either diethylene glycol (DEG)6 or ethylenediamine (EDA). The setup and levels are shown in Table 2.
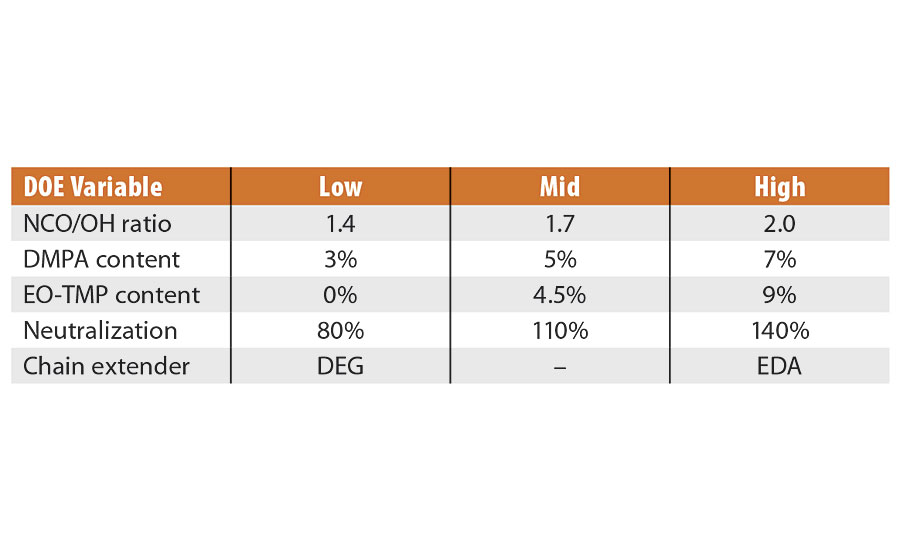
TABLE 2 » DOE settings.
DOE Design
The chosen variables were input to JMP® software as an I-optimal response surface custom design (better predictability over D-optimal). The G Efficiency was 77.7 (reflects maximum prediction variance), and the average variance of prediction was 0.447. There were a total of 26 separate experiments run in batch process. Resulting dispersions were stored ambient and at 50 °C for stability testing. The polyol chosen for this work was an experimental material, EP1000-5.4; physical properties are listed in Table 3. It is a difunctional linear material with an equivalent weight of approximately 404 Da, an acid value less than 5, and very low in color. The viscosity profile was nice for the temperatures we worked with in preparing the prepolymer, as it declined almost two orders of magnitude in going from ambient to 75 °C.
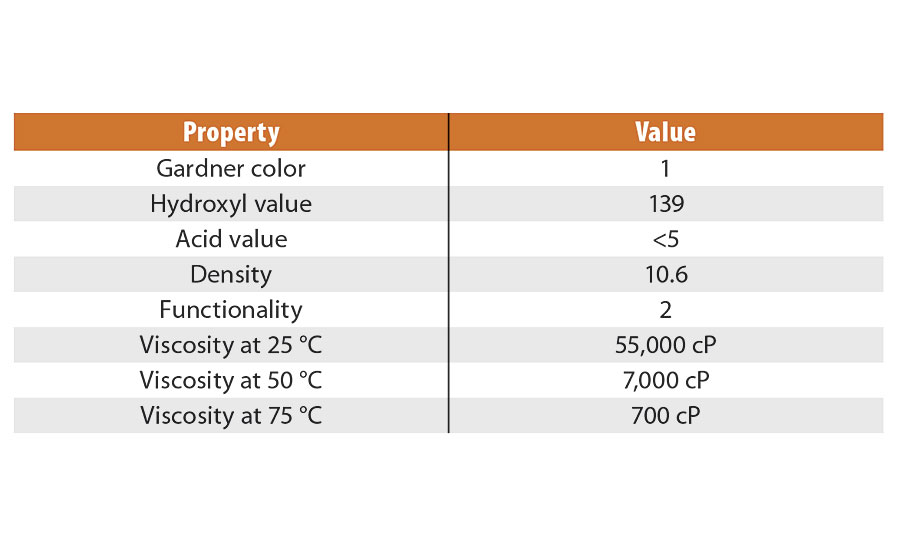
TABLE 3 » Polyol EP1000-5.4 properties.
Measured Outputs
There were a number of properties we were interested in following during the changes made to the composition. Some were measurements of various PUD properties, while others were measurements taken on films prepared from the resulting PUD. Table 4 lists the various parameters we tracked, using the data to build predictive models for optimization. There were several metrics that did not successfully form significant models; the crosshatch adhesion data (all were rated 5 over aluminum), viscosity change on aging, and the 1-hour spot tests for water and vinegar (again not enough differentiation).
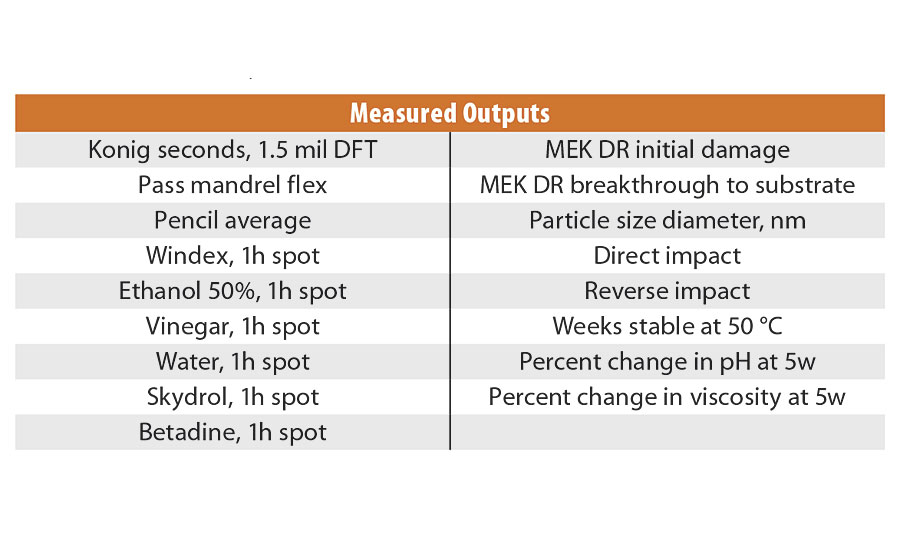
TABLE 4 » DOE response measurements.
Results and Discussion
Model Building
The models were all generated using a stepwise regression, P-value threshold (0.25) in mixed direction, starting with no terms in the model. The model terms were selected while obeying hierarchy rules with respect to the main effect terms. Model refinement was attempted with the goal of minimizing the gap between R-squared and adjusted R-squared while targeting maximum values for both (Figure 2). In this manner, 15 models were successfully made, fully optimized and then introduced into the prediction profiler.
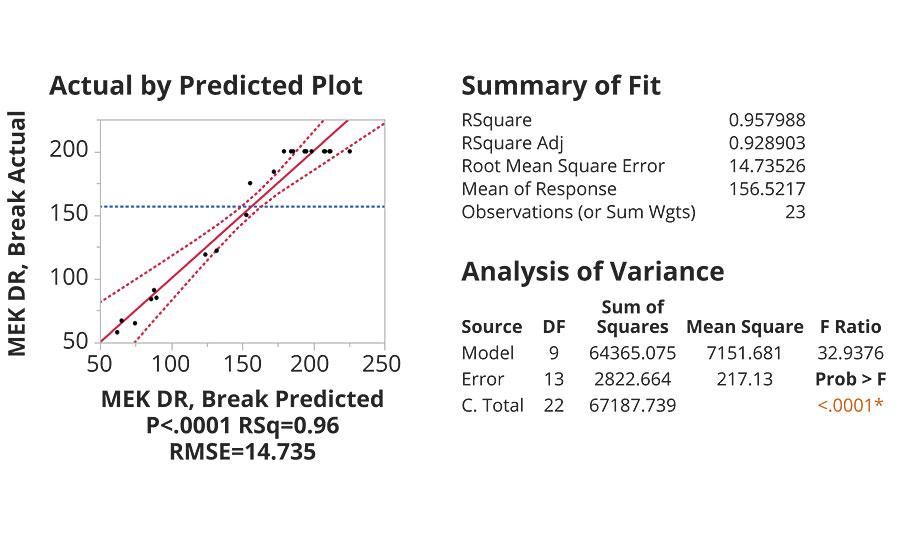
FIGURE 2 » Model results for MEK double rub test.
There were some interesting, yet not surprising, correlations of the various input variables to certain film properties. The higher NCO/OH ratio improved Konig hardness and MEK resistance, and the lower ratio increased direct and reverse impact resistance, and improved flexibility. The use of DEG as chain extender reduced the Konig hardness, improved flexibility and reduced MEK resistance. The higher percentage of DMPA improved Konig hardness and MEK resistance although it reduced impact performance and flexibility.
Optimization
Optimization of all variables simultaneously was performed using the prediction profiler within the JMP software. This tool performs a mathematical convergence toward maximum desirability for all models simultaneously. The result was specific levels for each of the defined variables that represents the “sweet spot” in maximizing desirability for all model categories. Each individual model was imported, and a desirable outcome (high, low,or target value) for that output was defined. Upon maximizing the desirability, the optimized composition was displayed, covering the continuous spectrum between high and low levels for each variable at each categorical setting. Prioritization of the contributing models was done using the importance rating submenu. All importance levels were set at “1”, except Konig hardness (10), mandrel flexibility (20), percent pH change week 5 (10) and MEK double rub breakthrough (5). The final output of settings for all input variables was calculated along with the associated predicted performance values from each output model using those settings. The efficiency of this multiple convergence algorithm is tabulated by an overall desirability rating from 0-1 based on how close it came to maximizing all the performance criteria at the same time with a single composition. Our optimization for this data set gave us a desirability rating of 0.64 (Figure 3).
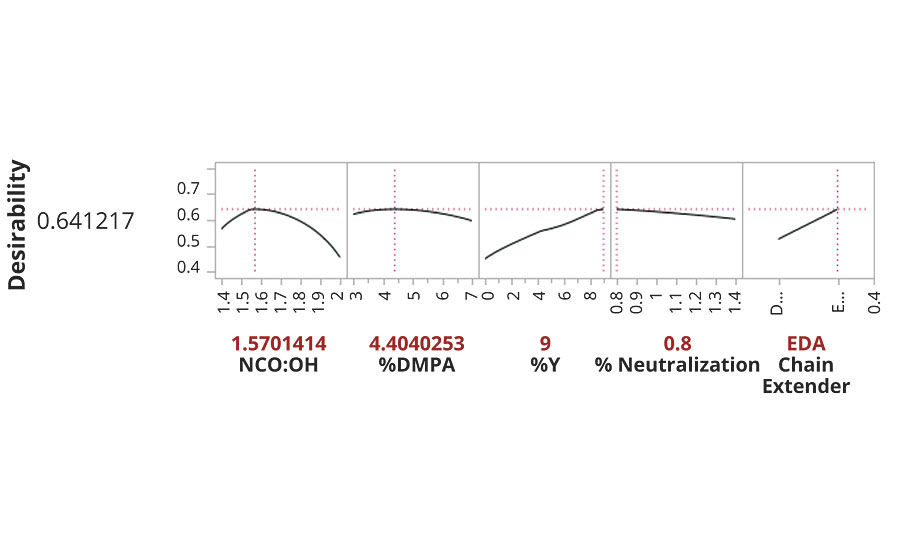
FIGURE 3 » Optimized settings for input variables.
Since the resulting composition from this optimization process was not previously made in the normal DOE setup, we next made this according to the prescribed settings. We then measured some of the actual output values, which were compared to the predicted values to demonstrate the models’ collective usefulness. This data is shown in Table 5, where we see that hardness, flexibility and chemical resistance had good predictability, while impact resistance was slightly underestimated using the models.
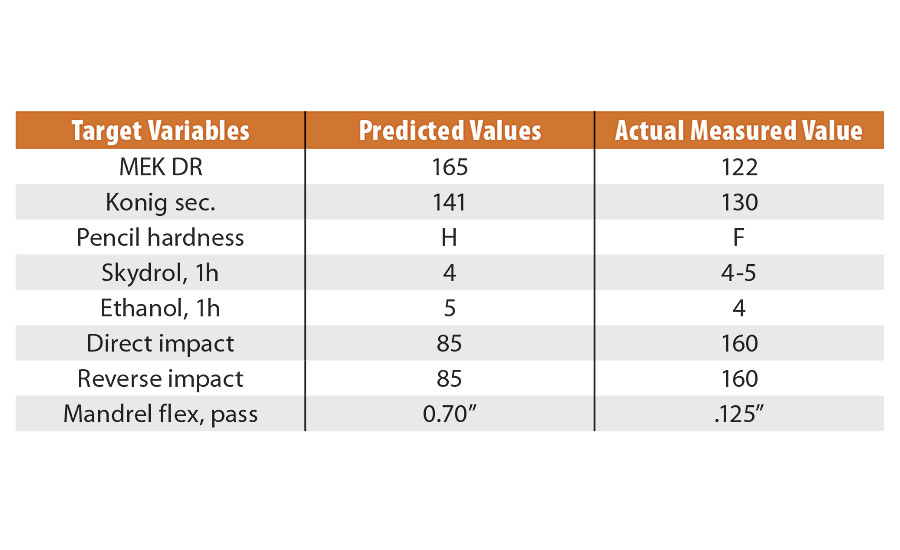
TABLE 5 » Optimized PUD performance testing vs. predicted.
We can see the performance data from PUDs based on the optimized EP1000-5.4 vs. the previous candidate resins, as well as some blends in Figure 4. The scale is direct for Konig values, impact and MEK double rubs, and data were normalized for the mandrel flexibility (1/8” pass is equivalent to 100) and pencil hardness (2H=100, H=90, F=80). In this manner, all bars on the graphic move in a positive direction going upward. The ambient control was a well-known, commercially available PUD in the market that has excellent properties and wide application usage. For those familiar with the PUD landscape, it is considered a true benchmark.
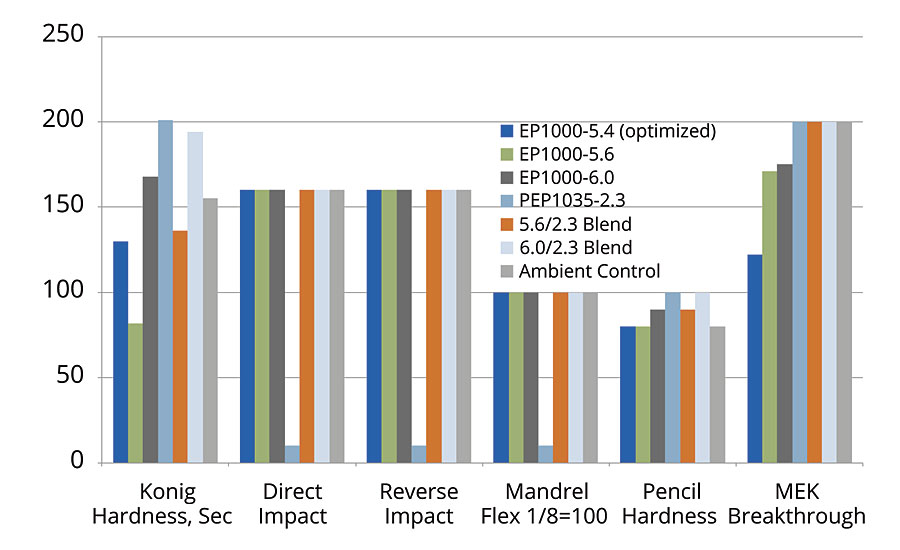
FIGURE 4 » » PUD data from developmental polyols – data were normalized for the mandrel flexibility (1/8” pass is equivalent to 100) and pencil hardness (2H=100, H=90, F=80, etc.).
It was previously mentioned that the PEP1035-2.3 was the hardest polyurethane of the group (it had the highest Konig hardness), and accordingly the data showed poor impact and mandrel flexibility for films based on this PUD. However, when we blended that PUD in a 50/50 ratio with the PUD based on Resinate EP1000-6.0 we were able to enhance the MEK resistance and hardness without any loss in mandrel flexibility or impact resistance. This results in a very nice balance of properties across the entire range of performance for industrial applications. This blended system outperformed the benchmark material in Konig and pencil hardness and matched all other performance categories. For comparison purposes, the optimized EP1000-5.4 system was included in the data set, with only slightly lower hardness and MEK resistance.
In addition, stain testing was performed on the films for 1 hour, covered and rated from 1-5 based on any damage. A rating of 5 indicated no damage, a rating of 1 indicated complete removal of the film. The benchmark material performed very well here, outperforming all experimental PUDs in combined stains (5 rating for all stain tests). The next best was the PEP1035-2.3 (very hard) and its 50/50 blend with the EP1000-6.0, where both rated a 4 in the Skydrol exposure and a 5 rating for all other stains (Figure 5).
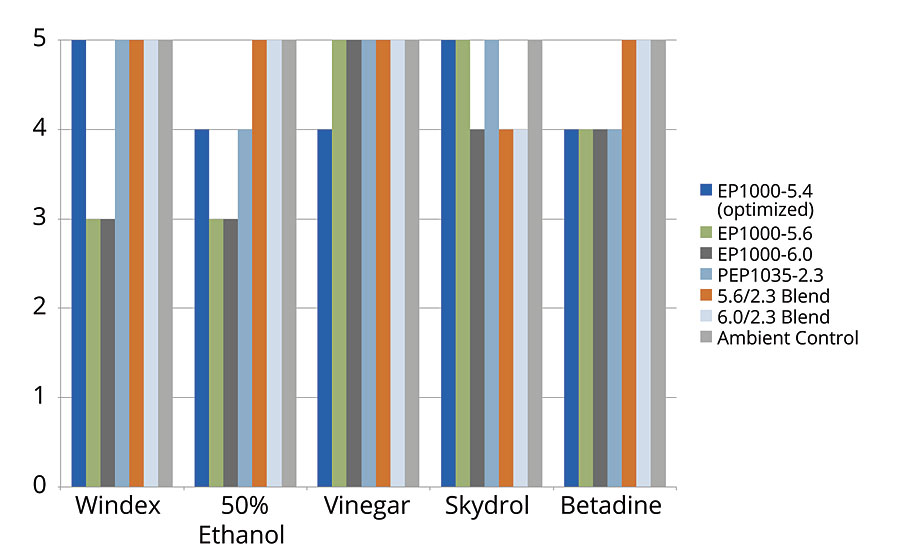
FIGURE 5 » Stain resistance for developmental PUDs
Since all the PUDs in this work were developmental, the performance data shown may not be the ultimate for a given system. We have applied some compositional knowledge along with known process parameters to achieve stable, waterborne dispersions, which can be further processed into continuous films over various substrates. Without individual optimization, it is unlikely that we have shown each in its best possible format, however, the data are useful for comparison and indicate a high level of potential for strong protective coating properties.
UV Curable Systems – EP Polyols
The chemical makeup of several Resinate polyols allows them to be screened as UV-curable materials. We incorporated a photoinitiator (Irgacure 1173), drew the samples down using #50 wire-wound bar, then flashed the panels for 1 hour at ambient conditions. The panels were then passed through a Fusion UV LC6B benchtop curing conveyor using an H+ bulb until tack free (normally 1-5 passes), followed by two additional, totaling 3-7 passes. Any residual water or solvent was removed afterwards by placing the panels in an oven at 130 °C for 1 hour. In this manner we looked at the fully optimized EP1000-5.4 PUD, alongside PUDs from EP1000-5.6 and EP1000-6.0 (previously discussed in ref. 1). We included a different commercial control for this series of testing, another well-known industrial PUD, this time from a major UV-curable supplier. Again, our purpose was to match or outperform the benchmark control, so we monitored several film properties again; hardness, flexibility, impact and MEK resistance. The data are shown in Figure 6, where again the mandrel flexibility was normalized to 100 to indicate a pass rating at 1/8” bend.
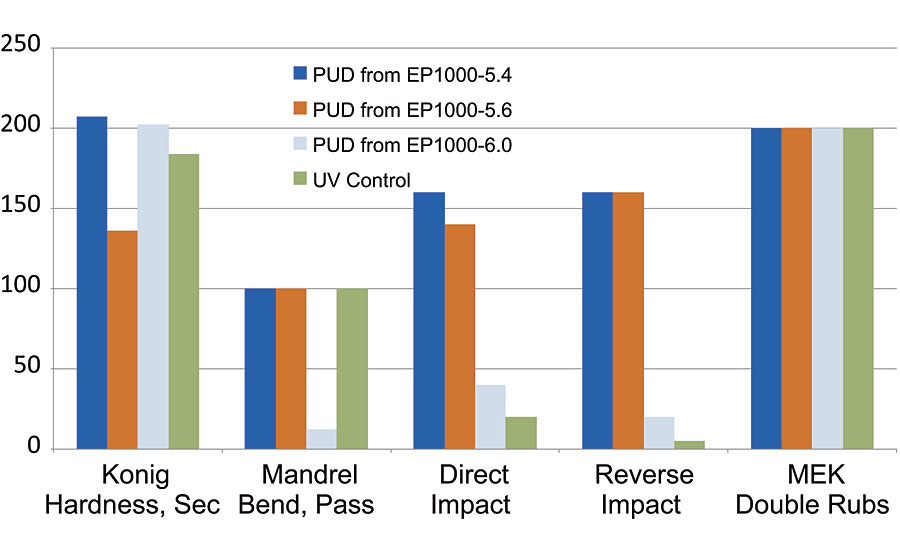
FIGURE 6 » UV-cured PUD properties – data were normalized for the mandrel flexibility (1/8” pass is equivalent to 100).
The results of this study were quite surprising, as the optimized EP1000-5.4 was the clear frontrunner. Most surprising was the ability of the film to fully cure under UV exposure to provide good MEK resistance, while at the same time maintaining excellent mandrel flexibility and impact resistance, along with greater than 200 seconds Konig hardness. This was a fantastic combination of properties all coming from a single PUD after UV cure. The commercial control system had good Konig hardness, good MEK resistance and passed mandrel flexibility at 1/8”, but had very poor impact resistance performance. This is more common with UV-curable systems where high cure levels cause embrittlement of films.7 The EP1000-5.4 has shown itself as an excellent candidate for future work in the UV-cure application space. We have only chosen one photoinitiator, along with a single radiation source to generate the initial data, so once again, there is good chance process conditions could be further optimized. However, here the EP1000-5.4 was very good and outperformed the commercial benchmark.
A Final Application of PUD Learnings – Floor Coatings
When we looked at the Resinate portfolio of polyol products, we saw there was one other material that could provide good utility as a waterborne package. The developmental polyol, Resinate MPP1000-2.7 has had good success in 2K floor coating applications, and it was of high interest to investigate whether the performance properties could translate into the above PUD technology and process. This product has since become commercial (C2051-50) and has had continued success over a variety of flooring substrates. A PUD was made using the above-mentioned process and compositional settings, and resulted in a very stable (currently > 10 weeks @ 50 °C) waterborne product for testing. We looked at the same properties as before, and compiled the results from this new PUD with those from both of the previous commercial benchmark systems (ambient dry and UV cure) in the same manner as before (Figure 7).
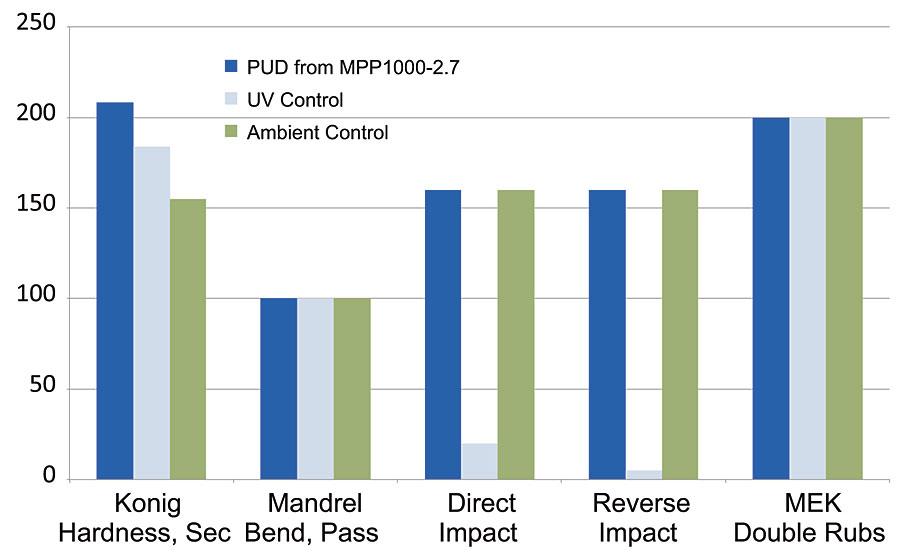
FIGURE 7 » PUD from MPP1000-2.7 polyol.
Our latest sustainable developmental product outperformed both commercial benchmarks, an ambient dry system and a UV-cure system. Using the benchmark data from the previous graphs, and plotting alongside the new MPP1000-2.7 dispersion data, we see that this flooring PUD has outstanding hardness, flexibility, impact and chemical resistance, all in one package. This was an ambient-dry PUD, with a short oven exposure to remove processing solvent. Future work will be designed around removal of the solvent completely from the process and re-evaluating performance.
Conclusions
A design of experiments study was successfully used to develop and optimize high-performance aqueous polyurethane dispersions based on a family of sustainable polyester polyols. The polyols and resulting dispersions:
- Contained between 50 and 84% green content;
- Processed readily to form thermally stable polyurethane dispersions;
- Created dispersions with low VOC content;
- Had optional UV-cure performance capability, or ambient film formation;
- Had outstanding stain and solvent resistance;
- Provided high hardness combined with flexibility and excellent impact resistance;
- Outperformed commercial benchmark PUD products.
Additionally, the MPP1000-2.7 PUD outperformed both the UV and ambient commercial control PUDs, generating a great interest in further optimization and application studies, especially for protective floor coatings.
Acknowledgements
The authors wish to express gratitude to all their coworkers at Resinate Materials Group, Inc., especially Adam Emerson, Mike Christy, Taylor Reynolds, Rick Tabor, Matt Brown, Kris Weigal and Shakti Mukerjee.
For more information, contact gary.spilman@resinateinc.com.
References
1 Mash, T. PCI Magazine, April 2015, 40-51.
2 Spilman, G.; Emerson, A.; Christy, M.; Fryz, G. PCI Magazine Apr. 2016, p. 70.
3 Phillips, E.E. Oh, Scrap: China, the Biggest Buyer of America’s Trash, Wants No More, The Wall Street Journal, Oct. 8, 2017.
4 Spilman, G.; Tabor, R.; Emerson, A.; Brown, M.; Christy, M.; Hense, D. PCI Magazine Nov. 2015, 26-30.
5 Spilman, G.; Weigal, K.; Marsh, K.; Brown, M.; Samson, M. PCI Magazine Sept. 2017, 52-54.
6 Delpech, M.C.; Miranda, G.S. Cent. Eur. J. Eng. 2(2) 2012, 231-238. (DEG chain extension was carried out after the dispersion step).
7 Gismondi, T.E. J. Rad. Curing 11(2), 1984, 14-18.
Looking for a reprint of this article?
From high-res PDFs to custom plaques, order your copy today!


