Variable Recycled PET Content for Coatings and Adhesives

The coatings industry continues to amplify the importance of providing sustainable answers to high-performance applications. With continued strides, the three pillars of sustainability (economic, environmental, social) are being addressed. Environmental gains from increasing the amount of recycled material usage and increasing the effectiveness and awareness of recycling programs are examples of these strides. However, the recycling programs in place are not enough - a staggering 50% of plastics used today are in single-use disposable applications such as packaging, agricultural films and disposable consumer items.1 In order to recapture more of these single-use materials, additional processes need to be put in place for reuse of these molecules. Here we incorporate variable recycled PET (rPET) content and report on the observed effects in coatings and adhesives.
The Resinate® A0351-12 polyol was the basis for the work outlined in this article. A0351-12 is an aliphatic 3,000 Da molecular weight diol that has found utility in multiple coating and adhesive applications. To properly design an extended polyol family for use in waterborne technology, the molecular weight target was reduced and brought closer in line with typical urethane dispersion polyols. This low-molecular-weight version of A0351-12 was our starting point for this work and is referenced as PEP-0 (polyester polyol, 0% rPET), shown in Table 1. Using Resinate technology, we incorporated increasing levels of rPET to observe the effects on film performance.
During development, one area of focus was the improvement of our adhesive technology. Observing unique differences between adhesives made from this polyol family led ultimately toward exploring how these macromolecular compositional differences could impact physical properties of their coatings. The properties of these coatings were evaluated as both a traditional 2K polyurethane and as a 1K waterborne polyurethane dispersion (PUD). Adhesives were also developed in tandem, but only evaluated as PUD formulations. The adhesive PUDs were tested for adhesion strength differences brought by changes in rPET composition. The properties of both a coating and an adhesive, formulated from novel polyol compositions, were explored for the entire polyol family.
To distinguish between PUD short names for adhesives and coatings, the PUD short name has an “A” prefix if it is an adhesive formulation or a “C” prefix if it is a coating formulation (i.e., A-PUD-0; 0% rPET adhesive formulation PUD). In this article, we will explore the effects of using varying composition levels of rPET, and their respective film property differences. It was hypothesized that increases in rPET content could bring observable trends with their respective coating and adhesive properties.
Polyol Design
When introducing rPET to the polyol composition, some adjustments had to be made to successfully accommodate this new component. The design of this polyol family containing varying levels of rPET kept all remaining molar ratios constant with respect to one another. As mentioned earlier, the first iteration did not contain rPET content (PEP-0), followed by increasing amounts of rPET (Table 1). The PEP-0 is simply a lower-molecular-weight version of the successful A0351-12 RHMA polyol. Subsequent polyols had increasing amounts of rPET incorporated as indicated. All polyols in the study were difunctional, and an attempt was made to control equivalent weights to a common value. The OHV ranged from 112-123, indicating relatively good control. Increasing amounts of rPET were successfully incorporated beginning with 10% and continuing through 40% in increments of 10%. The names used reflect the rPET content of the polyol. In order to process these new materials incorporating rPET, the base polyol composition (PEP-0) had to be slightly modified to avoid undesired side reactions. A very small change in the monomer composition was made to achieve this, and this modification is represented by the PEP-0 Mod composition. The new adjusted composition was then used for all further polyols incorporating rPET. Although it was a very minor change, we made this control base polyol only to compare physical properties with the original low-molecular-weight version of the RHMA polyol (PEP-0), which was used for all further testing.

Polyol Physical Properties
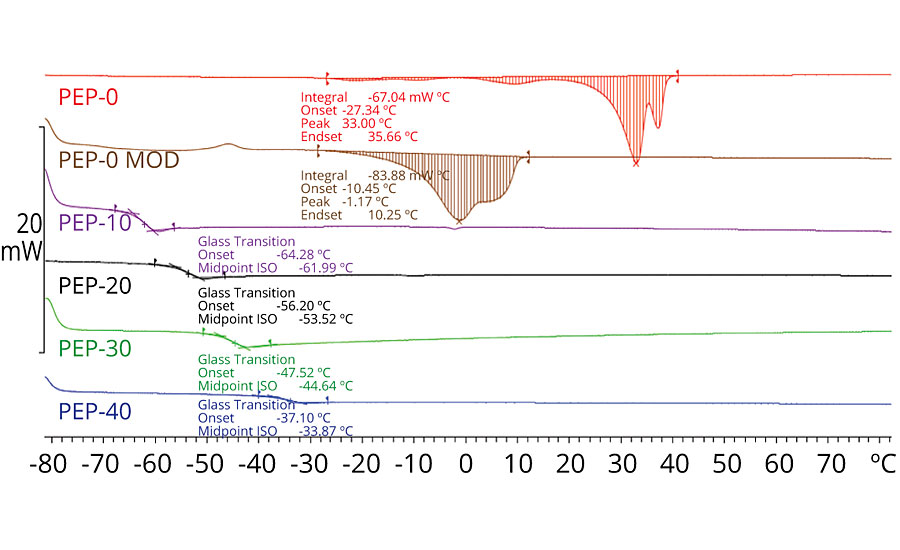
Based on the GPC analysis for the polyol family, we can make reasonable comparisons across the various compositions regarding the trends in viscosity and thermal transitions. Our molecular weight (Mn) averaged nearly 1,700 Da for the collective group, and the trend in viscosity was upward as we increased the rPET content. As seen in Figure 1, there is a melting temperature for the non-PET-containing polyols; however, when PET is introduced at any level, the melt transition disappears. The loss of crystallinity was evident from the thermal scans, and instead we saw very obvious amorphous transitions. These glass transition midpoint values trend in a linear upward direction with increasing rPET. The slight change in composition between PEP-0 and PEP-0 Mod reduced the melting temperature of the polyol system from 33 °C down to -1 °C.
2K Polyurethane/1K Waterborne Coatings
The 2K polyurethane coatings were evaluated using hexamethylene diisocyanate trimer (HDIT). These 2K polyurethane formulations for coatings were all produced at a 1.1:1.0 isocyanate to hydroxyl ratio, at 55% solids in a 50/50 w/w blend of propylene glycol monomethyl ether acetate (PMA) with methyl ethyl ketone (MEK). The reaction was catalyzed with 0.05% dibutyltin dilaurate. These 2K coatings were drawn using a #50 wire-wound quick-draw bar. After drawing the films, they were flashed at room temperature for 30 min, and then baked at 130 °C for 1 hr. Dry film thickness was measured for each, and fell between 1.20 and 1.50 mils.
The process for preparing the PUDs is outlined in previous work.2 Modifications were made to this process to remove regulated co-solvent and to improve the reaction profile and consistency of the products. This includes using acetone as a co-solvent in place of N-methyl 2-pyrrolidone (NMP) and using reaction temperatures as high as solvent allowed. A 3-inch Cowles blade was used with an inverted impeller installed 15 mm above the Cowles blade. A syringe pump was used to meter additions of neutralizer and water to the system. All PUDs generated from this polyol family were made using isophorone diisocyanate (IPDI). PUDs were drawn using a #70 wire-wound bar. After drawing the films, they were flashed at room temperature for 1 hr, and then force dried for 1 hr at 130 °C. Coatings were drawn to achieve a final dry film thickness between 1.20 and 1.80 mils.
PUD compositions were based on a formulation optimized from a previous DOE study.3 The detailed Resinate process using inversion was also discussed within that paper. The PUDs for coatings in this work were formulated with an isocyanate to hydroxyl ratio of 1.6:1.0, using dimethylolpropionic acid (DMPA) at 4.5% and 9% alkoxylated trimethylolpropane (Y-MER N120) on prepolymer solids, both supplied by Perstorp. Dispersions were all chain extended with ethylene diamine to 95%.
Film Property Similarities
All PUD and traditional 2K coatings passed mandrel bend at 1/8 inch (ASTM D522-17). All PUD and 2K coatings also passed direct and reverse impact of 160 inch-pounds (ASTM D2794-93), except for C-PUD-40, which had a direct impact failure at 60 inch-pounds and a reverse impact failure at <10 inch-pounds. These materials exhibited excellent flexibility, regardless of the amount of rPET in the polyol composition. In the higher shear test (impact), higher levels of rPET above 30% may be detrimental (higher Tg). This does not seem apparent with the lower shear (mandrel) test up to 40% rPET content.
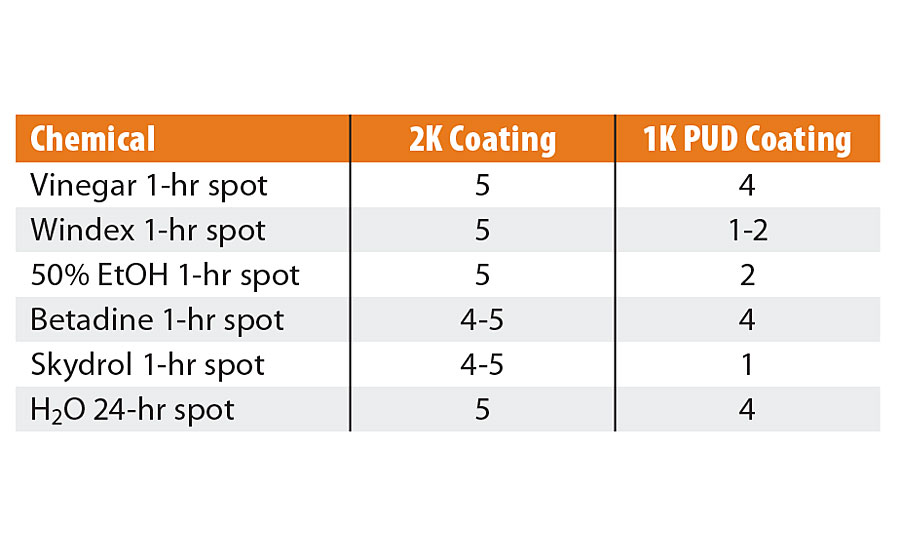
Stain testing performed on all 2K polyurethane and 1K PUD coatings is reported in Table 2. To apply chemical spots, filter paper was placed onto the coating surface, chemicals were applied to filter paper, covered with a watch glass and exposed for 1 hr, except H2O (24 hr).After the allotted hour, stains were uncovered and evaluated per ASTM D1308-02, rated as 5 (no effect) down to 1 (total removal). The entire range of compositions used for both 2K polyurethane and 1K PUD coatings had similar performance against each chemical, within their respective group, regardless of rPET content. Within the set of 2K coatings, there was little significant difference in resistance to: vinegar, Windex, 50% ethanol, Betadine, Skydrol and H2O; all were excellent. Notably, as the rPET percentage increased for the 2K group, there was an observable improvement in resistance to the Betadine and Skydrol (4 to 5), reduced to an almost unnoticeable effect at 40%. Within the PUD set, performance was good against vinegar, Betadine and H2O. However, susceptibility to Windex, ethanol and Skydrol was observed.
Film Property Differences
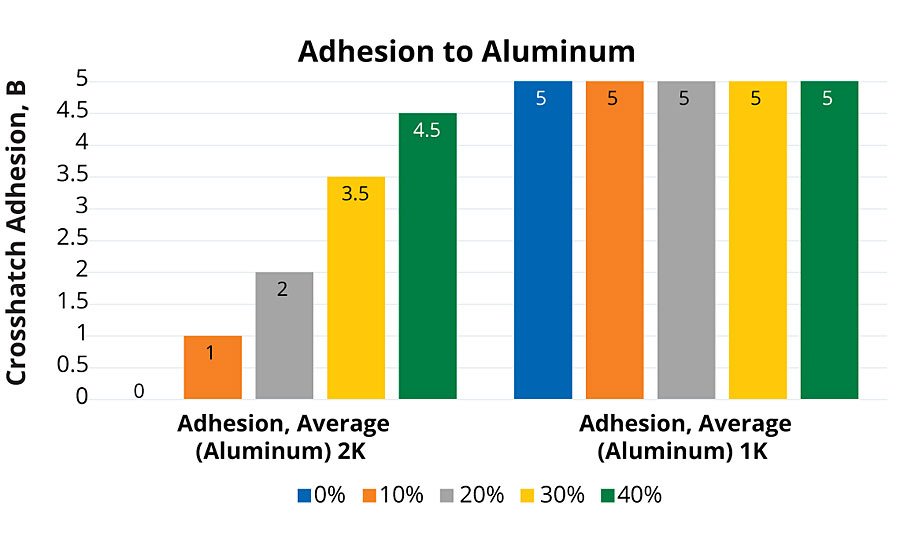
Adhesion testing was performed over aluminum substrates (Q-Panel A-46). Cross-hatch (ASTM D3359-17) evaluations were performed with a Gardco® P.A.T. tester with PA2056 six-tooth blade at 2.0 mm spacing. The full set of 1K PUDs had excellent adhesion to aluminum substrates (Figure 2). This was assisted by the additional acid functional groups incorporated for compatibility with water. The 2K coatings had a positive-trending improvement in adhesion performance with increasing rPET content. This increase in adhesion performance could also be weakly correlated with acid value of the polyol, having slightly higher values at higher rPET levels.
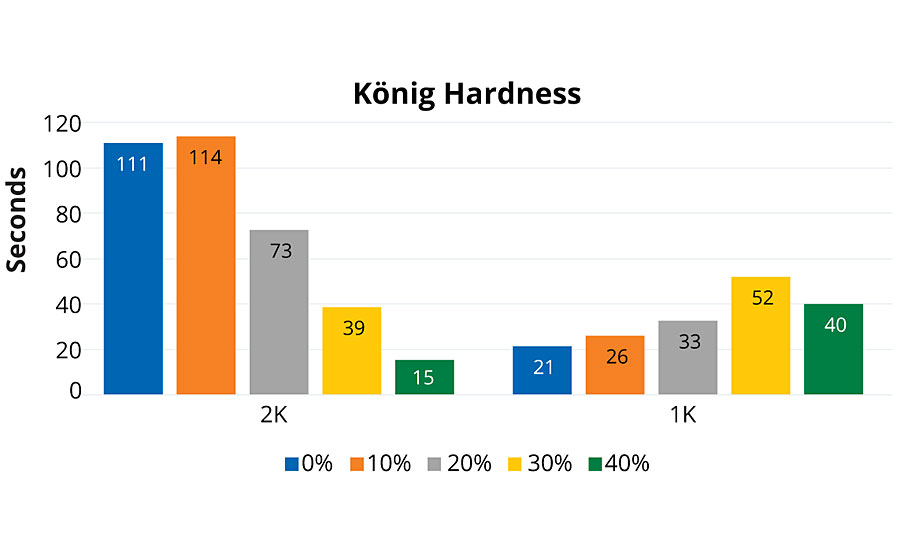
Within the 2K family of polyols, as the percent rPET in composition increased from 10%, a steady but gradual decrease in pendulum hardness (ASTM D4366-16) was observed. This may be linked to both the loss of any detectable crystallinity (Figure 1) as well as possible residual solvent effects (PMA, bp 146 °C) after 130 °C cure. However, films were retested two months later with very little change. Alternative curing agents may produce harder films than observed with HDIT. Within the 1K PUD group, there was an increase in hardness as the amount of rPET increased; there was a slight reduction in hardness above the 30% rPET composition, which may indicate an “optimal” composition in the ladder, when targeting film hardness. As a general observation, qualitatively, all of the 2K polyol coatings exhibited a very high coefficient of friction (COF), whereas the 1K PUD coatings were smooth and glassy with much lower COF.
MEK double rub test was performed following a modified ASTM D5402-15, using a 32-oz ball-peen hammer wrapped in grade-50 cheesecloth. For the 2K group, the two lowest rPET content coatings had relatively poor resistance (Figure 4). As rPET content increased, we observed an increase in MEK resistance, corresponding with higher aromatic content. The 30% and 40% results were statistically very similar, although an optimal composition may be proposed as before. The reduced performance for the 0% and 10% rPET compositions is interesting, especially given that their crosslink density is expected to be very similar to that of the higher rPET films. This is consistent with the composition of the polyol component having some responsibility for the chemical resistance.
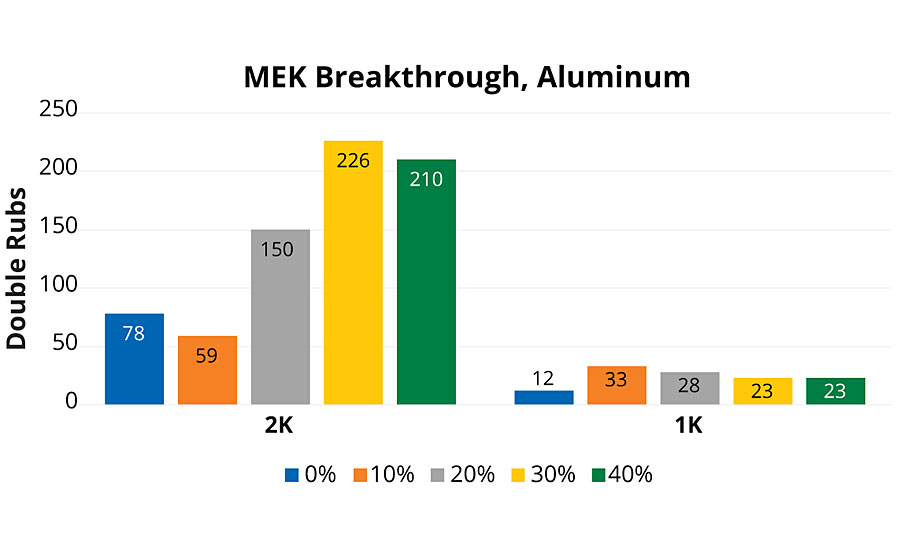
The 1K PUD coatings group had unremarkable MEK resistance. This was not surprising, since these systems were not crosslinked. There was slightly improved MEK resistance with 1K PUD coatings that contained rPET over the PUD made from PEP-0.
Pencil hardness was performed according to ASTM D3363-05. The test utilized Mitusbishi JPIA pencils rating from 6B to 9H. The pencil test assesses two different modes of failure: pencil scratch, indicating the first sign of coating damage, and pencil gouge, indicating full excavation of the coating. All 2K polyurethane coatings achieved a minimum 3H scratch and gouge rating (Figure 5). These coatings have inherently good resistance to scratching, until the coating is finally excavated from the surface. The mechanism of the hardness evaluation is far different using pencil hardness versus pendulum hardness (ASTM D4366-16). We can usually correlate higher pencil hardness with higher toughness of the films.
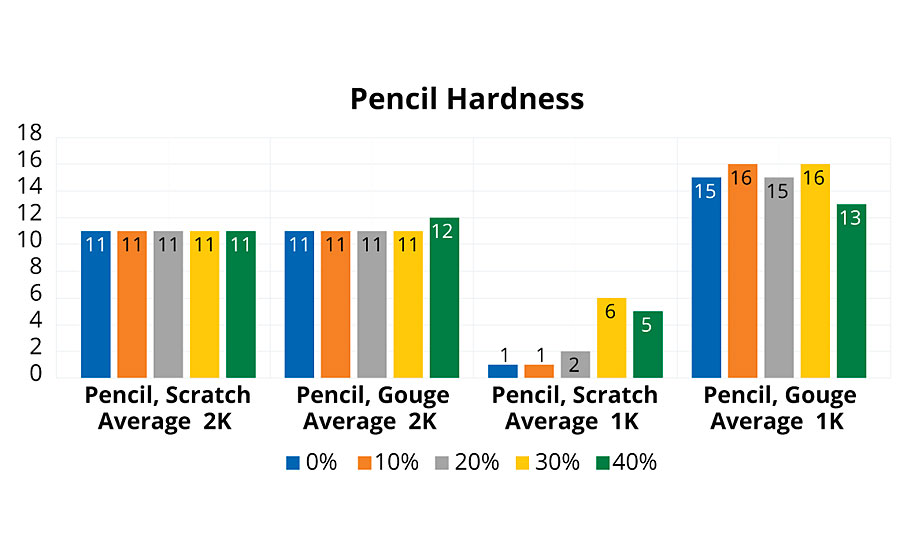
The 1K PUDs exhibited similar, excellent gouge resistance, with the average between 6H and 7H. These PUD coatings have a high resistance to excavation. Scratch resistance for the 0% and 10% rPET 1K PUD coatings was poor, achieving only a 6B rating. Above 20% rPET, a maximum rating of B was observed. This improvement in scratch resistance could be attributed to slightly higher Tg associated with higher rPET content.
Free Films
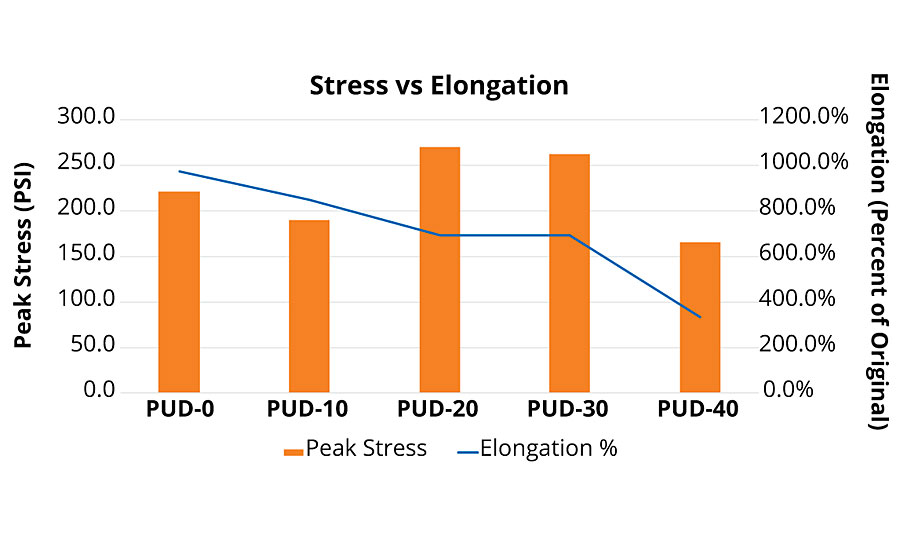
Free films (ASTM D4708-12) were cast to evaluate 1K PUD elongation and tensile strength. The film was formed by applying a thin layer of the PUD to a 6”x 6” bottomless, square cake mold over a silicone mat. Films were allowed to flash for approximately five days before being peeled from the silicone mat and allowed to dry upright for approximately three days. The test specimens were cut from the film using a razor blade. Films were cut into ½-inch-wide strips, and thickness was measured with a micrometer. Strips were pulled at 1-inch gauge length on the MTS Sintech 2/G. Ten strips were tested for each sample, and the most consistent (width, thickness and observed strength) five data points were chosen. Again, in free films we saw an optimal composition trend (Figure 6). As the rPET composition approached 20-30%, tensile strength reached a maximum. Elongation continuously dropped as rPET content rose. However, a nice balance of strength and elongation was seen at moderate rPET levels. Above 30% rPET in composition, elongation and peak stress of the free film showed a decline in performance. Optimal composition gave 260-270 psi at almost 700% elongation for this PUD formulation. Optimization of the PUD formulation for even stronger films is possible, with alternative ingredients (diisocyanate or blend) and ratios used.
Adhesives
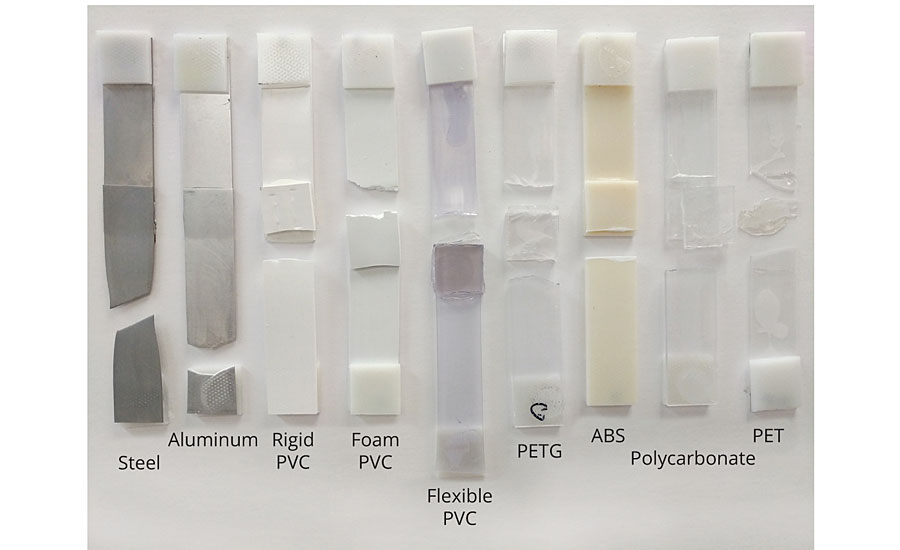
To observe adhesive performance of this polyol family in a waterborne PUD adhesive, each polyol was converted using the modified formulation described as follows. PUDs for adhesives were formulated with an isocyanate to hydroxyl ratio of 0.9:1.0; a 1.5:1.0 molar ratio of DMPA to polyol hydroxyl; alkoxylated trimethylolpropane was removed for the adhesive formulations. For all substrates, a commercial EVA hot-melt adhesive was included as a control. PUDs were first applied to the substrate using a pipette. Substrates were various compositions cut to 4”x1”x0.25” (full list below). The area of the overlap was 1 square inch. The PUD was dried to a solid. Heat was applied to activate adhesive properties. Substrates were compressed together at approximately 70 psi. Finally, they were cooled to room temperature, and pulled in a lap shear configuration. Lap shear was done using an MTS Sintech 2/G, equipped with a 10 kN load cell. Ten substrates were tested, including: acrylonitrile butadiene styrene (ABS), aluminum, steel, rigid polyvinyl chloride (PVC), polycarbonate, nylon, glycol-modified PET (PETG), polystyrene, flexible PVC, and PET. Adhesive performance is shown graphically in Figures 7a and 7b.
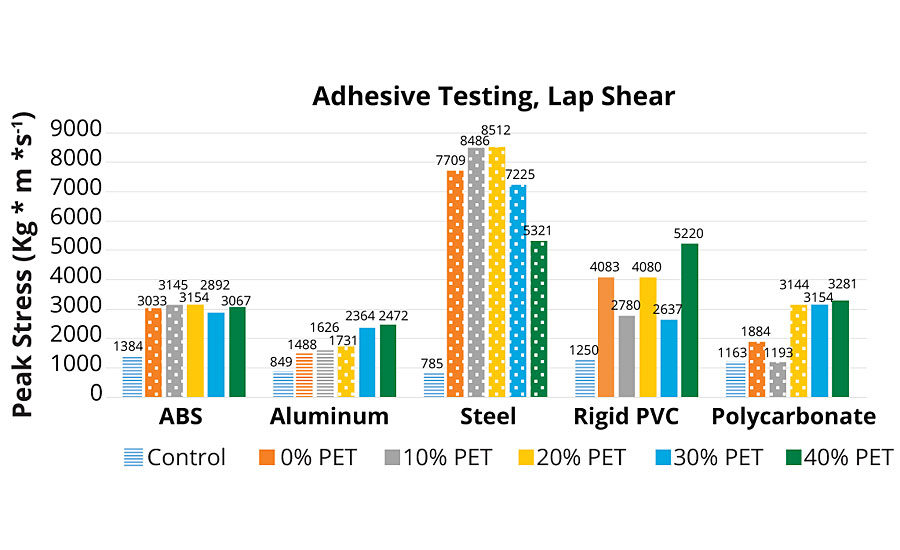
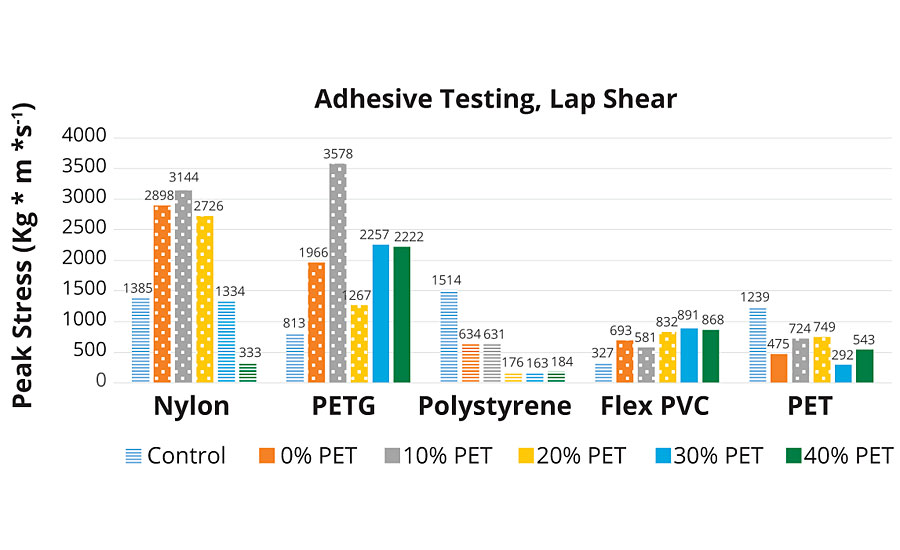
As shown in Figures 7a and 7b, the control adhesive demonstrated adhesive failure over all substrates. This material is sold commercially as a multi-purpose, multi-substrate assembly adhesive. A positive increasing trend is observed across the group of A-PUDs for aluminum, PETG, flexible PVC and polycarbonate. For these four substrates, the highest two levels of rPET resulted in substrate failure, the three lowest rPET adhesives resulted in cohesive failure. This result for these substrates indicates a higher strength bonding material with higher levels of rPET.
Steel and nylon substrates (steel in Figure 7a and nylon in Figure 7b) were observed to have a bell-shaped response to additional rPET composition. This response is consistent with defining an optimal rPET composition for selected substrates. At peak performance (10% rPET loading), failure mode was consistently cohesive.
Polystyrene substrate did not demonstrate any performance correlation with the amount of rPET in its adhesive composition. The experimental adhesives had the best performance at 0-10% and slightly worse with 20-40% rPET in composition. It is noteworthy that of the 10 different substrates tested, polystyrene and PET were the only substrates where the new adhesive technology did not outperform the control. In the polystyrene adhesion testing, all tests failed by adhesion to the substrate, possibly indicating a need for some kind of surface pre-treatment, as with many polyolefins. However, for the PET substrate, although the peak stress was higher for the EVA control (adhesive failure), the higher rPET content adhesives failed at lower stress by substrate failure.
On ABS, cohesive failure was observed in A-PUD-10, 20. Higher PET composition adhesives, while not having a higher peak load, still achieved substrate failure. No visible trend related to rPET content was observed, although all experimental adhesives outperformed the control.
For the rigid PVC, all experimental adhesives again outperformed the control, and all were substrate failures. There could be a slight trend toward higher stress load at higher rPET content, but it does not appear linear with concentration.
Additional formulation work has been explored to determine the optimal adhesive PUD formulation within this family of rPET containing polyols. By varying components within the PUD formulation, while keeping the polyol constant, ultimate adhesive strength has been improved, and the resulting substrate failures are shown in Figure 8.
Conclusions
A family of polyols having similar OHVs, with increasing levels of rPET content was prepared. These were evaluated in both 2K urethane and 1K PUD systems for their film attributes, and trends were observed. Free films and PUD adhesives from this family were also prepared to observe performance trends. For the coating systems, there appeared to be an optimal loading of 20-30% rPET where certain properties were maximized. There was a drop off in performance at higher rPET level than 30%. This trend was observed in the 1K PUD free films, 1K PUD pencil scratch, 1K König hardness and 2K MEK double rub tests. The 2K aluminum adhesion test did not indicate an optimal loading, with increased adhesion through 40% rPET. It was observed to be no effect of rPET levels on 2K pencil tests, 1K pencil gouge, 1K MEK double rubs, and 1K adhesion to aluminum. Finally, there appeared to be a loss in performance with increasing rPET content for 2K König hardness. As an overall conclusion for coatings, increasing the recycled PET content in the polyols generally improves properties to a point, and this work has established where the optimal range exists.
The broad utility of the commercial EVA adhesive is well known, a wide variety of substrates are recommended for use by the manufacturer. From the data above, the polyol technology introduced here has outperformed this commercial benchmark for eight of 10 substrates tested. This polyol family has poor adhesion to polystyrene, and on PET, substrate failure was achieved at lower peak stress than the control. The other eight substrates demonstrated higher peak stress loading than the EVA assembly adhesive, and many failed at the substrate. All EVA tested substrates failed by adhesion to the substrate, with no observed substrate failures. Depending on the target substrate, there may be an optimal rPET composition, and the roadmap is outlined here in this work. Generally, it was observed that stronger adhesive properties were shown with higher introduction of rPET, but for a few substrates, there appeared to be an optimal level.
Design of polyols with varying levels of rPET afforded insight into how this important recycled material ultimately affects end use performance of resulting polyols. Trends in most adhesives and coatings performance reached their maxima at 30% rPET in composition, corresponding with the Resinate PEP1020-16.6 experimental polyol. By isolating on this component, insight was gained into how coatings and adhesives are optimized by increasing levels of this valued thermoplastic polymer. Ultimately, as Resinate produces sustainable solutions, we look to optimizing materials with reusable high-performance polymers, where upcycling is a top priority.
The authors gratefully acknowledge the contributions from our coworkers at Resinate. We also thank our suppliers for graciously providing samples needed to complete this work.
Looking for a reprint of this article?
From high-res PDFs to custom plaques, order your copy today!


