Unlocking Additional Benefits in Sustainability
Synergies of Biorenewable with Recycle Content for the Future of Performance Coatings

In keeping with current trends toward greater sustainability in all aspects of commercial chemistry and manufacturing, the coatings industry has embraced this challenge and has begun to push its suppliers in this direction. Specialty feedstocks for resins, solvents, additives and even some containers have already made significant progress in their ability to offer alternative options with a “greener” footprint. Many of these have taken a new pathway with agricultural or biorenewable starting points, and continue to bring “old” and new products to the industry, 1 which are produced more in line with the principles of green chemistry. 2 Our work within this new mindset has continued forward, and major advances are already in place in the coatings industry. The global plastics waste problem has heightened awareness of the responsibility of current generations to actively address the 300 million tons of plastic waste produced every year. 3 In the United States, the EPA estimated that in 2017 only 8% of plastic material (2.9 million tons) in the solid waste stream was being recycled, with the rest going to landfills (26.8 million tons) and incinerators (5.6 million tons). 4 In 2017, global plastic waste was calculated at 9.1 billion tons. 5 In addition, 8.8 million tons of plastic waste is flowing into our oceans each year. 6 We present here the encouraging results from a designed study looking at the combination of recycled and renewable feedstocks, as well as the use of non-metallic corrosion inhibition, resulting in a new product for superb metal substrate protection.
Design
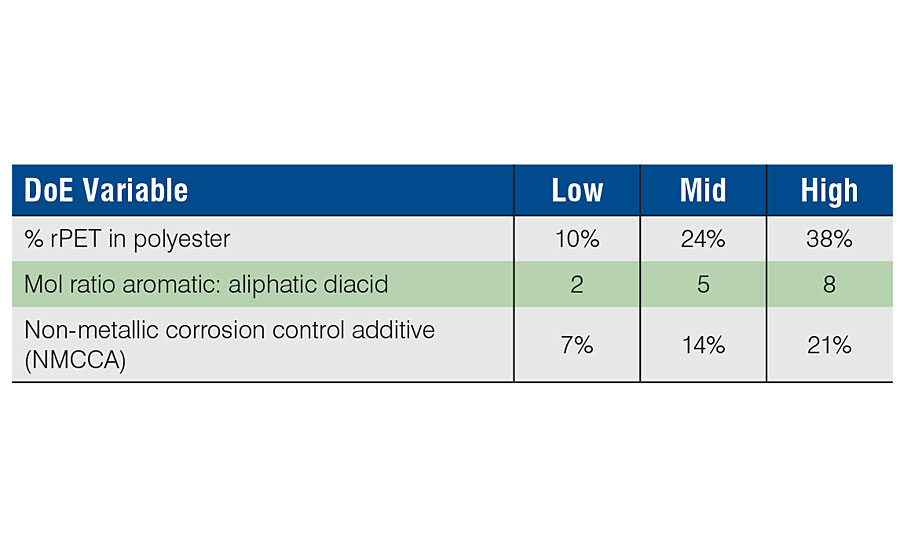
To optimize the greatest synergies from recycle and biorenewable content, a design of experiments (DoE) approach was chosen. We used JMP ® software to design the experimental setup, using three independent variables: percent recycled PET (rPET) incorporated in the polyester; percent non-metallic corrosion control additive (NMCCA); and the molar ratio of aromatic to aliphatic (biorenewable) diacids used. A 3-level Box-Behnken design was chosen. The rest of the ingredients (glycol mixture) were carefully controlled to remain as constant as permissible, theoretically yielding the production of all individual polyester compositions at the same molecular weight, acid value and hydroxyl value. Properties such as viscosity, color and glass transition were measured outputs and did not have target goals. The materials were all made under the same process conditions using the same commercial lots of raw materials for each polyester. Cycle times varied slightly since temperature profiles used were kept constant and reactivity of ingredient mixtures were all slightly different. Polyesters containing higher levels of rPET required slightly longer digestion times prior to second stage additions. Finished materials were diluted with n-butyl acetate solvent for ease of application work and were further evaluated as two-component (2K) urethane films using hexamethylene diisocyanate trimer (HDIT). The measured film properties were then used to build models from a Box-Behnken response surface format. The optimization of these models was done individually, with removal of trivial interactions. Statistically significant optimized models were finally combined in the response surface profiler, where multiple models were simultaneously optimized for highest overall performance of the films. The software mathematically produced a theoretical composition to provide the highest performance across multiple key film properties at the same time. This proposed composition was then later made using the original process conditions and evaluated for validation of the statistical models. We discuss the outcome of this work, and the results of the validation toward the goal of sustainable, high-performance polyol materials for -coatings applications.
It was known from previous work that the introduction of rPET to a semi-crystalline aliphatic polyester backbone will remove the crystallinity at moderate levels of incorporation (10-20%); but as the amount goes higher (30-40%) some degree of crystallinity may return. So, this is a “tunable” property along with any benefits from crystalline content. The non-metallic corrosion control additive (NMCCA) was previously commercialized and discussed, along with corresponding ASTM B117 salt spray results for 1,000 hrs exposure vs. a heavy metal counterpart (Sr-Zn-phosphate). 7 These results indicated superior performance of the NMCCA, and here we explore optimal usage levels within the recycle/renewable feedstock space chosen.
Experimental
The compositions evaluated are shown in Table 1. All batches were scaled at 1,400 g total charge, using a 2-L, four-neck round-bottom flask, equipped with an external motor-driven stirrer with bearing, nitrogen inlet, partial condenser (vacuum insulated silver jacket), total condenser with receiver, and internal temperature probe. The rPET was charged with the glycol mixture and catalyst, then stirred while heating to 210 °C to digest the high-molecular-weight rPET to a lower-molecular-weight distribution; a homogeneous, clear, low-viscosity mixture. At this point, the additional ingredients as specified by the design criteria were added to the digestion mixture at 140 °C, and the reactor contents were slowly heated to evolve condensation water, moderating batch temperature with the overhead temperature (90-95 °C) to avoid glycol losses. The batch temperature maximum was 210 °C and was held to a final acid value target of 5 mg KOH/g, then immediately cooled. When the temperature had cooled to 120 °C, n-butyl acetate was added to produce the final product at 80% solids. This was a workable form for making the 2K urethane coatings used for evaluation of the performance properties.
Polyol Processing
All 14 batches of material were successfully completed within a 4- to 5-day timespan, over a 7- to 8-hr cycle time each day incorporating both a heat-up and cool-down at the beginning and end of each day. Batches were not run continuously overnight due to a lack of any remote process control available during this time. In this manner, each batch finished within the final acid value target range of 4-8 mg KOH/g sample.
Polyol Properties
The final color of all batches was measured using the Gardner color rating scale. The viscosity of the batches was measured using a Brookfield DV III Ultra viscometer with a temperature-controlled Thermosel. Final hydroxyl values were obtained using a Mettler SD 660/T-70 auto-titrator system, Tg was obtained from a Mettler DSC 3 Star System, and mol wt. was determined against polystyrene standards in THF solvent using a Shimadzu Prominence LC 2030 GPC with RI and UV detection. Densities were measured using a density cup and following ASTM (D1475) methods.
Polyurethane 2K Films and Properties
The 2K films were prepared using a 0.9:1.0 NCO:OH ratio of Vestanat HT2500/100 hexamethylene diisocyanate trimer (HDIT) supplied at 21.8% NCO by Evonik, and blending with the polyol in a Thinky AR-250 conditioning planetary mixer. All panels were drawn down using a #60 wire-wound drawbar then flashed at RT for 30 min. Panels were next heat dried using a VWR gravity convection oven at 130 °C for 1 hr, resulting in a dry film thickness of approximately 1.4-1.9 mil. Performance properties of the films were subsequently determined by the following methods. A THQ fully automatic König pendulum hardness instrument was used. MEK double rubs were performed manually using a 32-oz hammer, grade 60 cheesecloth. Also, pencil hardness (Mitsubishi, JPIA-certified pencils); chemical spot/stain resistance (ASTM D1308 - rating of “1” indicates poor performance; rating of “5” indicates excellent performance); flexibility by mandrel bend and T-bend methods; crosshatch adhesion (Gardco ® P.A.T. tester with PA2056 six-tooth blade at 2.0 mm spacing); impact resistance (direct and indirect); boiling water resistance after T-bend; detergent soak; and salt spray exposure for corrosion evaluation (B117) were all performed using ASTM methods. For the T-bend evaluations (before and after boiling water), only 0-T was used, the bend was then covered with adhesion test tape, and pulled. Resulting loss of any coating was rated using the crosshatch/scribe adhesion rating system, 0-5 based on percent removal (ASTM D3359). The ratings for crosshatch reverse impact testing (before and after boiling water) used the same system. For the detergent soak test, panels were removed and rated using the blister rating scale from ASTM D714, then converted to a 10-point scale based on size and relative density. A rating of 10 was best, having no blisters, and a size 2 blister with a dense rating was scored as a 0.5 rating.
Results
Measured Properties of Designed Polyols
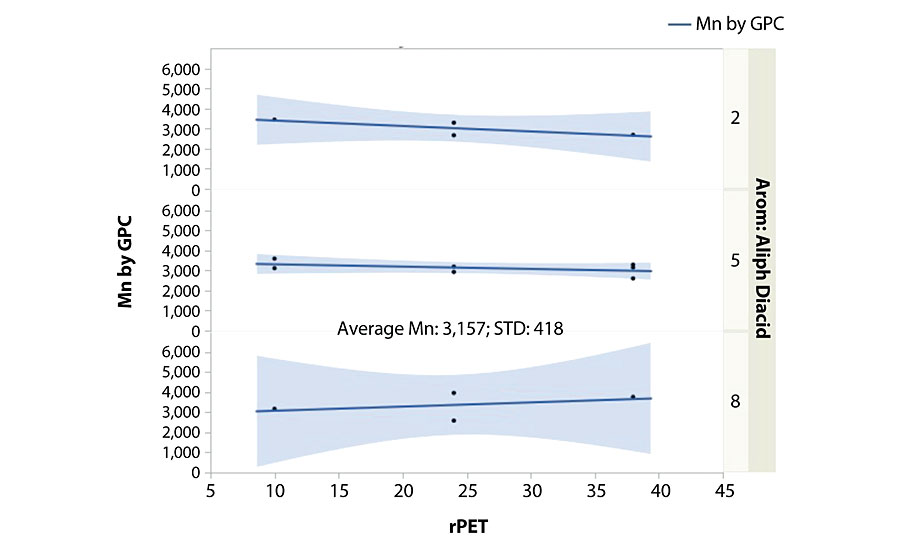
The polyols generated from this study were designed to target equivalent (or very similar) molecular weight, hydroxyl value and acid value. The equipment used was kept constant for each setup, along with heating conditions, operator and raw material batches. All polyols were designed using an internal spreadsheet polyol design calculator to assist with proper monomer ratios and target properties. Resulting batch materials were evaluated for molecular weight by GPC (vs. polystyrene standards), hydroxyl and acid values, density, viscosity, color and glass transition (Tg) by DSC. Molecular weight was well-controlled (Figure 1) when grouped for varying diacid mixtures (aromatic/aliphatic) and their associated reactivity. We saw identical results for the measured viscosities when looking at the same profile. Both of these outputs were best represented statistically by their respective mean values for all the batches. Hydroxyl values varied slightly (average 36.0; std dev 4.6) and tracked closely with measured molecular weight. Typically, with high-temperature condensation reactions there may be varying degrees of glycol losses, depending on the compositional mixture. Although the attempt was made to control this through the use of insulated partial columns, the final hydroxyl range was approximately 27-43 mg KOH/g, highly correlated (R 2 = 0.98) with the measured molecular weight range of 2,600-4,300 (average 3157; std dev 418). The final acid value targeted 5 mg KOH/g, and averaged 5.6 with a 2.2 std dev.
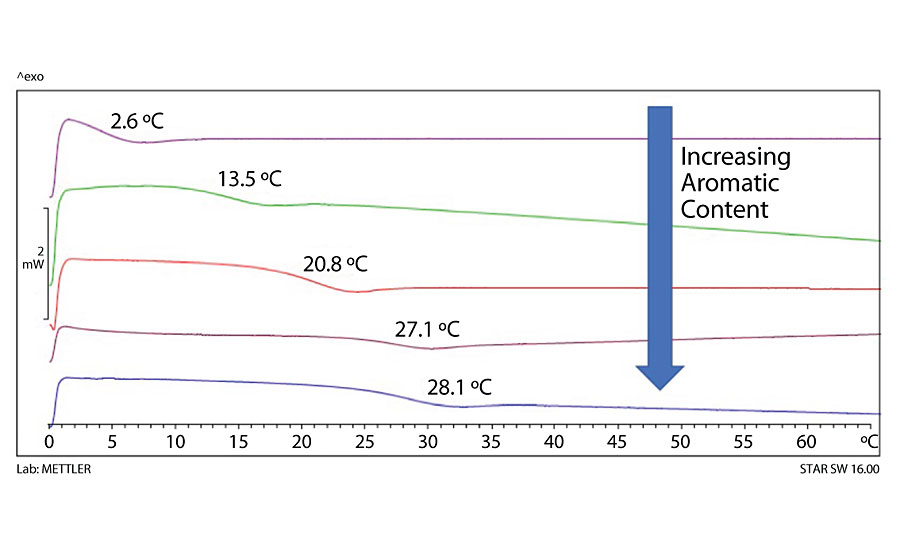
We were able to model the unpredictable polyol properties of color (R 2 =0.94) and observed Tg (R 2 = 0.90). Density did not provide a statistically significant model. The color model was strongly influenced by the rPET content and its interactions. For a given stream and batch of rPET, this is not unexpected since it may carry slight color into the batch and would thereby directly impact the final color based on the usage level. The Tg was also influenced by the rPET content, along with the diacid ratio used. Higher aromatic content overall from these two factors contributed to the highest Tg polyol compositions (Figure 2). For this experimental design space, we could model both the color and Tg to meet final application needs when these criteria are critical.
Significant Models from Measured Outcomes
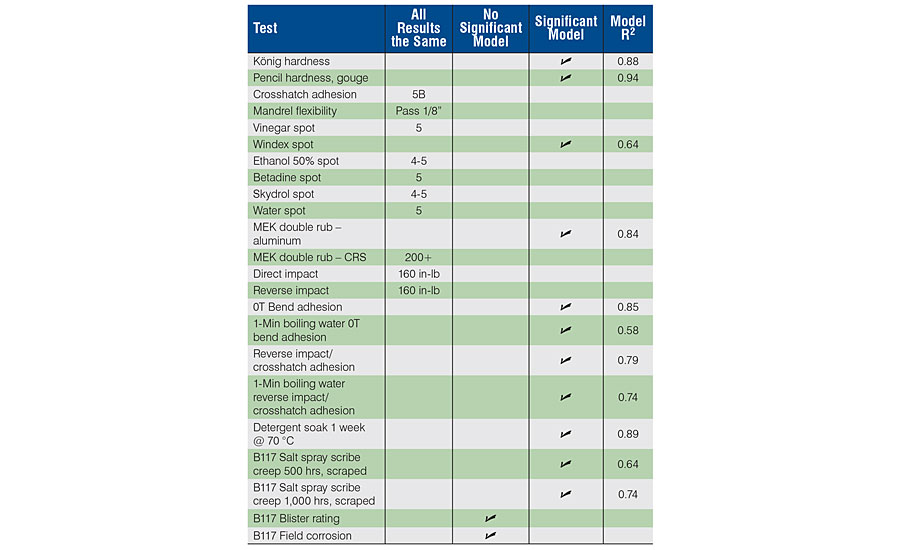
The polyols were all formulated as 2K coatings with HDIT and applied to metal substrates (Bonderite 1000 P99X 4x6 x 0.032 and 4x12 x 0.032 from ACT and A-46 aluminum 4x6 x 0.025 from Q-Panel). The list of measured performance tests is shown in Table 2. All films appeared clear, non-hazy, with no detectable defects. Films were all of measured average thickness of 1.66 mil +/- 0.28. Significant models were statistically different from the mean at a 95% confidence interval (p-value < 0.05). Tab, 2 shows where we found significant models, did not find significant models and where we saw consistent performance without any differences. For all but two of the consistent measurements, they were performing at the highest level of the test scale. This was the case for crosshatch adhesion, mandrel flexibility, betadine spot, water spot, vinegar spot, MEK double rubs over CRS, and both direct and reverse impact tests. The only deviations from this were the Skydrol and ethanol spot tests, where the results were consistently a 4-5 rating (5 is best). We had some differentiation but were unable to produce a significant model for the field and blister ratings on the salt spray panels. The field outside the scribe area was relatively unaffected, with very little blistering and without general differences between the various polyols tested. For the remaining 11 outputs, we had statistically significant models with which to optimize a composition that could address those performance parameters, along with the two significant models for color and Tg. Also, if we include the scores for the eight tests that had consistent high performance, we would then have a total of 21 beneficial performance features that can be controlled through polyol design. This was a powerful tool to complete the final optimization of a polyol composition having a wide range of desirable properties, based on a balance of recycled and renewable content along with a non-metallic corrosion control additive.
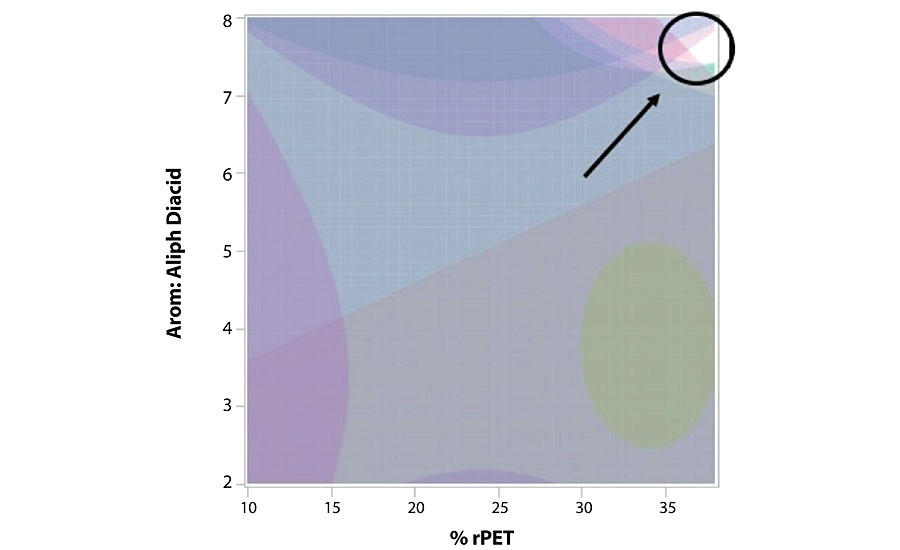
Optimized Final Composition
Our statistical design software allowed us to incorporate all 11 significant models as predicted formulas. It then could simultaneously optimize through that entire design space to find potential compositions that maximized all features at the same time. This is the power of using designed experiments, where the statistics help guide the choices of appropriate models, and when all models are finished, can be thoroughly compiled over the range of experimental variables to predictably find optimal performance. We did this using the profiler within JMP software, and the output is visually shown in Figure 3. With hard threshold performance levels set, the graph indicates “not met” space by shaded areas of the two-dimensional graph. The graph is showing the full ranges studied for percent rPET on the X-axis and the diacid ratio on the Y-axis. The third variable was accessed by varying the percent NMCCA (non-metallic corrosion control additive) across its entire experimental range (7-21%) by using a slider control, which added a third dimension to the graphic. As the slider was moved, any available “white space” indicated a region where all modeled performance targets are met or exceeded simultaneously. As seen in the figure, the optimal compositional space that met all targets was quite confined (located in the upper right corner of the graph) and corresponded to a level of NMCCA indicated on the slider (14.5%). There were 12 models incorporated for this analysis, however only 11 of these were used to find the optimal. This was due to the lack of a target goal for the measured Tg, for which no limitation was made. We were interested in knowing what the predicted Tg would be for the optimal system, but it was not used as a constraint.
Synthesis of Optimal Composition and Measured Properties
The profiler application visually provided a limited fraction of the compositional space within which all performance targets were met or exceeded. We adjusted our levels accordingly on a new batch sheet, since this new optimal composition was not included earlier in the study as one of the design points. The optimal composition had high levels of both aromatic diacid and rPET, which both seemed to correlate with higher performance in a majority of the models. The NMCCA content was closer to its midpoint range, apparently not showing much further benefit at higher levels. Looking back at the combined data set, it was interesting to find that at the lowest settings for all three variables (diagonal corner from optimal), performance was overall fairly poor. We proceeded to assemble the same experimental setup as before and made the new optimal composition to compare with its predicted results. We maintained all the same constraints as before, to achieve the closest conditions as possible to the original process.
Film Properties of Optimal Composition (2K and 1K)
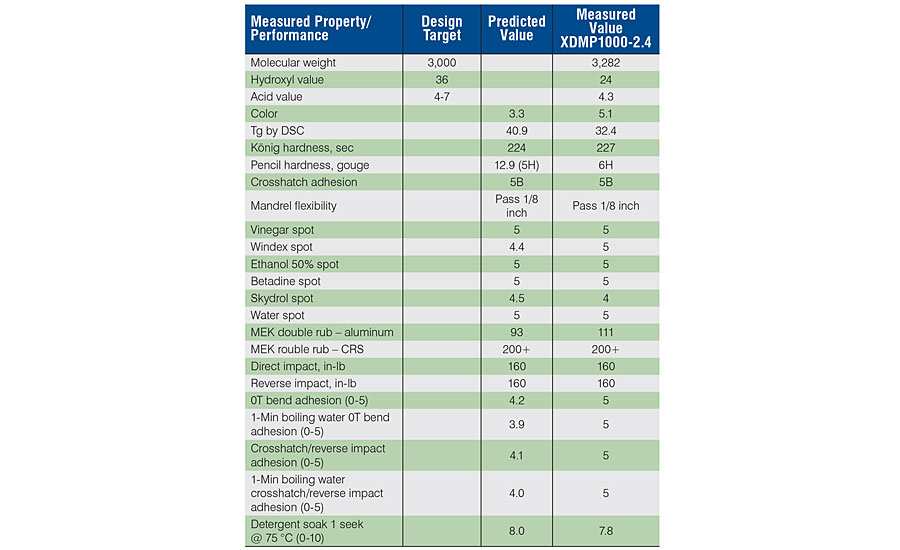
The newly designed material, XDMP1000-2.4, was successfully prepared and evaluated for polyol properties and 2K film performance as all previous samples. The data are shown alongside the predicted values in Table 3. As of this writing, salt spray data were not available, so we could not include those results.
Discussion
Correlation of Design Controls with Film Properties
When we looked at the significant models, we saw where the strongest influence was coming from within the controlled variables (Table 4). For the 13 models used for optimization, two were from the polyol properties (color, Tg) and the rest from the 2K film performance. All variables played into a number of the measured outputs, as shown in the table. Having this understanding helps build structure-property relationships for future developments using recycled content and biorenewable feedstocks to create high-performance sustainable polyols.
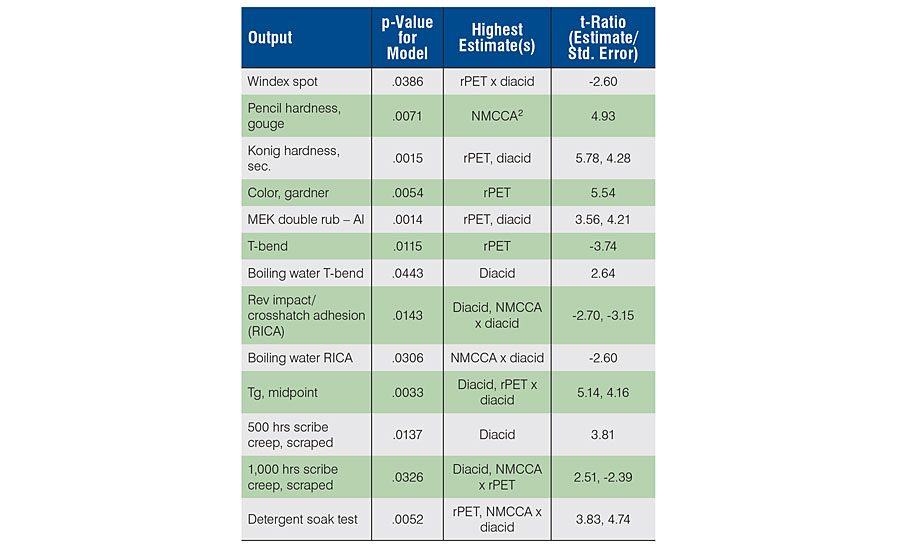
A few interesting notes arose from the information in the table. All models had a p-value below 0.0500, testing the probability that the F-Ratio for the model was significantly different from the mean for all the measured values. The given p-value threshold provided 95% probability that there were significant effect(s), so lower values were higher probability. The coefficients in the model were the estimates, and the ratio of these values to their standard error provided the t-ratio for each term in the model. The ones with highest significance are shown in the table. For negative estimates (negative t-ratio) in linear terms, the effect of the term is negative. For non-linear terms, we assume an inverse relationship may exist. It is interesting from the table that the rPET variable appeared as a significant contributor in 8 of the 13 models. This influence on performance properties was important to help understand the varying effects rPET had, and how its use level could be best optimized. Similarly, the ratio of the aromatic to the aliphatic diacid appeared significantly in 10 of the 13 models, again validating its significance in design of these systems. We were surprised at the contribution from the NMCCA toward the toughness of the films, as determined by pencil gouge testing. In addition, at the 500-hr interval for salt spray exposure, the NMCCA was not a significant variable, however, at 1,000 hrs it became significant. Perhaps the initial 500 hrs was more dependent on simple barrier protection and diffusion through the films (influenced mostly by higher aromatic acid content) and for the second 500-hr interval the mechanism shifted towards the ability of the system to shut down electrochemical activity at the metal surface, more influenced by the ability of the corrosion control additive to interfere with this aspect.
Optimal Polyol for Protective Coatings – Performance. Value. Sustainability.
The optimized polyol composition was prepared, analyzed and evaluated in a 2K film as described previously. As shown in Tab 3, for the testing that was able to be completed by this writing, there was good agreement with the predicted values. As a result of the successful optimization, this composition can now be stepped through the scale-up process toward commercialization. This was the goal in understanding these variables, to ultimately and efficiently fast-track product development toward commercial success by balancing the recycle and renewable content with the primary goal of advantaged performance. It is interesting to note that although the aromatic diacid content was optimized at the high end of the design space, there was a ceiling limit where too much would begin to degrade performance. For the set of performance tests that we screened, this type of information is necessary to properly design sustainable polyol structures to meet all the requirements. With this approach, and the proper choice of the levels for each component, we were able to confidently produce a new polyol product with highly sustainable components, knowing that their individual, as well as their synergistic contributions would all be tuned for maximum levels of performance.
Conclusions and Next Steps
We continue to benchmark our products against currently available options for high-performance coating applications. We have leveraged all the performance advantages along with the positive sustainability footprint to introduce a new high-performance product. Diligence and development such as this study must be done to establish a “place at the table” for the environmentally- and performance-advantaged products that are based on non-petroleum feedstocks, and ultimately divert materials from landfills and incinerators. In this way, the coatings industry can make full use of the benefits toward the environment, while not giving up any performance. Products such as this are continuously being developed and sampled for the next generation of “performance coatings with awareness.” When proper scientific approaches to technology development are used, there is no limit to the boundaries we, and the coating formulators, can achieve for future generations and their essential coatings needs.
Acknowledgement
The authors would like to gratefully acknowledge their coworkers at Resinate, specific thanks to Dan Forbes, Ibrahim Rababa, Mitch Milne, Mike Christy, Cayla Allen, and Jason Rochette for help with testing and review of this work. Also, thanks go to Evonik for the generous commercial samples used to evaluate 2K film properties.
References
1 Shanks, B.H.; Broadbelt, L.J. A Robust Strategy for Sustainable Organic Chemicals Utilizing Bioprovileged Molecules. ChemSusChem 2019, 12, 2970-2975.
2 Anastas, P. T.; Warner, J. C. Green Chemistry: Theory and Practice, Oxford University Press: New York, 1998, p.30.
3 UN Environment Beat Plastic Pollution Page, https://www.unenvironment.org/interactive/beat-plastic-pollution/ (accessed Nov 21, 2019).
4 US EPA National Overview: Facts and figures on Materials, Wastes and Recycling Page, https://www.epa.gov/facts-and-figures-about-materials-waste-and-recycling/national-overview-facts-and-figures-materials (accessed Nov 21, 2019).
5 Office of Sustainability, Sustainable UGA Page, https://sustainability.uga.edu/scientists-calculate-total-amount-of-plastics-ever-produced/ (accessed Nov 21, 2019).
6 Cohen, J. The Current, UC Santa Barbara Feb 12, 2015, https://www.news.ucsb.edu/2015/014985/ocean-plastic.
7 Spilman, G.E.; Christy, M.C.; Comstock-Reid, B. High-Performance Coating Materials from Recycled Sources. Coat. Tech., 2017, 14 (10), 44-57.
Looking for a reprint of this article?
From high-res PDFs to custom plaques, order your copy today!


