A Closer Look at Colored Pigments
It is the pigments that bring color into our lives. They manipulate the incident light and reflect it more or less strongly. The light rays are described by the well-known color spectrum, which ranges from blue-violet to blue, green, yellow and orange to red. Pigments can absorb the incident light, they can reflect it or change it by interference. In all cases, light is always reflected in the entire color spectrum, there are no black holes. Thus, a red colored pigment reflects strongly in the red spectral range and less strongly in the remaining range of the color spectrum.
Optical Properties
The reflected light rays reach the eye and trigger an optical stimulus there. This is transmitted to the brain where it is translated into a color sensation. Colors are only created in the brain. And colors are described by their hue, their chromaticity and their brightness. Our color perception divides colors into four areas: Yellow, red, blue and green. There is no yellow that is bluish. A yellow can only be greenish or reddish. And a blue can never be yellowish, only greenish or reddish. The same applies to green and red: green can only be yellowish or bluish, but never reddish. And red can only be yellowish or bluish, but not greenish.
This description corresponds to our color perception, which is described by physiology. Outside our eyes, i.e. in the pigments, physics describes the processes that are shaped by light rays and their reflections. In particular, the mixing of pigments or paints is a physical process. And this process is also described by the reflections. Color measuring instruments record these reflections in comparison to a white standard. The reflections are then converted into physiological color values by the software. The CIE system is most commonly used to calculate L*a*b* values. Hunter Lab values are also used in some applications. The L* value corresponds to the brightness of the measured sample. The a* value indicates the value on the a*-axis (x-axis). It represents the proportion red-green (+a* = red, -a* = green). Correspondingly, the b* value shows the yellow-blue proportion and is represented on the b*-axis (y-axis). Perpendicular in this coordinate system and to the two axes is the brightness axis L* at the zero point. In most cases, only the a*b* coordinates are displayed for the sake of clarity. By converting a*b* obtains the C* value, which represents the distance of the color location to the zero point and indicates the chromaticity.
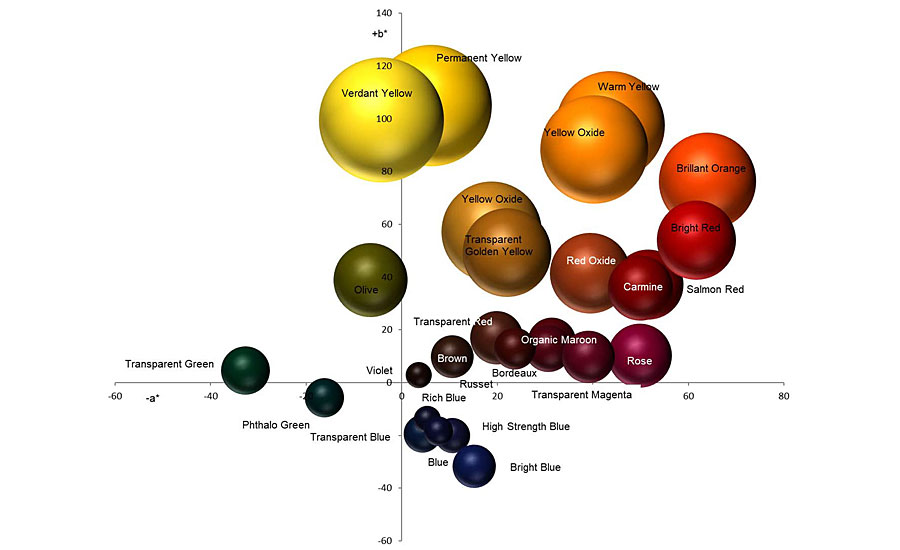
Pigments do not produce ideal colors; in addition to the three components of hue, chroma and brightness, they have additional optical properties, knowledge of which is particularly important when mixing (Figure 1). In industrial and automotive applications, one often finds mixing systems that contain a certain number of mixing tinters. They are used, for example, to mix a car paint for repair according to a given recipe. In the automotive sector, mixing systems contain not only colored pigments but also aluminum and interference pigments. While colored pigments absorb incident light, aluminum pigments reflect it. Aluminum pigments are divided into cornflakes or silver dollars, depending on the manufacturing process. Furthermore, different sizes of aluminum pigments are offered in the mixing systems as tinters (mixed paints), which have different hiding power and brilliance.
Interference pigments, which are also included with several colors in a mixing system, divide the incident light, whereby both reflected parts react with each other (interfere). This results in preferential amplification or attenuation of the light waves. The structure of the interference pigments also determines the resulting color: they are usually synthetic or natural carrier materials coated with a highly refractive material such as titanium dioxide or iron oxide. The metal oxides cause light waves to shift as the light travels through them. Offered — and present in the mixing systems — are colorful white interference pigments, golden or copper-red ones. Particle size also plays a role in interference pigments.
Behavior in Mixtures
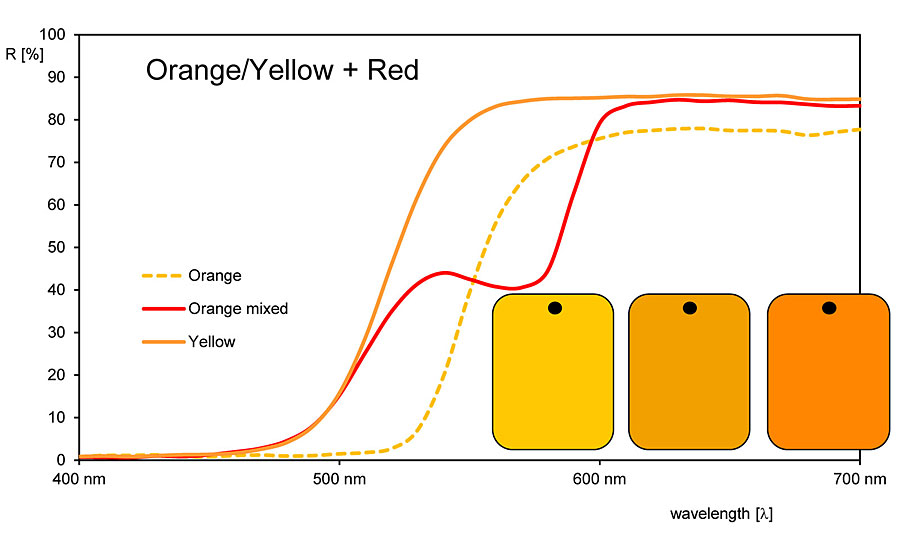
The additional optical properties of a colored pigment, for example, include its behavior when mixed. To understand these better, one must look at its reflectance properties. The color values say less because they are a translation of the reflectance values. Reflectance curves show exactly the level of reflectance provided by the color pigment (Figure 2).
A comparison of the reflection curves and thus the reflections of different colored pigments shows that blue and green pigments have a singular reflection maximum in the corresponding spectral range. And the steeper the maximum rises and the steeper its slopes, the more colorful the pigment appears. On both sides, the reflections are low and flat. By adding a white pigment, the maximum is initially raised, and the colorfulness increases. As soon as the reflection valleys are also raised by adding more white pigment, the chromaticity decreases.
In contrast to the blue and green pigments, yellow, orange and red pigments have a reflection plateau: the reflections rise sharply in the green-yellow spectral range and remain on a high plateau until the long-wave spectral range. With some red pigments, the reflection plateau can also rise, but it does not fall, so that a singular reflection maximum is formed.
So, on the one hand pigments with a reflection maximum, on the other pigments with a reflection plateau. What we do not recognize and see are the high reflections of, for example, a yellow pigment in the green and red spectral range. Both parts are mixed additively to yellow by the brain and make this pigment appear as very colorful and bright.
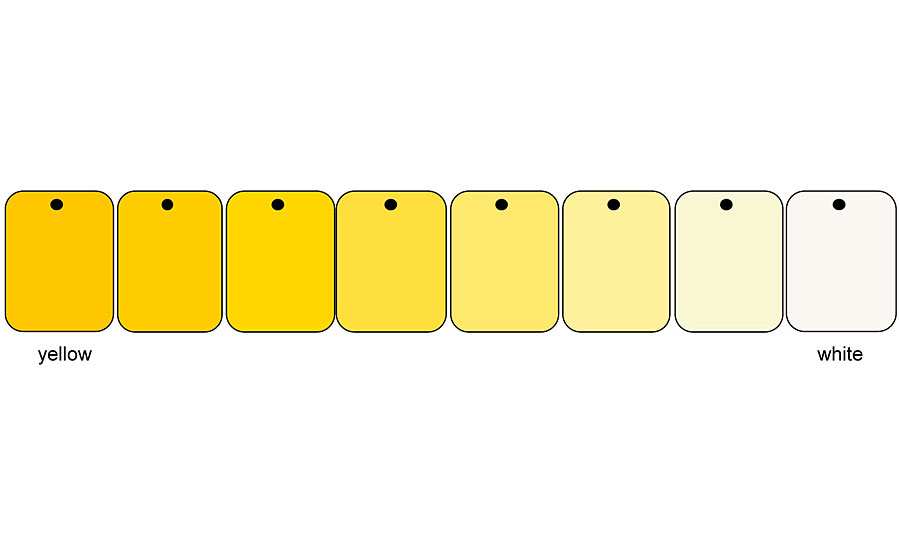
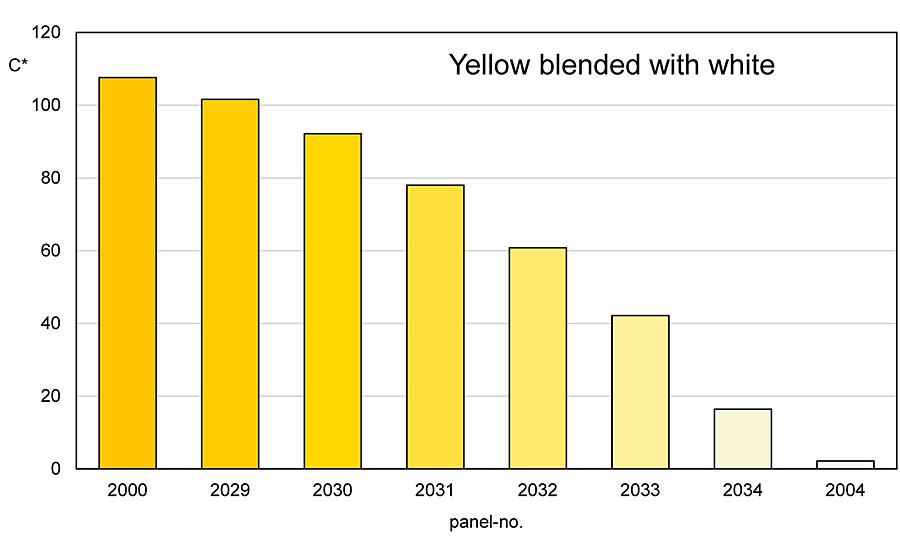
These different reflections also appear when the colored pigments are mixed with an achromatic pigment. It does not matter whether the achromatic pigment is a white pigment, an aluminum pigment or a white interference pigment. The behavior towards a colored pigment is the same for all three types of pigment. If one mixes a yellow pigment with a white one, the result is a mixing series that runs almost directly between the two pigments (Figures 3-4). Depending on the color direction of the yellow pigment, a tendency towards olive green can be seen.
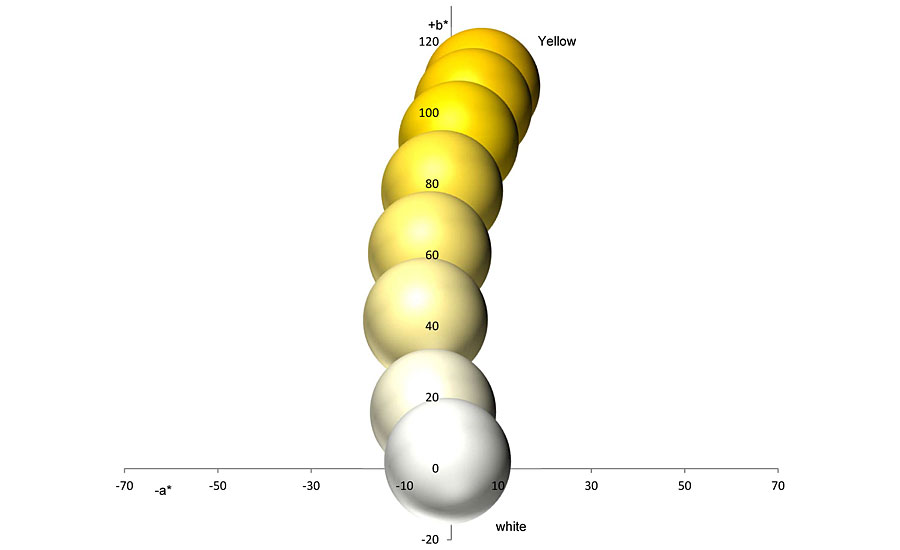
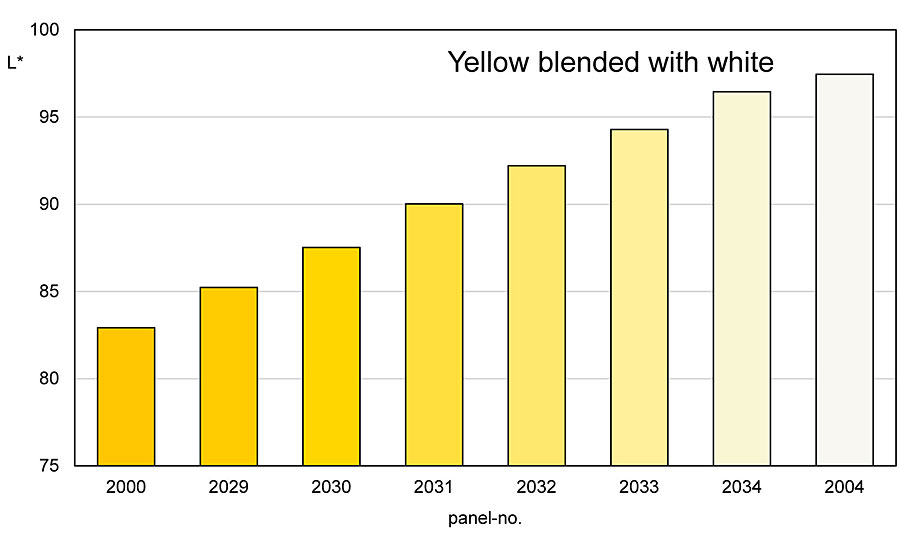
However, this tendency is much clearer with comparable blends with black. Starting with the yellow pigment, the colorfulness of the mixtures decreases towards the white pigment, while the brightness increases at the same time (Figures 5-6). The reflections in the low-reflective spectral range increase more strongly and more clearly than above the reflection plateau.
A red colored pigment behaves similarly when a white pigment is mixed in. However, there is more often a drift of the mixing series into the bluish range. This otherwise runs exactly between the two pigments. The reflection of the red pigment also shows a clear increase in the green-blue spectral range, while above the reflection plateau these increases are less pronounced. Also, in the mixing series from a red pigment to a white pigment, the chromaticity decreases and the brightness increases. Both the yellow and the red pigment have a high chroma and brightness due to the high reflection plateaus and the steep slope towards them.
In mixing systems, several red colors can be found, sometimes also darker ones such as maroon or bordeaux. By mixing a red pigment, the color maroon cannot be achieved. The color character of darker reds becomes apparent when mixing with white. As red tones react very sensitively to mixing and are sometimes not stable in terms of color, several and different red tinters are offered in the mixing systems.
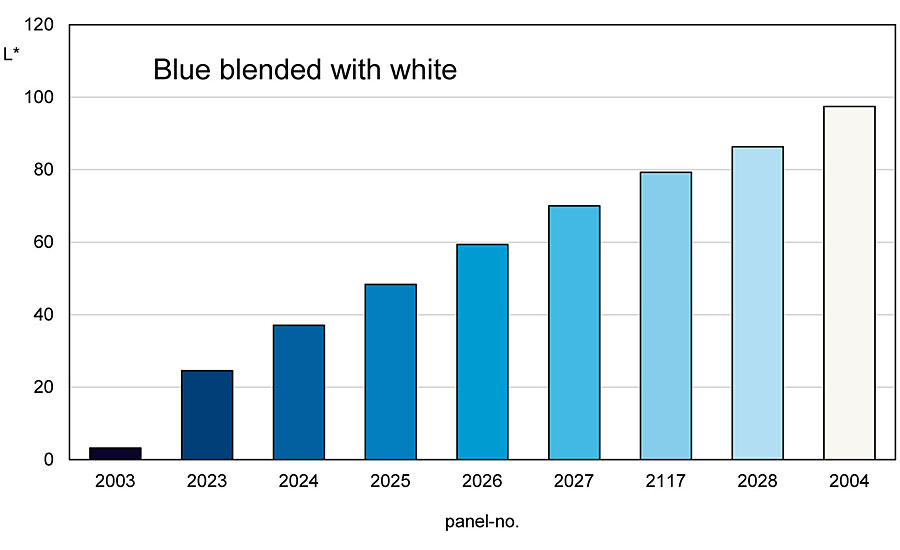
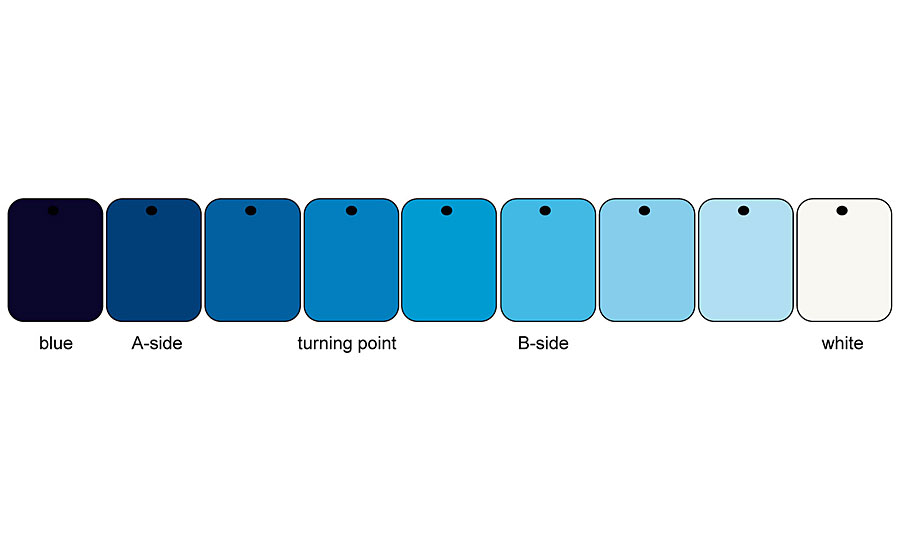
Green and blue colored pigments show a completely different behavior when mixed with an achromatic pigment (Figure 7). Here, the chromaticity and brightness increase up to a turning point when, for example, a blue pigment is mixed with white.
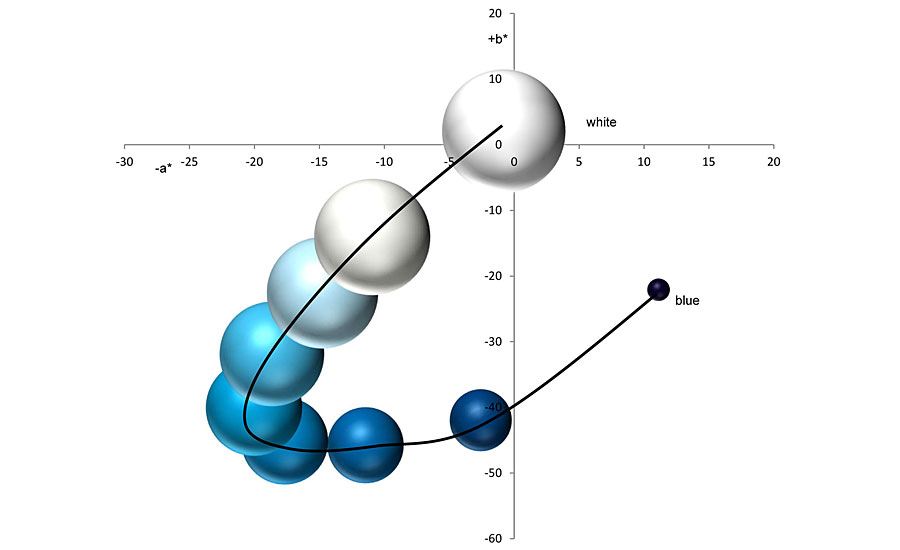
From this turning point, at which the mixing series has the highest chromaticity, the chromaticity drops down to the white pigment, while the brightness continues to increase (Figure 8 -9). This mixing behavior is found in all blue and green pigments and also in blue-violet pigments. Red-violet pigments show a mixing behavior like red colored pigments.
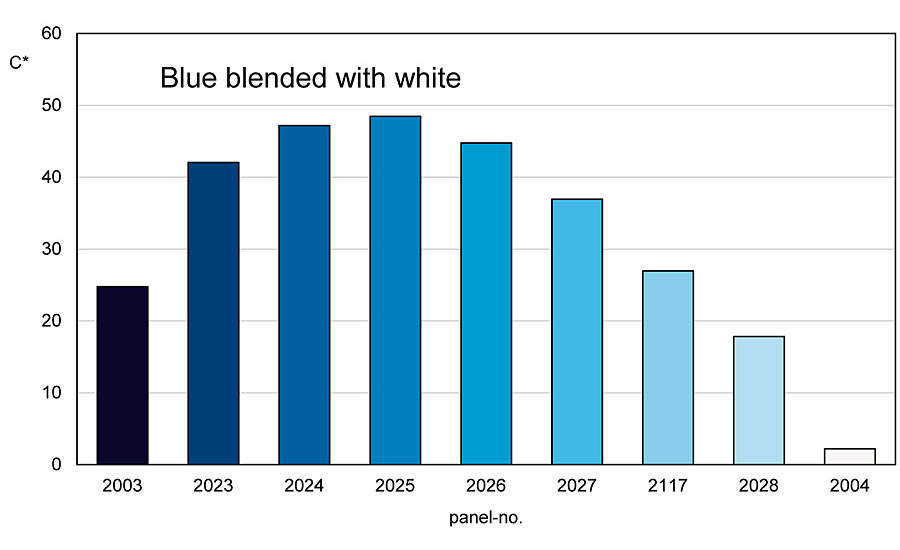
This behavior also results in different reactions during shading. Thus, the mixing area between the blue or green colored pigment up to the turning point can be called the A side and the one from the turning point to the white pigment can be called the B side. If you are on the A side and add blue or green chromatic pigment to a mixture, the chromaticity and brightness decrease. The same process increases the chroma on the B side, while the brightness decreases. And if you add white pigment to the A side of the mixture, the chroma and brightness increase. The same process on the B side makes the chroma decrease while the brightness continues to increase (Figure 10).
This behavior towards achromatic pigments such as white pigments, aluminum pigments and interference pigments is found in all colored pigments: Green and blue colored pigments show a turning point with maximum chroma, while red and yellow colored pigments show a more or less direct progression to white pigment. Green and blue colored pigments have a reflection maximum, while red- and yellow-colored pigments have a reflection plateau. This behavior is independent of the application medium.
For the application of colored pigments, not only are their optical properties such as hue, chroma and brightness interesting, but also their mixing behavior. Mixing series with achromatic pigments serve to capture this color character. Here, color tendencies become apparent that are not recognizable in the pigment itself.
For the exact description of these color tendencies, color measuring instruments are used, which serve an objective description. They record the reflections of these pigments when they are illuminated with white light. The reflection curves recorded in this way clearly show the color reactions when colored pigments are mixed with achromatic pigments. The corresponding color values serve as additional sources of information resulting from the conversion of the reflectance values. They often also facilitate the assessment of optical properties, as reflectance curves are sometimes not easy to interpret. In any case, the reflectance curves and the color values offer a helpful combination to show the color character of pigments.
When mixing different colored pigments, the corresponding reflection curves also provide assistance in assessing and proceeding. As mentioned, there are various optical reactions that our eye and brain do not detect or recognize. These include the also mentioned example of a yellow pigment that also reflects in the green and red spectral range. Mixtures with a blue pigment, which also partially reflects in the green spectral range, result in the common intersection green. Green light rays are reflected by both the yellow and the blue pigment, while the other spectral ranges are absorbed. Another example is orange: the eye cannot tell the difference between an orange pigment and a mixture of red and yellow. The reflection curve of an orange pigment resembles that of a yellow pigment with a steep slope to the reflection plateau. A mixture, on the other hand, shows a saddle shape.
Conclusion
Important for the description of a colored pigment are not only its optical properties, but also its behavior in mixtures. This is the only way to understand the behavior of these pigments.
For more information, visit www.wrcramer.de.
Looking for a reprint of this article?
From high-res PDFs to custom plaques, order your copy today!


