Optimizing Vessel Performance for Decarbonization Goals
The Critical Role of Data-Driven Decisions
In this article:
- Data-Driven Vessel Performance
- LNG Fleet Efficiency
- Hull Coating Assessment
- Speed Loss Analysis
- Biofouling Insights
- Fouling Release Coating Performance
Shipping is responsible for 2.5% of the yearly global GHG emissions (Fourth IMO Greenhouse Gas Study 2020). Stricter international regulation is creating greater pressure to decarbonize and reduce environmental impact. Considering this, the shipping industry is exploring and implementing a variety of technological and operational solutions. Reducing costs and complexity necessitates the adoption of decarbonization strategies that deliver sustained performance for individual ships across a fleet. As there is no “one size fits all” solution, it can be complex for vessel operators to weigh up the relative merits of different investment choices.
International® has developed advisory services and a suite of digital tools to ensure that its hull coating recommendations and services are tailored for each vessel. Vessel operators managing a diverse fleet can then select from a range of International® fouling control coatings and services. Our paper, “Optimising Vessel Performance for Decarbonization Goals: The Role of Tailored Coating Recommendations” (Intercept 8500LPP Performance Case Study | International-marine) explored our approach in detail for one vessel case study.
While this approach ensures a balanced assessment of cost and performance, it can introduce complexity which operators may wish to avoid. In addition to performance and budget considerations, the overall carbon footprint and sustainability of the coatings can significantly influence the selection process. To balance and simplify all these elements, some vessel operators prefer to select one coating solution which broadly matches the performance requirements for most of the fleet, accepting some variance due to operational differences.
This paper focuses on three Liquid Natural Gas (LNG) vessels, part of a larger fleet detailed in Table 1. It examines the nature of the vessel operations, out-docking and in-service hull conditions, performance metrics and the effectiveness of Intersleek® 1100SR, a fouling control coating from the International® product range, in maintaining the energy efficiency of these vessels.

Intersleek 1100SR, from the International® product range, is an ultra-performance fouling release coating (FRC) with a silicone base and biocide-free technology, which is particularly suited to high-activity and relatively fast vessels such as LNGs. The vessel operator selected this product for application, building on a successful track record within the fleet over a 12-year period. This choice aligns with their sustainability goals, aiming to reduce emissions both during dry-docking and in-sea operations.
Reviewing Vessel Operations
Understanding vessel operations is crucial when selecting fouling control hull coatings, as this ensures the coating's suitability for sustained performance. The primary function of a fouling control coating is to limit, prevent and allow the release of marine biofouling from ship hulls. A key step in this process is matching vessel operations and the risk of biofouling with the coating's performance profile. While this is an important consideration prior to application, continuously reviewing operations provides valuable insights. Factors such as time in port and anchorage, changes in speed or activity, and variations in the risk of biofouling settlement and growth provide context for a detailed review of vessel performance trends.
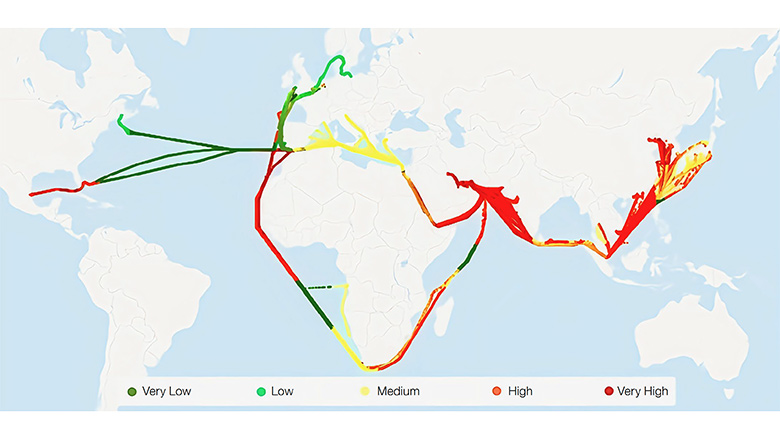
Digital forecasting tool Intertrac® was developed by the team at International® and introduced in 2012. It is used to visualize and understand operations by layering Automatic Identification System (AIS) data with proprietary biofouling models. Operational metrics such as speed, percentage of time at sea or activity %, sea miles per month, time spent in berth and anchorage, trade patterns or routes, and environmental factors like sea water temperature and risk of fouling are reviewed. Changes and variations in these metrics facilitate a comprehensive understanding of coating performance and may connect with deviations in vessel performance.
When there is minimal variance within fleet operations, we typically group vessels of similar type and operations together. For these three subject vessels, it is appropriate to compare the vessel performance trends as a single group.
Hull Condition and Coating Performance
During dry-docking, the impact of surface preparation and application quality can be assessed by taking measurements with a hull roughness gauge to determine the Average Hull Roughness (AHR). This method provides a quantitative evaluation of the application process including contribution of surface preparation and coating scheme (primer, tie coat and fouling control coating) in delivering a smooth hull surface, which is crucial for optimal vessel performance.
International® routinely undertakes these measurements and has conducted well over two thousand AHR assessments, enabling a comparison of individual vessel measurements with its database. As illustrated in Figure 2, we can compare the average value for these vessels with the entire database covering all vessel types, all fouling control coatings and from in-docking and out-docking operations. The average values measured during out-docking and in-docking operations are 70 µm and 85 µm respectively.
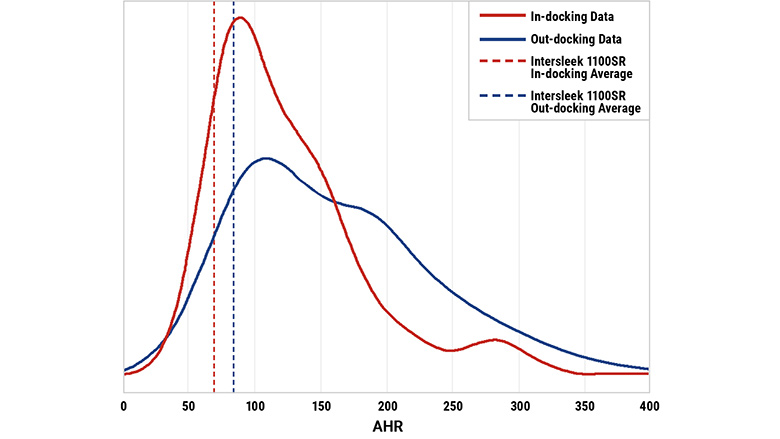
This evidence suggests that, following a high-quality application of the Intersleek 1100SR scheme during dry-docking, the drag penalty of vessels due to underlying hull and coating roughness was lower than the database average. While not relevant to these vessels, good quality applications and low AHR values can also contribute toward vessel EEXI qualification (MT SUVRETTA becomes the first vessel to include hull coating impact in the EEXI technical file approved by DNV – VesselFinder). Comparing out-docking measurements with those measured during in-docking operations, the average rate of degradation was determined to be 3 µm per year. Therefore, it is reasonable to assume that changes in hull roughness for these vessels are unlikely to significantly influence vessel performance deviation.
Achieving a relatively low out-docking AHR value is important and provides reassurance of application quality, but its value to hull resistance can be short-lived if corrosion, damage accumulation and, most importantly, biofouling settlement and growth occur. Hull conditions will change during service, and underwater inspections offer essential data to review alongside vessel performance trends. A high-quality inspection can offer a clear snapshot, clarifying the status of hull condition and coating performance. However, underwater dive inspection material, though powerful, can sometimes be misinterpreted due to the subjective nature of reports, leading to difficulties in objectively reviewing coating performance. Several factors can influence the quality of an inspection report, such as the inspection equipment, water quality and visibility, and the assessor's experience in reviewing and summarizing the findings reliably and credibly. International® has considerable experience in reviewing and characterizing marine biofouling, which helps standardize the process and minimize subjectivity when reviewing hull inspections.
Hull inspection material is available for all three vessels, allowing a review of hull condition and coating performance to be undertaken. In general, all vessels exhibited a very low level of coating damage on the lower vertical sections associated with tugboat and fender activity. Given the consistency in observed good hull condition and relatively low in-docking AHR measurement, we can assume that this is not a significant variable for consideration in terms of each vessel’s performance.
As illustrated in Figure 3, to simplify the content in this report and provide insight into the range and extent of marine biofouling observed on the vessels, we have aligned all inspection insights from 30 months onward with our biofouling reference illustrations.
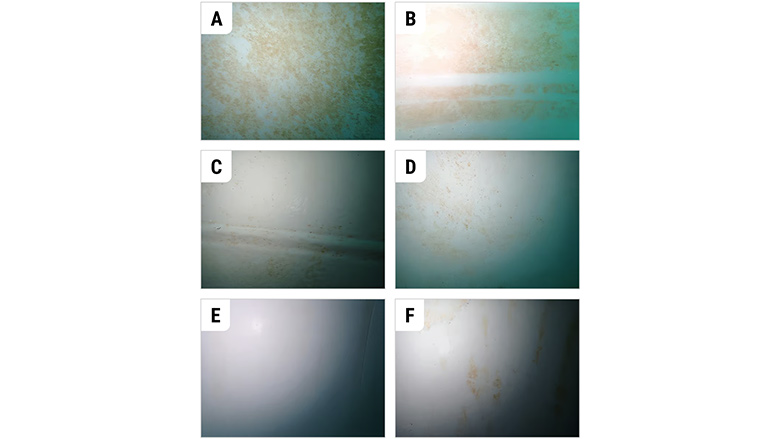
As highlighted earlier, hull inspections are an essential companion dataset for reviewing and aligning with vessel performance trends and speed loss calculations. The vessel inspections provide clarity regarding the performance of each Intersleek 1100SR coating application. Overall, the coating performance is considered good, with the hulls being effectively managed, as evidenced by the very low levels of microfouling or slime fouling growth and settlement observed. Given the similar level and extent of fouling across the three vessels, it is reasonable to assume that any differences in hull resistance and powering requirements due to biofouling are minimal. Moreover, while coating performance does affect vessel performance, particularly in cases of extensive and significant biofouling coverage, the observed similarity in coating performance among these three vessels suggests that all vessel hulls exhibit similar resistance characteristics, leading to comparable impacts on overall ship performance. The true significance and value of this material emerge as vessel performance data trends become evident.
Propeller condition is another critical component in determining the overall performance of a vessel. Its design, efficiency and operational management directly influence key performance metrics. However, when the propeller is not properly managed, its efficiency can be compromised due to factors such as cavitation, abrasion or biofouling accumulation. Such inefficiencies can lead to increased drag, reduced thrust and higher overall fuel consumption. Through regular maintenance and continuous performance monitoring, the negative impact on performance can be minimized, ensuring that it operates at peak efficiency. Across the three vessels, routine propeller inspections were conducted and, where necessary, cleaning was undertaken. Throughout the in-service period, the propellers were maintained in optimal condition, minimizing any adverse impact on vessel performance.
Vessel Performance Data Quality, Treatment and Insights
In many fleets, it is not uncommon to observe a range of data quality issues that complicate the review of vessel performance, whether the goal is to compare the status of the fleet, review “sister” vessels or provide insights into the influence of energy-saving technologies such as fouling control coatings. International® has many years of experience cooperating with customers to review datasets of varying data quality. Multiple sensor data is reviewed, such as vessel speed (over ground and through water), delivered power, fuel consumption, shaft speed, shaft torque, draft, wind speed and direction. All these parameters are evaluated following the principles of ISO 19030 Part 3, “Measurement of Changes in Hull and Propeller Performance.”
To simplify the content of this paper, speed deviation and speed loss will be illustrated as the main vessel performance indicators. After treating the data in accordance with the principles of ISO 19030, deviations in speed over time can be reviewed as a moving average trend and the average percentage speed loss can be determined. The first 12 months of data are designated as the reference period, serving as the baseline to which the evaluation data period over the remainder of the in-service period is compared. The speed loss is calculated by subtracting the average speed deviation in the evaluation period from the reference period average. The speed loss provides a useful metric to compare the overall average performance for each vessel.
Datasets of consistently high quality that facilitate the generation of reliable and accurate speed loss can be used to support short- and long-term decision-making and to interpret the underlying influence of hull coating applications. Lower quality datasets, such as noon reports, can also be reviewed and judged on a case-by-case basis. In our experience, noon reports can be successfully applied to review longer-term trends rather than supporting a review and diagnosis of short-term fluctuations. The value and limitations of using noon report data to review vessel performance have been well reported in literature and will not be detailed here.
Variations in data quality within a fleet, which may undermine confidence in the performance status of each vessel, can also directly impact the reliability of fleet performance reviews when the intention is to identify vessels performing well and those requiring attention. The noon data quality gathered from the three subject vessels reviewed in this paper falls within the lower quality bracket; therefore, the focus in this review is on the longer-term trends and speed loss determined for the evaluation period. While this is generally the case, all the vessels met our primary quality requirement and complied with ISO 19030. As illustrated in Figure 4, the coefficient of determination (R²) for the fitness of the measured data to a power model was greater than 0.8 over the first 12 months of operation (reference period) for all vessels. The reliability of each vessel’s speed-power reference model provides a solid foundation from which to review the deviations in speed and overall percentage speed loss during the evaluation period, spanning until the vessels dock after 60 months in service.

Furthermore, the vessel data collected throughout the evaluation period remained consistent and of suitable quality to facilitate a fair comparison across the vessels. As illustrated in Figure 5, an overlay of the speed deviation trend for each vessel provides insight into the range of performance derived as a result of the ISO 19030 data treatment.
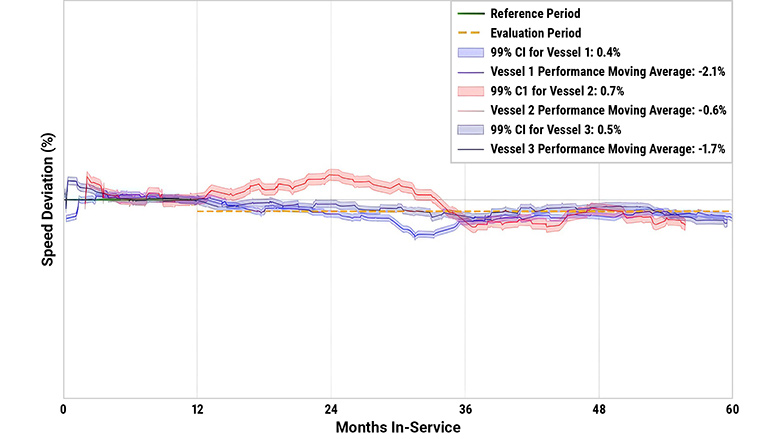
As expected, the general trend in performance for all vessels highlights a gradual loss in speed across the 60-month in-service period. The 90-day moving average speed deviation trend for vessels 1 and 3 is in close alignment over the 60-month period, whereas the trend for vessel 2 is mostly consistent except for the 12- to 36-month period, during which an improvement in performance is observed. It is not uncommon to observe periods of upturn and downturn in speed deviation for vessels, and sometimes it is possible to link these patterns with operational changes or maintenance events. However, in the case of vessel 2, there was no clear and obvious reason for the period of performance improvement, and a deeper exploration of the potential root cause goes beyond the scope of this paper.
The percentage speed loss for all three vessels has been determined:
- Vessel 1: 2.1% ± 0.4%
- Vessel 2: 0.6% ± 0.7%
- Vessel 3: 1.7% ± 0.5%
A low percentage speed loss is the most desirable outcome, as this directly links to powering demand, fuel oil consumption, CO₂ emissions and CII rating. Vessel 1 is calculated to be the least efficient in this group, exhibiting the most significant speed loss, equating to an estimated increase in powering and fuel oil consumption of around 6.6% (applying a simple 3:1 power-to-speed ratio). In contrast, vessels 2 and 3 are calculated to be relatively more efficient compared to vessel 1, with vessel 2 experiencing the least deviation, amounting to an increase in powering and fuel consumption of 1.8%. Within fleets, it is not uncommon to observe a range of performance, even among vessels of similar design, operation and identical hull coating specifications.
Vessel performance indicators, such as speed variance and speed loss, relate to the “sum of the parts,” and all aspects of the vessel, including its operation, will influence these measures. Most vessel operators actively manage their vessels and implement a Ship Energy Efficiency Management Plan (SEEMP), within which vessel performance acceptance limits are set to define a window of speed variance within which the vessel needs to be maintained. At any point in time, when the speed deviation is low relative to the reference period, it is reasonable to assume that all elements influencing the vessel’s performance are functioning effectively. When a vessel’s speed deviation matches or exceeds the acceptance limit, action is taken to review the potential root cause.
Diagnosing the contribution of individual energy-saving devices or installations that influence vessel performance is a complex procedure; however, vessel operators will often attribute changes in hull and propeller condition as the likely cause of significant speed deviation. As highlighted earlier, regular propeller maintenance was a feature of these vessel operations, and vessel inspections confirm similar coating performance was observed for all vessels. In view of this, it is unlikely that the calculated speed loss for each vessel is entirely dictated by hull condition and coating performance alone.
The observation of vessel performance variance within a fleet, even when factors such as propeller condition, hull and coating performance and other key contributors have been eliminated as significant factors, is not unique to these vessels. International® has experienced similar cases in different fleets, highlighting that vessel performance metrics derived by approaches such as ISO 19030 do not always deliver the level of reliability and consistency required to support standalone decision-making.
Each vessel operator understands the nature of their own vessel data, the discipline employed to derive vessel performance metrics and the reliability of its use to support decision-making. We recognize a wide range of capability and experience within vessel operator fleets, and some approaches may deliver more reliable decision-making data than others. While acknowledging this is important, the need for high-quality companion datasets, such as underwater hull and propeller inspections, is essential to align with vessel performance metrics to help diagnose and support timely decision-making and will remain a requirement for the foreseeable future.
The consistently low performance deviation observed across all vessels indicates they have been managed and operated to a high standard.
Vessel performance relates to the “sum of the parts” regarding management, operation and dry-docking investment decisions. International® worked in close cooperation with the fleet managers to understand the performance status of the vessels, carefully interpreting inspection material alongside vessel speed deviation trends. As discussed earlier, interpreting inspection material is challenging, but with the expertise from International®, we provided guidance to ensure the data and information were used to best effect. In a series of joint performance reviews, both parties reviewed all the data, concluding that the vessels performed in compliance with agreed acceptance limits and delivered the energy efficiency and emissions expectations of the vessel operator. The application of Intersleek 1100SR on these vessels played a key contributory role in maintaining the hull in a smooth and relatively clean condition.
Conclusion
In conclusion, our study highlights the practical challenges associated with interpreting data of varying quality and source to draw insights and support decision making. Implementing a robust methodology and leveraging extensive expertise, it demonstrates how data can effectively guide vessel operators in making decisions that optimize efficiency, enhance sustainability and ensure compliance with evolving regulatory requirements. The performance of the three vessels coated with Intersleek 1100SR highlights the critical role of coatings and underscores the necessity for strategic investment in fouling control. As the shipping industry continues to face increasing regulatory pressures to reduce carbon emissions and improve efficiency, it is essential for vessel operators to adopt a more data-driven, tailored approach to coating selection and fleet management. This approach not only enhances operational performance but also contributes to long-term sustainability and regulatory compliance.
Looking for a reprint of this article?
From high-res PDFs to custom plaques, order your copy today!


