Designer Polymers
Predictive Equation for a Simple Mixture
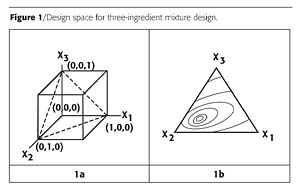
In the previous installment of this series where we learned to bake the perfect cake1, the mathematical definition of mixture designs and their uses were described. The full, predictive, quadratic equation for three variables is shown in Equation 1.Property = a0 + a1X1 + a2X2 + a3X3 + a12X1X2 + a13X1X3 + a23X2X3 + a11X12 + a22X22 + a33X32 (1)
However, if a mixture has ‘n' ingredients that add up to 100%, only n-1 ingredient levels need be specified, because the level of nth ingredient would automatically be set. This is a loss of freedom or, in statistical terms, a loss of one degree of freedom. This can be stated mathematically as noted in Equations 2a and 2b.
-
X1 + X2 + X3 = 1 or 100% (2a)
or
X3 = 1 - X1 - X2 (2b)
-
a0 = a0 * 1 = a0 * (X1 + X2 + X3) (3)
X12 = X1 * X1 = X1 * (1 - X2 - X3) = X1 -X1X2 - X1X3 (4a)
X22 = X2 * X2 = X2 * (1 - X1 - X3) = X2 -X1X2 - X2X3 (4b)
X32 = X3 * X3 = X3 * (1 - X1 - X2) = X1 -X1X3 - X2X3 (4c)
Property =b1X1 + b2X2 + b3X3 + b12X1X2 + b13X1X3 + b23X2X3 (5)
The ‘b' coefficients have a different meaning than the ‘a' coefficients. The first-order coefficients are given in Equations 6a through 6c, and the second-order coefficients are given in Equations 7a through 7c.
-
b1 = a0 - a1 - a11 (6a)
b2 = a0 - a2 - a22 (6b)
b3 = a0 - a3 - a33 (6c)
b12 = a12 - a11 - a22 - a33 (7a)
b13 = a13 - a11 - a22 - a33 (7b)
b23 = a23 - a11 - a22 - a33 (7c)
A Mixture Design With an Additional Constraint
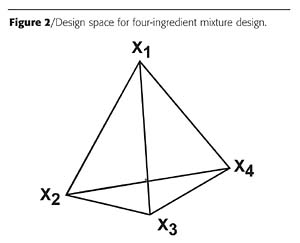
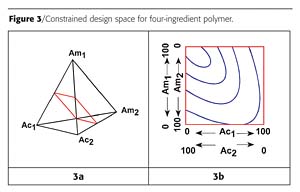
There may be a time when the total amount of some of the mixture ingredients has to be a constant, but the individual ingredients within the group are varied over some range. For example, a paint formulation is being studied in a mixture design and the formulation requires exactly 5% of a light stabilizer. Two light stabilizers are going to be studied. The combination of the two will be 5% of the formulation, but each can be varied between 0 and 5%. The remaining paint ingredients are varied, but will comprise 95% of the paint formulation and will also be varied over some desired and specified ranges.An example where this issue first came to my attention was when I tried to use mixture design to study polymers. I was preparing polyamide resins with two acids and two amines. In mixture design terms, the equivalent percentages of the two acids and the two amines would total 100%. Of course it makes no sense to have 100% of just one ingredient - for example, one amine, or a mixture of two ingredients of the same functionality, such as two acids. To make a high-molecular-weight nylon, the equivalents of acid must equal the equivalents of amine. A nylon could be made from one acid and one amine; one acid and two amines; two acids and one amine; or two acids and two amines. For the latter case, the experimental polymer design space of Figure 2 is constrained to a plane as shown in Figure 3, where Ac designates the acids and Am, the amines.
The design space is drawn by identifying the 50:50 design points for each acid-amine combination. These points are then connected, as shown in Figure 3a. The four-ingredient design space can be plotted in two dimensions. Figure 3b shows this with example response contours.
When I first came across this example, some 20 years ago, I termed this type of study a "polymer design". This terminology caught on and is still used today. The term "polymer design" is used for both polymers and for the first example where additives are a constant (even though the latter is not really a polymer).
The full, predictive, quadratic equation for four polymer variables is shown in equation 8.
Property = c0 + c1A1 + c2A2 + c3B3 + c4B4 +
c11A12+ c22A22+ c33B32+ c44B42+
c12A1A2 + c13A1B3 + c14A1B4 +
c23A2B3 + c24A2B4 + c34B3B4 (8)
The mixture adds up to 100% with an attendant loss of freedom or, in statistical terms, a loss of one degree of freedom. This can be stated mathematically in Equation 9.
A1 + A2 + B3 + B4 = 1.0 eq (9)
This constraint has mathematical implications, because the following algebraic identities hold.
C0 = C0 * 1 = C0 * (A1 + A2+ B3+ B4) (10)
A12 = A1 * A1 = A1* (1 - A2 - B3 - B4) (11a) = A1 - A1 A2 - A1 B3 - A1 B4 (11b)
A22 = A2 * A2 = A2 * (1 - A1 - B3 - B4) (12a) = A2 - A1 A2 - A2 B3 - A2 B4 (12b)
B32 = B3 * B3 = B3 * (1 - A1 - A2 - B4) (13a) = B3 - A1 B3 - A2 B3 - B3 B4 (13b)
B42 = B4 * B4 = B4 * (1 - A1 - A2 - B3) (14a) = B4 - A1 B4 - A2 B4 - B3 B4 (14b)
For a polymer, the equivalents of the acids equal the equivalents of amine. (A1 + A2 = B3 + B4) This is shown mathematically in equations 15a,b and 16a,b.
A1 + A2 = X eq (15a)
A2 = X - A1 (15b)
B3 + B4 = 1 - X eq = Y eq (16a)
B4 = Y - B3 (16b)
When equations 10, 11b, 12b, 13b, 14b, 15b and 16b are substituted into equation 8, equation 17 results.
Property = D0 + D1A1 + D3B3 + D11A12+ D33B32+ D13A1B3 (17)
The ‘d' coefficients have a different meaning than the ‘c' coefficients. The intercept is given in Equation 18, the first-order coefficients are given in Equations 19a and 19b, and the second-order coefficients are given in Equations 20a through 20c.
d0 = (c0 - c2 - c2 )*X + (c0 - c4 - c44)*Y - (c22 - c24 + c44)*X*Y (18)
d1 = (c1 - c2 + c11 - c22) + (c12 - c11 - c22 )*X + (c14 - c24 - c11 + c22)*Y (19a)
d3 = (c3 - c4 + c33 - c44) + (c23 - c24 - c33 + c44) *X + (c34 - c33 - c44 )*Y (19b)
d11 = c11 - c12 + c22 (20a)
d33 = c33 - c34 + c44 (20b)
d23 = c13 - c14 - c23 (20c)
For example, in a formulation to study two light stabilizers mixed with two resins, where the light stabilizer was to be exactly 5% by weight of the formulation, X = 0.05 and Y = 0.95. For the other example where a polyamide was to be made, the equivalents of the two amines had to equal the equivalents of the two acids; or X = 0.5 and Y = 0.5.
In a previous life I had the responsibility for the design of new polyamide hot melt adhesives. The two important properties were melt viscosity at 100 °C, and the ball and ring melting point. Reporting to me was a chemist who worked on requests from the sales force. Day in and day out for 35 years he prepared resins based on the same two acids and two amines. He had a shoe box full of recipe cards of previously prepared resins. When he got a request he would go into the shoe box and find a recipe close to what he thought he needed and he would start cooking resins. Sometimes he would get the correct properties after three or four tries; often it took eight to 10 tries. Sometimes he was unsuccessful even after 12 to 15 tries. More often than not he was successful.
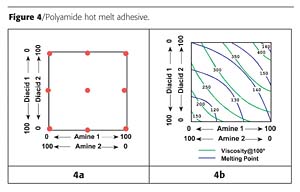
We prepared the nine resins in the diagram of Figure 4a. This kind of looks like a central composite design, which would have the outside design points on a circle that would touch the corners of the square design space. If this were a typical factorial design space, the star points would be outside the square design space.2 We couldn't have more than 100% of an ingredient, so the star points were moved to the edges of the square design space. (Instead of going from 0 to 50% as prescribed by the design, we described the acids and amines, each, as varying from 0 to 100. This would change the size of the regression coefficients, but otherwise not affect the analyses.) We determined the viscosity and melting point for each of the nine resins, conducted regression analyses and plotted the results in Figure 4b.3
When a request came in, we looked at the graph to see where we should start. For example, if a viscosity of 250 and a melting point of 130 were desired, a look at the contour plot showed two formulations were possible. One was chosen, maybe on the basis of cost, and was prepared. Most often we didn't hit the specifications exactly, because of experimental error in the design, but we seldom prepared more than two resins. If we didn't hit the specifications exactly, the response surface indicated to us how we could adjust the formulation.
Moreover, if a request came in for a viscosity-melting point combination that was not possible (for example, 250 viscosity and 150 melting point), we didn't even try to prepare the resin, because we knew we would fail. So we saved a lot of time and money.
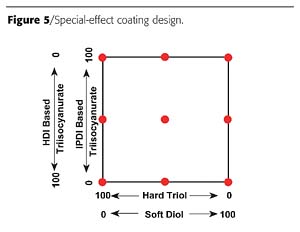
A second example is the preparation of a special-effect polyurethane coating based on two polyisocyanates and two polyols. In this case, the special effect was the apparent soft feel of the paint. Feel is a subjective quality and does not correlate to hardness or tensile properties. The design is given in Figure 5.
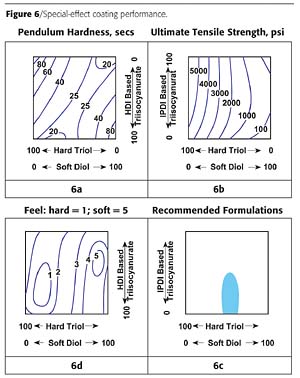
From the results, feel correlates somewhat with tensile strength, but not with hardness at all. Based on the three tests, recommended formulations were defined as indicated in Figure 6d.
What's Next?
In this and the prior article, the use of mixture statistics to study formulations was discussed. Previous articles discussed how factorial designs could be used to study process variables. What happens when a researcher wants to study both formulation variables and process variables? Sounds like another article to me.References
1 Paint and Coatings Industry "deSigns of the Times: How to Bake the Perfect Cake," July, 2004.2 Paint and Coatings Industry "deSigns of the Times: Just the Factorials, Ma'am!" October, 2002.
3 Paint and Coatings Industry "deSigns of the Times: Selecting Experiments!" January, 2002.
Looking for a reprint of this article?
From high-res PDFs to custom plaques, order your copy today!


