Raman Microscopy for the Examination of Polymer Laminates


Raman Spectroscopy
Raman spectroscopy provides the ability to study the interactions of the vibrational energies of atoms or groups of atoms within molecules. In fact, Raman spectra result from vibrational motions, which are a result of the change in a source-induced molecular dipole moment. Raman spectroscopy is a powerful qualitative and quantitative tool with some particular advantages for the analysis of polymers. Initially, interpretation of Raman spectra is somewhat confusing to those more familiar with infrared spectroscopy, as the two techniques may be (and often are) mutually exclusive. Frequently, infrared spectra demonstrate weak absorptions for molecular vibrations that result in intense Raman peaks and vice-versa. Raman spectra offer greater information about the skeletal movements of the molecule. Boerio1 gives examples of the group frequencies for which Raman offers advantages over infrared spectroscopy while Dollish, et al.2 compiled extensive data on Raman group frequencies. Raman spectroscopy can be used to analyze most organic compounds and a wide variety of organometallic and inorganic complexes.Raman microscopes are manufactured for both dispersive and FT-Raman systems. A natural extension of the Raman technique, the laser beam is focused to provide sample illumination on the micron scale and Raman scattering is collected with the instrument hardware to produce spectra of samples with a spatial resolution approaching 1-10 mm. Mapping of a sample surface is accomplished by examination of discrete sample sites and collection of multiple Raman spectra. Mapping of sample surfaces can provide structural data on a microscopic scale. The variety of Raman microscope designs and microscopic methods provide the ability to routinely utilize imaging and microscopy for the investigation of polymer surface structure, or the defect and contaminant analysis of coatings, polymer films and laminates.
The continued improvements in lasers, monochromators and detectors are reducing the complexity and cost of Raman instruments while broadening the application of Raman spectroscopy for analytical applications. Oxygen barrier coatings for food and pharmaceutical packaging were analyzed using Raman microspectroscopy.3 The Raman microscope has also been used to study the selective surface modifications on PVC films4 and tungsten/poly(ethylene glycol) films.5 Microspectroscopy has also been used to identify impurities in laminates such as the identification of oil contaminants in the polymer coating of beverage cans.6 Numerous examples of the use of Raman spectroscopy to examine the structure of polymers are present in the literature, and most of these include the vibrational assignment of the peaks in the Raman spectrum.7,8
Raman spectroscopy has also been used to study the interaction of other molecules with polymer systems or specific functional group activity. Raman spectra for the characterization of polarons, bipolarons and solitons in conducting polymers is reported9, while the linear oligomers of poly(oxymethylene) with acetyloxy end groups were investigated with infrared and Raman spectroscopy.10 (Polarons, bipolarons and solitons are the charge carriers in conducting polymers.) The Raman spectra and associated structural studies of several liquid crystal polymers has been reported11,12, while hydrogen bonding in a series of polyamides has been investigated using Raman spectroscopy13 in addition to an intensive examination of hydrogen bonding and the resultant secondary structure for a series of commercial nylons.14,15
Raman microspectroscopy has also been used to characterize polymers, and these efforts have been extensively reviewed.16,17 Application of Raman microspectroscopy to the characterization of heterogeneous polymer blends has been reported,18 in addition to a study to differentiate the amorphous-oriented and crystalline components of PET fibers.19 Raman spectra were used to characterize a series of g-substituted propyl-trialkyloxysilanes (sol-gel precursors) while including the microspectroscopic analysis of a copolymer produced from two of the precursors.20 In an attempt to clarify the vibrational assignment of the Raman spectra, the authors used polarization data to determine the vibrational motions that either retained or destroyed the existing plane(s) of symmetry of the molecule. Raman spectroscopy has been used to evaluate surface passivation of ultrathin polymer films, and to determine how strongly these films adhere to the surface.21
Experimental
Juice Bottle
A juice bottle laminate, a commercial dessicant pack and a baby food container were examined using Raman spectroscopy. Laminate samples were sectioned with a razor blade, and the cross-sections examined; sample thickness was not controlled. Samples were imaged under the microscope using the 20x objective. The sample area was defined by the laser spot size, with 2 microns in diameter being the nominal sample area defined by the laser. A Jasco Ventuno benchtop-mounted, fully integrated confocal micro-Raman spectrometer equipped with a 532nm 60 mW solid-state (diode) laser excitation, and an air cooled Andor CCD detector at -75 C with a spectral range of 3600-200 cm-1 was used to collect the spectra. This provided a spectral resolution of 4 cm-1 with the 1800 lines/mm grating. The integration time was 20 seconds per acquisition with 2 acquisitions per sample.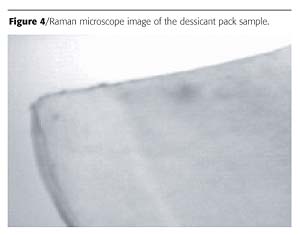
Results and Discussion
Juice Bottle
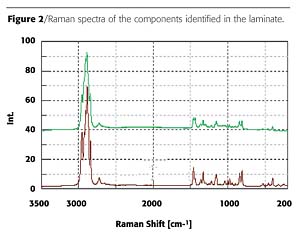
Figure 1 is the image of a laminate sample taken from the juice bottle. Although several distinct layers are visible in the microscope image, the analysis of the layers reveals that only two different polymers are used to construct the laminate. Figure 2 contains the Raman spectra obtained from the two polymers. The two polymers are readily identified as poly(propylene) (PP) and a modified poly(vinyl alcohol) (PVOH).
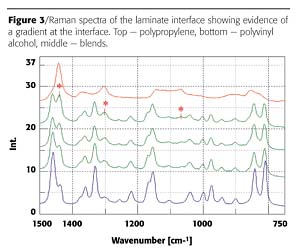
Careful examination of the laminate layers immediately adjacent to the PVOH reveals a gradient in the ratio of the poly(propylene) and poly(vinyl alcohol) (Figure 3). The differences in the Raman spectra are observed in the C-H stretching region and some additional bands in the fingerprint region associated with the additional skeletal bands of the poly(vinyl alcohol). The juice bottle laminate is comprised of six layers. PP (polypropylene) and a highly hydrolyzed form of the PVOH (polyvinyl alcohol) were identified as the primary components based on the comparison of Raman spectra to spectral libraries. There appear to be two slightly different PP types, probably molecular weight variants or one of the poly(propylene) layers may contain a small amount of an additive to provide the change in optical density. This particular laminate clearly demonstrates a mixing of the polymers at the interface of the two polymers in contrast to conventional laminates, which have a distinct boundary between the polymer interface.
Dessicant/Blister Packs
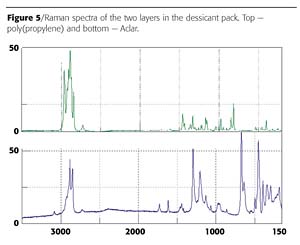
Blister packs can act as a barrier to three things: moisture, light and oxygen. Of these, moisture currently seems to be the highest priority because many new drugs, especially ones developed through biotechnology, are highly sensitive to water. This, in turn, has produced a demand for blister materials with higher moisture barriers. A commercial dessicant pack used to remove moisture from packaging was evaluated using the Raman spectrometer. Figure 4 is the microscope image of the sample. Two distinct layers are clearly visible in the image. The first layer was identified as Aclar™ - a fluorinated poly(propylene) commonly used as a moisture barrier (Figure 5). Aclar is a clear moisture barrier with exceptional electrical and electronic characteristics that first had application protecting the electronics of sonar buoys for the U.S. Navy. It is commonly used by pharmaceutical companies for blister packaging and other healthcare packaging. Aclar fluoropolymers come in several grades of film and laminations, enabling users to specify the moisture protection properties best suited to their applications. The second layer was identified as poly(propylene). Polypropylene is a versatile polymer that serves double duty, both as a plastic and as a fiber. As a plastic it is used to make things like dishwasher-safe food containers, since it doesn't melt below 160 oC. As a fiber, polypropylene is used to make indoor-outdoor carpeting. It works well for outdoor carpet because it doesn't absorb water, like nylon.Conclusions
The development of laser sources; CCD and diode array detectors; and tunable filter systems have expanded the variety of Raman instrument systems. As a result, Raman spectroscopy has found a new home in many laboratories. Applications in all fields of chemical analysis have been reported, and many more remain to be discovered. The use of Raman spectroscopy to examine polymer systems can provide a wealth of information, including the characterization of the vibrational activity and the determination of molecular structure; an ability to identify and discriminate polymer compounds; repeatable, simple methods for quantitative analysis; the study of polymerization reactions; and the crystallinity of polymers.For more information, contact the authors at Jasco Inc., 8649 Commerce Drive, Easton, MD 21601.
References
1 Boerio, F. J.; Koenig, et al. In Polymer Characterization: Interdisciplinary Approaches Craver, C. D., Editor, Plenum, New York, 1971, Chapters 1-3.2 Dollish, F. R.; Fateley, W. G.; Bentley, F. F. Characteristic Raman Frequencies of Organic Compounds; Wiley; New York; 1975.
3 Jahromi, S.; Moosheimer, U. Macromolecules, 2000, 33, 7582-7587.
4 Sacristan, J.; Mijangos, C.; Reinecke, H.; Spells, S.; Yarwood, J. Macromolecules, 2000, 33(16), 6134-6139.
5 Santato, C.; Odziemkowski, M.; Ulmann, M.; Ausustynski, J. J. Am. Chem. Soc. 2001, 123(43), 10639-10649.
6 Malecha, M.; Bessant, C.; Perry, D.; Saini, S. Analyst, 2002, 127(2), 297-303.
7 Stuart, B. Spectrochim. Acta A, 1997, 53A, 111-118.
8 Xue, G. Prog. Polym. Sci., 1997, 22, 313-406.
9 Furukawa, Y.; Sakamoto, A.; Ohta, H.; Tasumi, M. Synth. Met. 1992, 49, 335.
10 Kobayashi, M.; Matsumoto, Y.; Ishida, A.; Ute, K.; Hatada, K. Spectrochim. Acta, Part A 1994, 50A, 1605.
11 Ellis, G.; Lorente, J.; Marco, C.; Gomez, M. A.; Fatou, J. G.; Hendra, P. J. Spectrochim. Acta, Part A 1991, 47A, 1353.
12 Fontana, M. P.; Antonioli, G.; Jiang, Z.; Angeloni, A. S. Mol. Cryst. Liq. Cryst. 1991, 207, 151.
13 Triggs, N.; Valentini, J. Isr. J. Chem. 1994, 34, 89.
14 Brunsgaard, J.; Christensen, D.; Faurskov Nielsen, O. Spectrochim Acta, Part A 1993, 49A, 769.
15 Brunsgaard, J.; Christensen, D.; Faurskov Nielsen, O. J. Chim. Phys. Phys.-Chim. Biol. 1993, 90, 1797.
16 Schaeberle, M.; Karakatsanis, C.; Lau, C.; Treado, P. Anal. Chem. 1995, 67, 4316.
17 Meier,R.; Kip, B. Microbeam. Anal. 1994, 3, 61.
18 Markwort, L.; Kip, B. J. Appl. Polym. Sci. 1996, 61, 231.
19 Adar, F.; Armellino, D.; Noether, H. Proc. SPIE-Int. Soc. Opt. Eng. 1990, 1336, 182.
20 Posset, U.; Lankers, M.; Kiefer, W.; Steins, H. Appl. Spectrosc. 1993, 47, 1600.
21 Yang, G.;, Zhang, Y.; Kang, E.; Neoh, K. J. Phys. Chem. B. 2003, 107(33), 8592-8598.
Looking for a reprint of this article?
From high-res PDFs to custom plaques, order your copy today!


