Controlling Appearance
New instruments are helping the automotive industry achieve a high level of uniformity in the appearance of exterior finishes.
The exterior paint finish of a car plays a major role in how customers perceive its quality. The ideal "look" would be mirror-like - high gloss and perfectly smooth. But as we all know, limitations are imposed by the paint properties, process capabilities, and most importantly, the amount of money that can be spent to improve the finish. As a result, each automotive company defines its own appearance standard based on meeting or exceeding its competitors' standards and customers' expectations.
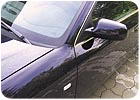
Especially important is achieving a high level of uniformity or "harmony" among all components. Harmony between the horizontal and vertical panels is critical; equally significant is how add-on parts such as bumpers, spoilers, mirror housings or other decorative trim parts match the adjacent body panels. Differences are especially obvious on models with panels that fit together tightly.
The U.S. automotive industry established a physical standard for orange peel in the '70s consisting of 10 high-gloss panels with varying degrees of orange peel structure.2 The panels are visually ranked from 1 to 10, with Panel Number 1 depicting very pronounced orange peel and Panel Number 10 illustrating no orange peel. The visual observer can use these panels as a supportive tool to evaluate the degree of orange peel in an automotive finish.
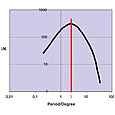
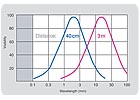
To understand this visual ranking, it is important to realize that our visual impression is influenced by the structure size and observing distance (see Figures 1-3, p. 20). The structured surface of a coating appears to our eye as a wavy pattern of light and dark areas. The real height differences cannot be resolved with our eye. The maximum detectable height difference is approx. 20 μm, while the mechanical amplitude of an automotive coating is typically in the range of 1 μm. Thus, our physiological impression depends on the contrast sensitivity and resolution capability of our eyes. As illustrated in Figure 3, the contrast sensitivity of the human eye has its maximum resolution at three periods per degree.3 Consequently, as shown in Figure 4, the detection of different texture sizes depends on the observing distance.
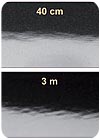
At a 40-cm distance, we can see structure sizes between 0.3 and 10 mm with a maximum at approximately 1 to 3 mm, while at a 3 m distance we can only see larger structures of 3 to 30 mm (see Figure 4). Structures smaller than 0.3 mm are mainly responsible for the image-forming quality of a surface, also referred to as the "distinctness of image" (DOI).
After considerable research, an instrument was introduced in 1992 to provide an objective evaluation of waviness with structure sizes between 0.3 to 12 mm. In 1999, the measurement principle of this instrument was further developed to increase the resolution and expand the measurement range from 0.1 to 30 mm (see Figure 5). The new instrument, a wave-scan DOI, is now capable of measuring waviness and DOI in one unit.
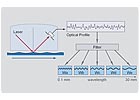 A diode laser source is used to illuminate the specimen at 60 degrees. The reflected light intensity is evaluated at the specular angle. During the measurement, the instrument is moved along the surface for a distance of about 10 cm. The intensity of the reflected light is at a maximum when coming from a concave structure element. The detector receives less light from a convex structure element. The human eye cannot resolve the actual heights of the structural elements of a painted surface, but the contrast between the light and dark areas provides an impression of depth. The contrast of a surface structure can be expressed by using the statistical parameter "variance." The final measurement results are divided into five wavelength ranges (Wa to We) using electronic filtering procedures. As a final result, a structure spectrum is obtained for structure sizes between 0.1 and 30 mm (see Figure 6).
ASTM E 430 describes the design of an instrument based on the evaluation of the reflection indicatrix.10 The instrument illuminates the specimen at a 30-degree angle and measures the light reflected at 0.3 degree from the specular angle with an aperture of 0.3-degree width. However, this instrument is no longer commercially available.
Based on a research project carried out at the German Research Association for Surface Treatment (DFO), the visual perception of DOI is influenced by a loss of contrast and by microstructures distorting outlines.11 Therefore, in 1999, a new measurement technology was developed to measure light scattering caused by structure sizes smaller than 0.1 mm.12 This new measurement parameter was named "dullness" and was incorporated into the wave-scan DOI. A LED light source and a CCD chip are used to detect the reflected image of the source aperture.
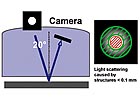 The dullness measurement determines the amount of light scattering within and outside the aperture in a defined range. The dullness value is a ratio of these two values. Therefore, this measurement parameter is independent of the refractive index. In addition, an adaptive filter is used to separate between the inner and outer image, which minimizes the influence of curvature (see Figure 7). The combination of two measurement principles in one instrument simulates the visual perception at different distances and permits categorizing structure sizes with their causes.
Based on these benefits, many of the major automotive makers and their suppliers are using the wave-scan DOI as their standard tool to objectively evaluate appearance of a car body.
Of course, the requirement to objectively measure for a uniform appearance extends to the entire vehicle, including small and highly curved parts. For this reason, the wave-scan DOI was further developed to allow measurement of automotive add-on parts, such as bumpers, gas tank doors, mirror housings, door handles, decorative trim or motorcycle parts. The new instrument, known as the micro-wave-scan DOI, uses the same measurement principle as the wave-scan DOI with miniaturized optics and redesigned electronics. The design of the micro-wave-scan instrument provides a good correlation to the wave-scan DOI and allows the measurement of parts with curvatures as small as 300 mm and a sample size of 25 mm x 40 mm.

For information on reprints of this article, contact Jill DeVries at devriesj@bnpmedia.com.
Harmony among different body panels is an essential quality criterion.
The exterior paint finish of a car plays a major role in how customers perceive its quality. The ideal "look" would be mirror-like - high gloss and perfectly smooth. But as we all know, limitations are imposed by the paint properties, process capabilities, and most importantly, the amount of money that can be spent to improve the finish. As a result, each automotive company defines its own appearance standard based on meeting or exceeding its competitors' standards and customers' expectations.
Especially important is achieving a high level of uniformity or "harmony" among all components. Harmony between the horizontal and vertical panels is critical; equally significant is how add-on parts such as bumpers, spoilers, mirror housings or other decorative trim parts match the adjacent body panels. Differences are especially obvious on models with panels that fit together tightly.
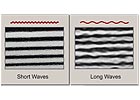
Appearance changes with structure size.
Visually Evaluating Orange Peel
One defect that commonly affects appearance is a type of waviness known as "orange peel." ASTM E 284 defines orange peel as "the appearance of irregularity of a surface resembling the skin of an orange."1 A surface can be described as exhibiting orange peel when it has many small indentations that are perceived as a pattern of both highlighted and non-highlighted areas. An observer interprets this pattern as a three-dimensional structure of hills and valleys.The U.S. automotive industry established a physical standard for orange peel in the '70s consisting of 10 high-gloss panels with varying degrees of orange peel structure.2 The panels are visually ranked from 1 to 10, with Panel Number 1 depicting very pronounced orange peel and Panel Number 10 illustrating no orange peel. The visual observer can use these panels as a supportive tool to evaluate the degree of orange peel in an automotive finish.
To understand this visual ranking, it is important to realize that our visual impression is influenced by the structure size and observing distance (see Figures 1-3, p. 20). The structured surface of a coating appears to our eye as a wavy pattern of light and dark areas. The real height differences cannot be resolved with our eye. The maximum detectable height difference is approx. 20 μm, while the mechanical amplitude of an automotive coating is typically in the range of 1 μm. Thus, our physiological impression depends on the contrast sensitivity and resolution capability of our eyes. As illustrated in Figure 3, the contrast sensitivity of the human eye has its maximum resolution at three periods per degree.3 Consequently, as shown in Figure 4, the detection of different texture sizes depends on the observing distance.
At a 40-cm distance, we can see structure sizes between 0.3 and 10 mm with a maximum at approximately 1 to 3 mm, while at a 3 m distance we can only see larger structures of 3 to 30 mm (see Figure 4). Structures smaller than 0.3 mm are mainly responsible for the image-forming quality of a surface, also referred to as the "distinctness of image" (DOI).
The contrast sensitivity of our eyes is highest at three periods per degree.3
Visually Evaluating DOI
The DOI aspect of appearance is also referred to as "image clarity." ASTM E 284 defines distinctness-of-image gloss as "the aspect of gloss characterized by the sharpness of images of objects produced by reflection at a surface."1 During visual observation, the sharpness of the light/dark edge of a reflected object can be observed.The same panel viewed at different distances.
Using Landolt Rings to Visually Analyze DOI
Landolt rings have been used by ophthalmologists to evaluate visual acuity for nearly 100 years.4 The test consists of locating the gaps in a graduated series of sizes of incomplete rings whose radial thickness and gap are equal to one-fifth the diameter of the ring. For a gloss evaluation of trans-illuminated rings, reflections are viewed on Mylar. Rings have different sizes and different gap orientations; an image-gloss scale is associated with the different sizes of rings. An image-gloss scale ranging from 10 to 100 in steps of 10 was established for 11 sizes of rings, from the largest to the smallest. The development of the scale is not documented, but it ostensibly took place in the General Motors Automotive Division about January 1977. Visual observers select the smallest size of ring for which they can call the gap orientation correctly. The visual judgment is influenced by the loss of contrast and sharpness of the outlines. The numerical size of the rings is used as an inverse index of distinctness-of-image gloss.The sensitivity of the human eye to structure sizes at a distance of 40 cm and 3 m.
Instrumentally Measuring Waviness
In addition to visual means, waviness has also been evaluated by using profilometers. The correlation between profilometry measurements and visual perception is satisfactory for surfaces with similar optical properties. However, operating a profilometer is time consuming and limited to laboratory use. When the eye of an observer is focused on a painted surface, various types of waviness can be identified that involve size, structure and shape. Variations in process or material parameters can cause differences in surface structure. For example, poor flow or leveling properties of a coating will usually cause a long wave structure often called orange peel. Conversely, changes in substrate roughness will exhibit a short wave structure of higher frequency. Because waviness is often caused on the production line, it is important to control it there.After considerable research, an instrument was introduced in 1992 to provide an objective evaluation of waviness with structure sizes between 0.3 to 12 mm. In 1999, the measurement principle of this instrument was further developed to increase the resolution and expand the measurement range from 0.1 to 30 mm (see Figure 5). The new instrument, a wave-scan DOI, is now capable of measuring waviness and DOI in one unit.
The "waviness" measurement principle of a wave-scan DOI.
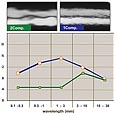
The structure spectrum of two different coating systems.
Instrumentally Measuring DOI
A variety of different technologies have been used to measure DOI.5-9 The two most often used principles are an evaluation of the steepness of the reflection indicatrix, and a measurement of contrast in dependence of the structure elements.ASTM E 430 describes the design of an instrument based on the evaluation of the reflection indicatrix.10 The instrument illuminates the specimen at a 30-degree angle and measures the light reflected at 0.3 degree from the specular angle with an aperture of 0.3-degree width. However, this instrument is no longer commercially available.
Based on a research project carried out at the German Research Association for Surface Treatment (DFO), the visual perception of DOI is influenced by a loss of contrast and by microstructures distorting outlines.11 Therefore, in 1999, a new measurement technology was developed to measure light scattering caused by structure sizes smaller than 0.1 mm.12 This new measurement parameter was named "dullness" and was incorporated into the wave-scan DOI. A LED light source and a CCD chip are used to detect the reflected image of the source aperture.
Dullness measures the amount of light scattering within and outside the aperture in a defined range.
Based on these benefits, many of the major automotive makers and their suppliers are using the wave-scan DOI as their standard tool to objectively evaluate appearance of a car body.
Of course, the requirement to objectively measure for a uniform appearance extends to the entire vehicle, including small and highly curved parts. For this reason, the wave-scan DOI was further developed to allow measurement of automotive add-on parts, such as bumpers, gas tank doors, mirror housings, door handles, decorative trim or motorcycle parts. The new instrument, known as the micro-wave-scan DOI, uses the same measurement principle as the wave-scan DOI with miniaturized optics and redesigned electronics. The design of the micro-wave-scan instrument provides a good correlation to the wave-scan DOI and allows the measurement of parts with curvatures as small as 300 mm and a sample size of 25 mm x 40 mm.
The combination of two measurement principles in one instrument (a wave-scan DOI) simulates the visual perception at different distances and permits categorizing structure sizes with their causes.
Ensuring an Accurate Perception
The visual perception of appearance is a multi-dimensional phenomenon. Therefore, it is essential to measure the various structure sizes that influence the perception of orange peel and DOI. The structure spectrum measured with the new appearance measurement instruments helps users not only to understand the visual perception of appearance, but also to analyze the cause of changes. With the miniaturization of electronic and optical components, both large body panels and small, highly curved parts can be objectively evaluated.For information on reprints of this article, contact Jill DeVries at devriesj@bnpmedia.com.
Links
Looking for a reprint of this article?
From high-res PDFs to custom plaques, order your copy today!