Intrinsic Versus Applied Hiding
A New Equation for Optimum Performance


Obtaining a smooth, uniform paint finish with a minimum number of coats is an ongoing consumer demand in the do-it-yourself (DIY) market segment of architectural coatings, as well as contractor-applied paints. In the white and pastel formulation space, minimizing coats has traditionally relied on maximizing intrinsic hide in the laboratory as measured by the Contrast Ratio of a uniform draw down. Polymeric hiding materials offer an excellent route to increased intrinsic hide, while controlling the use of titanium dioxide (TiO2). Relying on this method alone, however, overlooks the impact of rheology and application on applied hide. Newly introduced hydrophobically modified ethylene oxide urethane (HEUR) rheology modifiers based on amine technology offer performance properties that can enhance applied hide. Even greater gains in the cost-efficiency and performance balance can be achieved by looking at the collective impact of polymeric hiding technologies, rheology modifier technologies and the impact of roller application. This two-part article presents a new equation for optimized applied hiding that combines intrinsic hiding with the rheology and application contribution. Part one discusses the theory of optimizing applied hiding and new techniques used to characterize applied paint films to determine the influence of rheology on application. Part two walks through the use of this information to reformulate high-quality wall paints and show the economic and performance value in roller application and applied hide.
Understanding Applied Hiding
To fully understand the applied hiding of paint, it is necessary to separate it into its two basic components: the intrinsic hiding of the dry paint film and the effect of the application process. In white and pastel paints, intrinsic hiding is primarily achieved through the use of TiO2. TiO2 has a high refractive index that allows for light scattering in paints, which translates into intrinsic hiding. Unfortunately, TiO2 efficiency is often compromised due to formulation factors such as total pigment volume concentration (PVC), volume solids, dispersant and extender choices. These can cause individual TiO2 particles to be close together or crowd.1 Loss of TiO2 efficiency increases the cost of light scattering, with adverse effects on profit margin as well as the ability to maximize intrinsic hiding and reduce the number of coats needed to achieve a quality finish.
To show how contrast ratio is affected by basic formulating and application variables we will use models2 that predict the scattering of paints and combine that with well-established theory3 to estimate the contrast ratio of various paints. The results are shown in graphical form to aid in visualizing the magnitude of the individual effects.
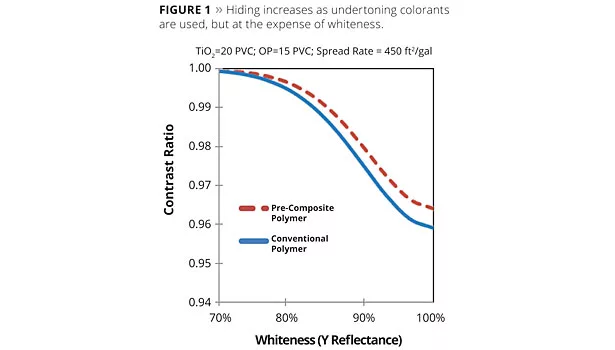
Undertoning is a common way to improve hiding, especially when pure white paint is neither required nor desired. Some undertoning is a natural consequence of raw materials in the formulation. As whiteness is decreased through the use of undertone colorant, hiding increases, as shown in Figure 1. If pure or bright white paints are desired, this approach is not useful.
Replacing a portion of TiO2 with an alternative light-scattering pigment (such as ROPAQUE™ opaque polymer),4 is another practice that helps to counteract the crowding effect of TiO2. This is an effective way to improve the cost efficiency of intrinsic hiding, but crowding can still be a factor due to the concentration, quantity and size of extender particles as well as the quality of the TiO2 dispersion.
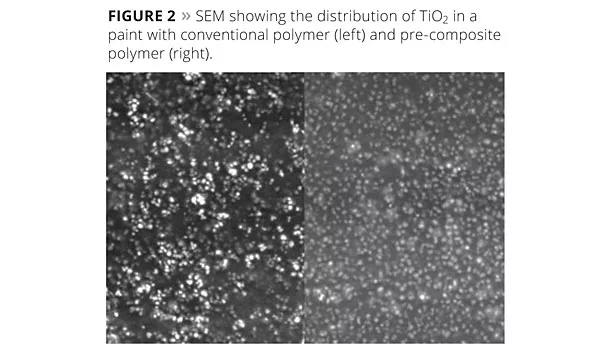
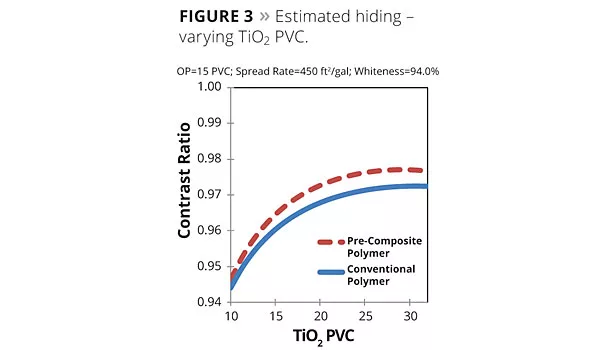
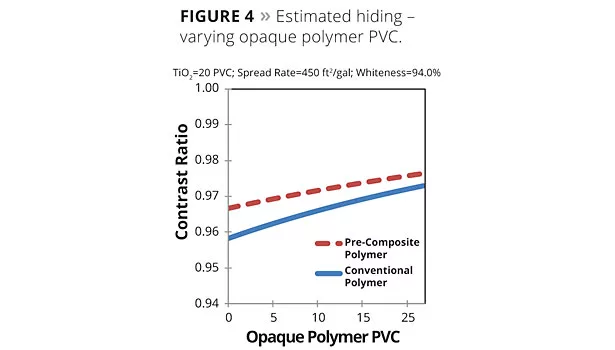
A more recent option is to reformulate with a pigment-adsorbing binder (such as EVOQUE™ pre-composite polymer)5 that is designed to strongly interact with the TiO2 surface, thus allowing for more uniform distribution of TiO2 particles, as demonstrated in Figure 2. This technology offers significant intrinsic hiding efficiency improvement over conventional polymers, as demonstrated in Figure 3. This effect is nearly additive when used in combination with ROPAQUE, as demonstrated in Figure 4.
Measuring Intrinsic Hiding
For white and pastel paints, contrast ratio is the generally accepted unit of measurement when evaluating the level of intrinsic hiding delivered by a given formulation. Specific test methods vary, but most share the common characteristic of applying a formulated paint with a bar, blade or rod designed to deposit a film that will dry to a uniform thickness of about 0.5 to several mils. Once dry, the reflectance of the paint is measured over distinct near-black and near-white areas of the coated chart, and the quotient is reported as the contrast ratio. A contrast ratio of 0.98 is generally considered to be acceptable hiding, but the desire is to be as close to unity as reasonably and economically possible.
Contrast ratio is a simple and practical measure of the hiding, which includes both the light scattering and absorption contributions of the pigments, toning colorants and other ingredients in a paint. In real-world applications, however, paints are rarely, if ever, applied in such a controlled manner. The amount of intrinsic hiding that is transferred from the paint can to the substrate is highly dependent on and influenced by application variables, such as spread rate, film thickness distribution and pattern uniformity. When a more accurate and detailed understanding of hiding is required, Kubelka-Munk theory6 is commonly used, as it separates the contribution of light scattering from light absorption per unit of thickness of the paint film. While a more time-consuming method, this type of measurement yields far more information about how the paint is developing hiding. Both methods are used in this work in order to give a practical, as well as complete, understanding of hiding.
Impact of Spread Rate and Pattern Uniformity
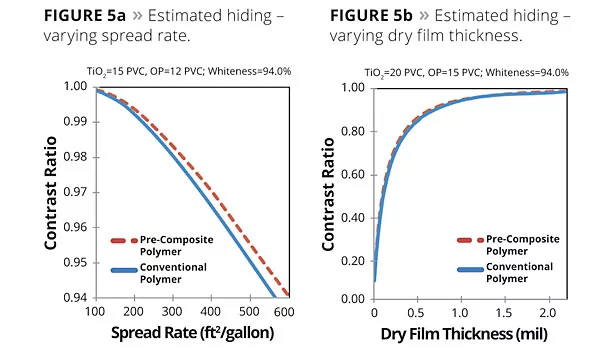
As noted, application properties are as important as intrinsic hiding properties when seeking to maximize applied hiding. Within this subset, spread rate is a key variable. Spread rates of 450 square feet per gallon are typically recommended, but in real-world application, these will vary greatly, in some cases by as much as an order of magnitude due to the substrate texture and the pattern developed by the applicator tool. Figure 5a demonstrates the relationship between intrinsic hiding and spread rate, with contrast ratio increasing as spread rate decreases. At all measured spread rates, paints formulated with pre-composite polymer (dashed red line) offer consistently higher intrinsic hiding than paints made with conventional polymer (solid blue line). Maximum optimization is represented by a combination of increased intrinsic hide and decreased spread rate.
In addition to spread rate, an equally important factor affecting applied hide is pattern uniformity of the film when applied. Paints applied by roller or brush frequently have thin spots less than 1 mil comprising a significant fraction of the area painted. Highlighting the dramatic effect that thin areas have on applied hiding, Figure 5b estimates the contrast ratio for a 38% volume solids paint applied at 450 square feet per gallon for an average dry film thickness of 1.35 mils. When a conventional polymer is used, contrast ratio is about 0.97, just below what is considered good hiding. If we assume that 20% of the area is applied at one-fifth that thickness due to application imperfections and poor leveling, then 20% of the area would be about 0.27 mils thick and 80% would be about 1.6 mils thick, for an average thickness of 1.35 mils. As demonstrated in Figure 5b, the estimated contrast ratios would be 0.74 and 0.98 respectively, resulting in an area weighted contrast ratio of about 0.93, well below acceptable hiding.
Even if thin spots only accounted for 10% of the surface area, the estimated contrast ratio would still drop to about 0.95. In real-world applications, it is important to note that thin spots are more visually apparent than the numbers indicate, as the eye is drawn to the differences in appearance. As a result, even a few thin spots, resulting in localized areas of lower hiding, can ruin the aesthetic appearance of a painted surface. In some cases, the effect is more exaggerated, as poor surface wetting leads to bare spots.
Applied hiding is positively influenced by the intrinsic hiding of the paint and the film build or thickness of the applied coating, and negatively influenced by film roughness or the lack of pattern uniformity of the dried film. Conceptually, we describe this dependence with Equation 1 and have developed formulating options to optimize each factor.
Applied Hiding ≈ Inherent Hiding + Film build - Pattern Uniformity (1)
Evaluating Film Application
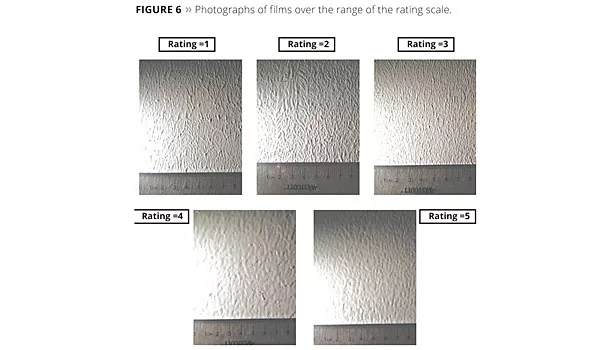
Pattern uniformity, surface smoothness, as well as the inverse, surface roughness, are all terms used to describe the texture or topography of a dried film after it is applied to a substrate, usually with a nap roller. Pattern uniformity is typically rated visually on a 1-5 scale, with 1 being poor or very rough and 5 being excellent, smooth or uniform. In order to provide the most accurate visual rating, photographs with angled lighting to highlight the thick and thin areas are used to rate the applied films. Figure 6 shows applied films with ratings from 1 through 5.
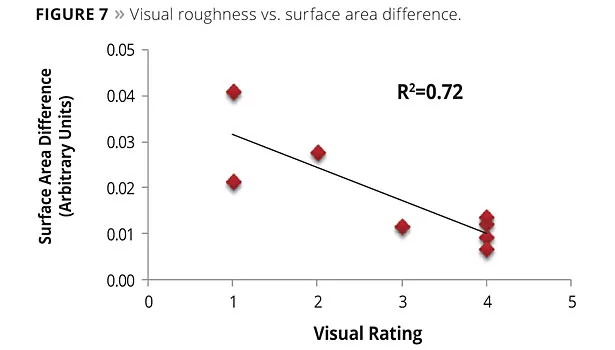
An ongoing concern with subjective qualitative ratings is the variability from different operators over time. In a method developed by Dow, profilometry was used to quantitatively rate film roughness by comparing the surface area difference, an objective numerical output of the analysis. The results are given as a difference in surface area between the imaged surface and a flat surface of the same lateral size. Profilometry is a useful tool to obtain quantitative surface roughness measurements; however, this analytical method is time consuming and costly when dealing with large series. Therefore, a data set was evaluated by visual rating, as well as surface area roughness, to understand the correlation between the two methods and as a means to determine if visual appearance is related to the topography of dried films. Figure 7 shows the correlation between the visual rating with the 1 to 5 scale and the surface area difference measured by profilometry. The results show a good correlation between the image ratings and profilometry results. Based on these correlation results, larger studies will use visual ratings in place of profilometry roughness measurements.
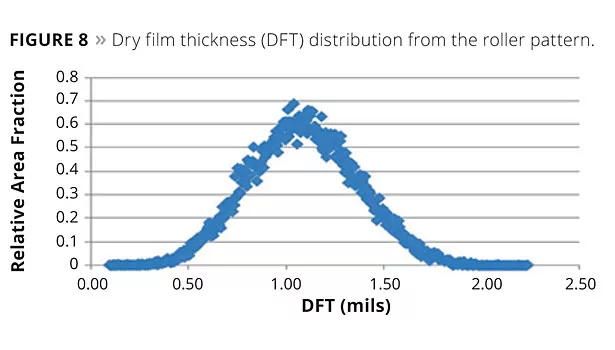
The film thickness can also be determined from the topography maps that are generated by profilometry. The measured thickness for each fractional area is used to generate a frequency plot, as shown in Figure 8. For most of the roller patterns examined, the results are well fit by a Gaussian distribution with varying averages and standard deviations.
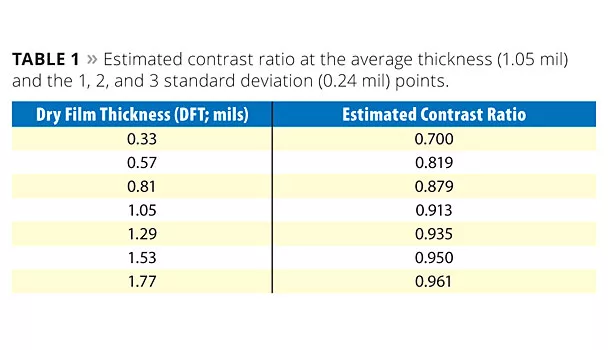
The distribution of film thickness determines the roller pattern and, ultimately, what the consumer will see as surface smoothness and applied hiding. The ideal distribution of film thickness for maximized applied hiding would be one where even the thinnest film would deliver a contrast ratio of 0.98 or greater. Table 1 shows the estimated contrast ratio for the dried film thickness distribution shown in Figure 8, where the measured S/mil is 5.0, the paint was not toned retaining a Y reflectance of 94% and the volume solids is 38%. Note the dramatic decrease in hiding as thickness decreases, as shown in Figure 5b. The estimated contrast ratios for different applications are shown in Table 2. Recommended spread rate, typical laboratory draw down and rollout tend to trend to thinner films and thus, lower hiding. For roller application, hiding is further lowered due to the pattern introducing thin spots.
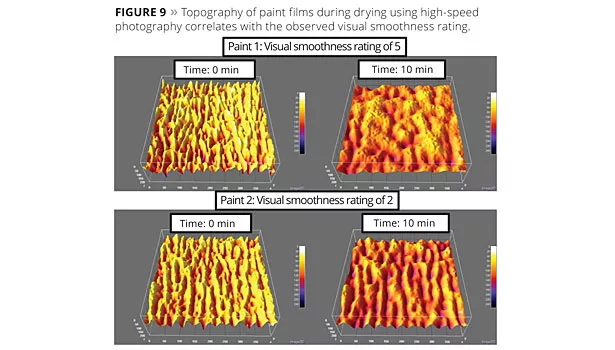
Time lapse imagery was used to understand how the surface roughness changes as paint films dry. This image method was developed for two reasons: 1) it is a faster method to understand the topography of a dried paint film than profilometry and 2) it allowed analysis of the changing topography of the film as it dried. Figure 9 are pictures of dried paint films using image analysis showing the difference in pattern uniformity over a period of 10 min of drying at 72 ?F. How the topography of the film changes, or doesn’t change, strongly influences how the dried film will appear. These two paints have very rough surfaces at time zero, but paint 1 shows a significantly smoother film at 10 min after application. These image results clearly demonstrate that the initial pattern created by the roller cover is not necessarily the final pattern observed when the film is dry.
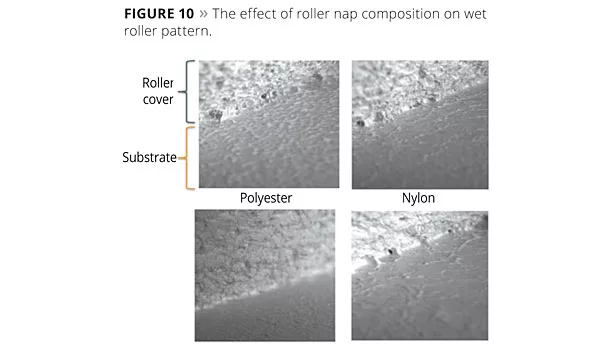
Polyester, nylon, microfiber and lamb’s wool were evaluated for the initial pattern generated. High-speed photography was used to generate the images in Figure 10. Different roughness patterns were generated by the different fiber chemistries. The length of the nap of any given category of roller fiber did not significantly affect the initial pattern, but did influence the amount of substrate that could be covered in one roller loading. The longer the roller fiber, the more surface could be covered in one roller loading, presumably because the longer roller nap held and released more paint.
The pattern uniformity or film roughness strongly influences whether or not a paint will provide poor or excellent applied hiding. The influencing factors that generate the uniformity of the pattern are the paint’s capability to flow and level after application, as well as the choice of roller cover that generates the initial pattern.
The Cost of Poor Application Performance
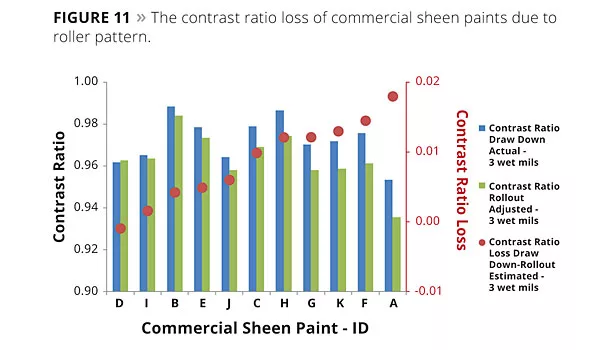
When commercial paints are applied to real-world substrates, the application process produces wet films that are less than ideal. As a result, actual dried films vary in thickness and, in general, are thinner than those typically tested in the laboratory. As shown in Table 2, the application process usually results in lower applied hiding than observed in laboratory testing. Eleven commercial sheen paints were purchased to benchmark the hiding loss due to roller application. The contrast ratios of each paint applied with a 3 mil Bird bar and a roller to its natural spread rate were measured. The contrast ratios of the roller-applied paints were mathematically adjusted to an average wet film thickness of 3 mils using the previously mentioned Kubelka-Munk theory in order to isolate the difference due to the roller pattern. The decrease in hiding, given by the contrast ratio loss, is shown in both Figures 11 and 12.
In Figure 12, contrast ratio loss is used as a means to estimate the amount of TiO2 that is being under-utilized in the formulation. All of the hiding power is not being transferred to the substrate due to the effect of the roller pattern. The estimated hiding dependence on TiO2 level first shown in Figure 3 is recast in terms of both TiO2 PVC and pounds/gallon. Actual contrast ratio data are included in Figure 13 to show the predictive capability of the model. The average slope in the range of white and pastel paints is estimated at 0.6 pounds/gallon TiO2 per 0.01 unit change in contrast ratio. That relationship is used to convert the contrast ratio loss to an estimated TiO2 efficiency loss, that is, how much TiO2 is under-utilized due to the roller pattern. Only two of the 11 paints utilize the TiO2 fully when roller applied. Of the other nine paints, the amount of under-utilized TiO2 ranges from 0.25 to 1 pound/gallon. If TiO2 costs $1.50/pound, that represents overspending $0.37 to $1.50 per gallon of paint and not gaining its full value. In order to support that the roughness induced by the roller pattern is driving the contrast ratio loss, we measured the surface area difference by profilometry as discussed previously. The correlation shown in Figure 14 strongly supports the effect of roller pattern roughness on decreasing hiding.
In the second part of this article, we will employ the hiding and rheology principles described here to recover much of the under-utilized TiO2 hiding power. EVOQUE pre-composite polymer offers a means to increase the intrinsic hiding of the paint while new, high-performance ACRYSOL™ HEUR rheology modifiers based on amine technology offer a rheology profile providing lower spread rate, increased film build and more uniform roller pattern. These technologies, singularly and in combination, offer new methods to help improve the applied hiding of coatings.
References
1 Steig, F. J. of Coatings Tech. 1981, 53, 680, 75-79.
2 Fitzwater, S.; Hook, J. J. of Coatings Tech. 1985, 57, 721, 39-47.
3 Judd, D.; Wyszecki, G. Color in Business, Science, and Industry; Wiley; 1975.
4 Eckenrode, H.; Fasano, D. Shining New Light on Opaque Polymer; CoatingsTech. 2012, 8.
5 Adamson, L.; Fasano, D. Advancements in TiO2 Composite Technology; PCI Magazine 2012, 8.
6 Kubelka, P.; Munk, F. Ein Beitrag zur Optik der Farbanstriche, Z.Tech. Phys. 1931, (Leipzig), 12, 593–601.
™ Trademark of The Dow Chemical Company (“Dow”) or an affiliated company of Dow.
Looking for a reprint of this article?
From high-res PDFs to custom plaques, order your copy today!

