Failure Analysis of Synthetic Dyes Using Pyrolysis-GC/MS Technique

Today, analytical pyrolysis encompasses much more than simple flash pyrolysis of polymeric materials. Virtually any material (liquid or solid) can be characterized using an array of techniques, which are designed into a modern day, multi-mode pyrolysis system. Using a multi-mode pyrolyzer, volatiles, additives and oligomers, as well as polymeric and heavier components, can be analyzed. In addition to materials characterization, this technique enables scientists to perform deformulation (reverse engineering), failure, contamination and degradation analyses. This technique is also broadening the range of samples that can be analyzed using Gas Chromatography-Mass Spectrometry (GC/MS), as any solid sample can be introduced into the pyrolyzer without any need for solvent, solvent extractions or pretreatments prior to the analysis.
Subtle differences in paint formulation are common as several additive packages are introduced to vary the chemical and physical properties of the product. There are instances where the product suddenly becomes more brittle, easily deformed or fails in routine use. Characterization of these vital products is essential for development, manufacture, processing, usage and failure analysis. The qualitative and quantitative analysis of these additive packages often requires sample pretreatment, such as solvent extraction, to isolate or concentrate the additives of interest. In response to these analytical challenges, Frontier Lab developed a technique using its Multi-Mode Pyrolyzer coupled with a GC/MS system for analyzing paints and synthetic dyes. This technique provides the analyst with a “method map” for performing failure, material characterization and deformulation analyses.
The first step is the Evolved Gas Analysis (EGA). In this technique, the sample is dropped into the furnace, which is at a relatively low temperature (40-100 °C). The furnace is then programmed to a much higher temperature (600-800 °C). Compounds “evolve” from the sample as the temperature increases. A plot of detector response versus furnace temperature is obtained. The EGA provides a clear picture of the sample complexity, and by using extracted ion chromatograms (GC/MS), one can identify the EGA thermal zone where specific compounds of interest evolve from the sample. Then, the pyrolyzer’s furnace can be programmed for the next step to thermally slice the EGA thermal zones into different chromatographic runs.
The Frontier Pyrolyzer has a variety of applications in the paint and coatings industry. This technical application note details the “method map” methodology for performing failure analysis on two synthetic dyes.
Experimental
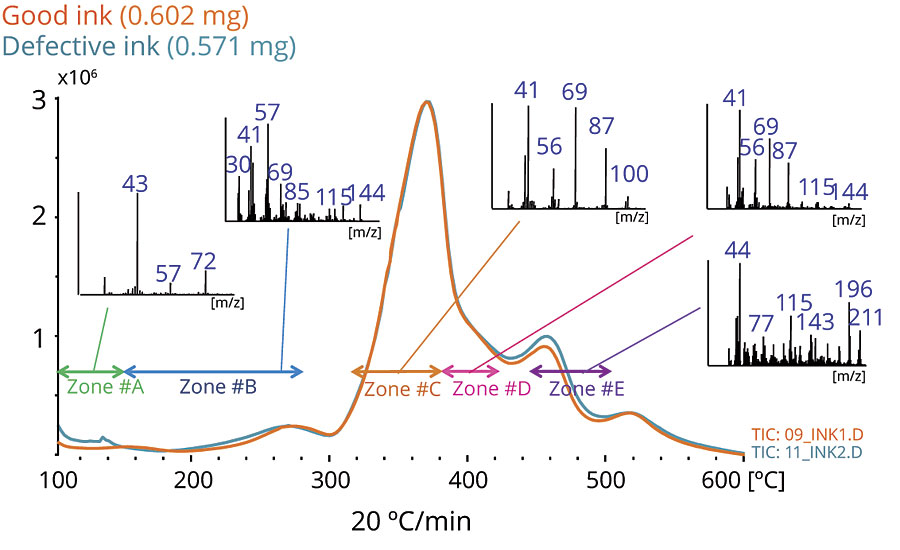
This experiment was performed to differentiate a good synthetic black ink dye from a defective one. The defective black dye is very hard to dry and stays wet longer than the good one. Both samples were submitted as solid powders. To figure out the root cause of the failure and to determine the differences in chemical compositions of the two black inks, Pyrolysis-GC/MS technique was used. The EGA was the first step in the analysis. 0.1 to 0.5 milligrams of each sample “as is” were placed in Eco-Cups. Then the pyrolyzer furnace was programmed from 100 to 800 °C (20 °C/min). To obtain the EGA thermograms, a deactivated EGA tube (UADTM-2.5N: L=2.5 m, i.d.=0.15 mm, Frontier Lab) was used to connect the GC injection port to the MS. The GC oven was kept isothermal at 300 °C.
To perform further analysis on the samples, the EGA tube was switched to a separation column (Ultra ALLOY-5: 5% diphenyl 95% dimethylpolysiloxane, L=30 m, i.d.=0.25 mm, d.f.=0.25 mm, Frontier Lab). This was easily accomplished without venting the MS by using a vent-free GC/MS adaptor. The heart-cutting (HC) technique was performed on the samples using the separation columns.
Results and Discussion
The overlaid EGA thermograms of both samples are shown in Figure 1. To analyze the samples in more detail, heart-cutting (HC-GC/MS) was performed; both EGA thermograms were sliced into five thermal temperature zones for heart-cutting.
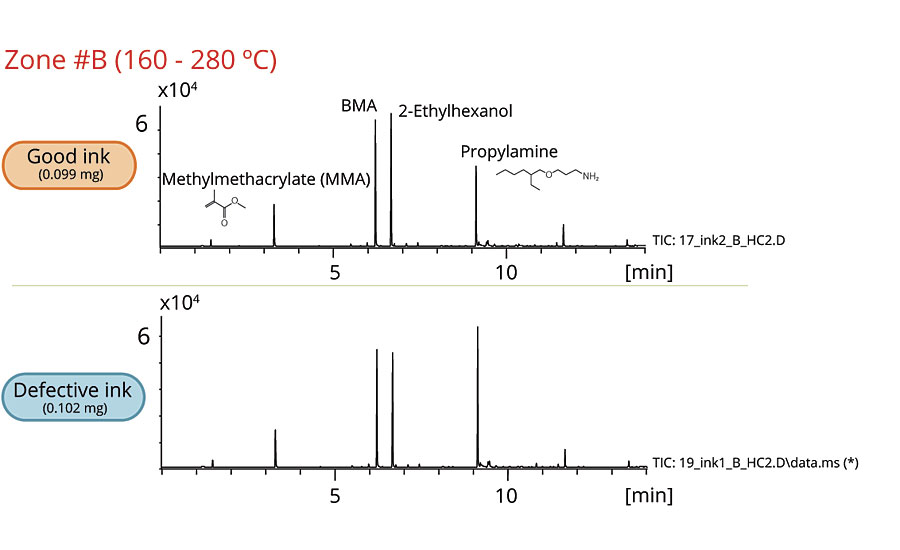
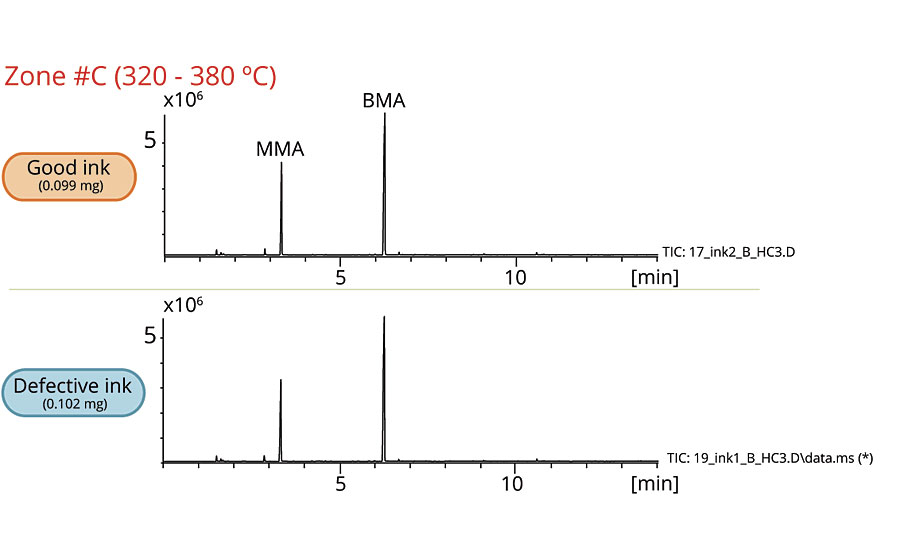
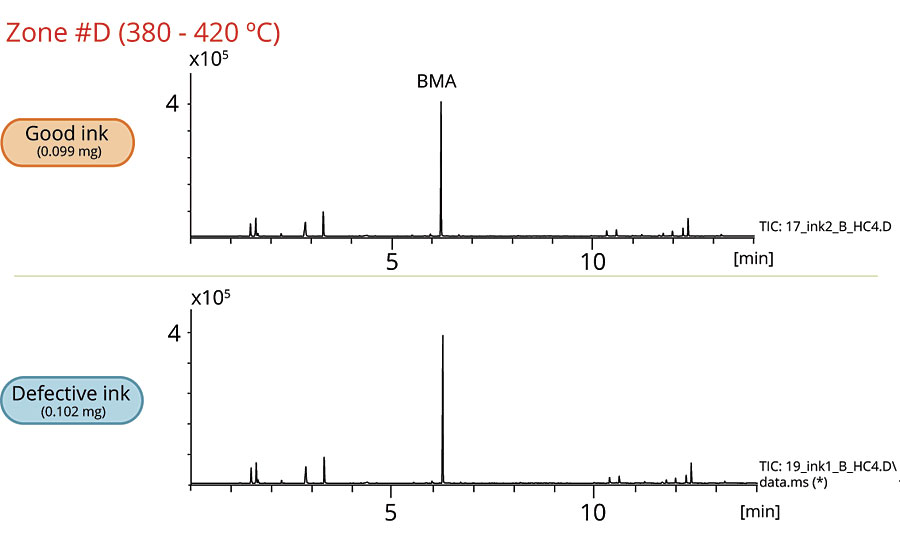
Figures 2-6 show the chromatograms of the inks in each zone. The collected data from Zone A concludes that 2-naphthol was detected in the defective ink while almost none was observed in the good one. The remaining zones show that the peaks originated from the thermal degradation of the resins (PMMA and PBMA), and solvents are present in both the good and defective inks.
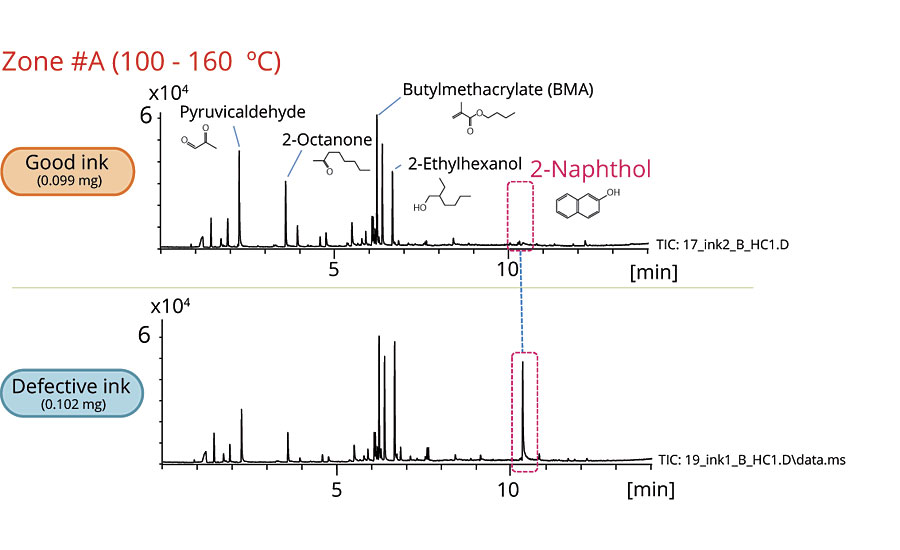

To compare the 2-naphthol content in both samples, the quantitative analysis was performed by comparing the peak areas. As shown in Table 1, the defective dye contains 4.9 times the amount of 2-naphthol contained in the good dye.

Conclusion
Using the traditional pyrolysis technique, which is performing flash pyrolysis at a set temperature, the chemical composition difference between the two dyes could not be identified. On the other hand, using the modern Multi-Mode Pyrolyzer, first the thermal profile of both samples was determined from the EGA thermograms. Then the heart-cutting technique revealed the difference between two dyes that was caused by an additive.
The Multi-Mode Pyrolyzer provides users with a clear picture of the sample’s composition by identifying the thermal zones and the compounds in each zone. Using the obtained EGA thermogram, one can simply program the pyrolyzer’s furnace with the appropriate temperature and method. This technique allows multiple analysis on a single sample, while there is no need for any solvent and sample pretreatment as the sample is simply introduced into the GC/MS by the Frontier Multi-Mode Pyrolyzer.
Using pyrolysis GC/MS, solid samples can be analyzed. There is no solvent required when using pyrolysis GC/MS as opposed to traditional GC/MS techniques. In other words, the solid and liquid samples can be injected into the pyrolyzer without any solvent and sample pretreatment like solvent extraction.
References
1. K. Tei, A. Hosaka, Frontier Laboratories.
2. I. Iwai, Frontier Laboratories and Diablo Analytical, Inc. USA.
3. Y. Seto, National Research Institute of Police Science,
4. N. Teramae, Frontier Laboratories and Tohoku University.
For more information, e-mail rojin@frontier-lab.com. You can also view a Frontier Lab webinar on this technology at pcimag.com/webinars.
Looking for a reprint of this article?
From high-res PDFs to custom plaques, order your copy today!


