Tolerancing: The Key to Accurate Color

Prefer the magazine experience? Subscribe to our digital edition here.
Tolerances are used to control color, ensure consistency within a production run and minimize lot-to-lot variability. Even when using spectral data and tolerances to quantify color, customers and suppliers can still disagree. To ensure expectations are clear and everyone is aligned, it’s important to select and use the right tolerancing method for your application. X-Rite’s Color iQC quality control software makes it easy to establish realistic tolerances and evaluate color quality. To make educated pass/fail decisions you need to know how to select the right tolerancing method and set an achievable tolerance.
Selecting a Color Model
The most common color models are L*a*b* and L*C*h°. The concept behind them is similar to longitude, latitude and altitude. With three coordinates, you can describe the exact location of any place on the planet, or in this case, any color in color space.
L*a*b*
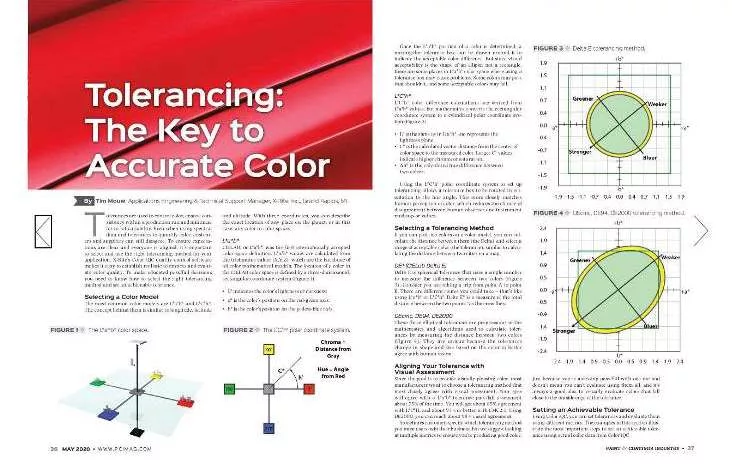
CIELAB, or L*a*b*, was the first internationally accepted color space definition. L*a*b* values are calculated from the tristimulus values (X,Y,Z), which are the backbone of all color mathematical models. The location of a color in the CIELAB color space is defined by a three-dimensional, rectangular coordinate system (Figure 1):
• L* indicates the color’s lightness or darkness;
• a* is the color’s position on the red-green axis;
• b* is the color’s position on the yellow-blue axis.
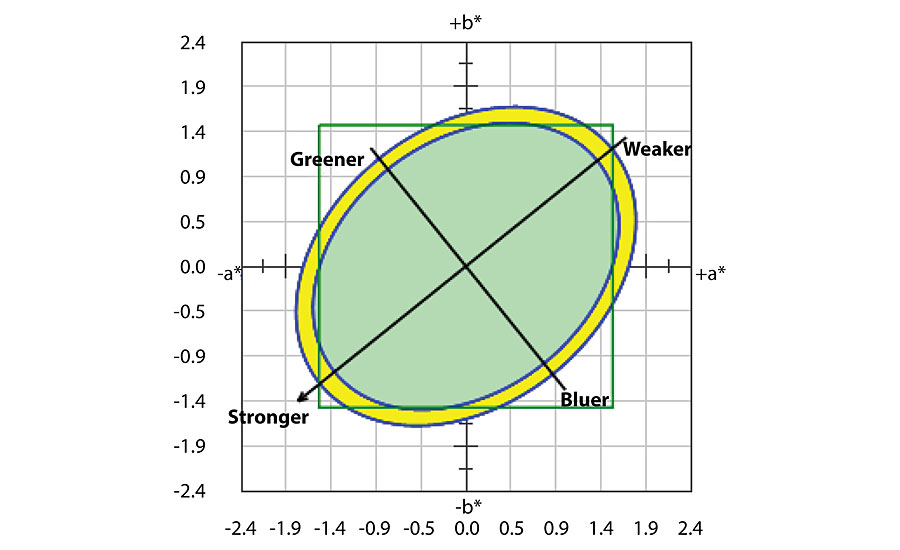
Once the L*a*b* position of a color is determined, a rectangular tolerance box can be drawn around it to indicate the acceptable color difference. But since visual acceptability is the shape of an ellipse, not a rectangle, there are some places in L*a*b* color space where using a tolerance box may cause problems. Some colors may pass that shouldn’t, and some acceptable colors may fail.
L*C*hº
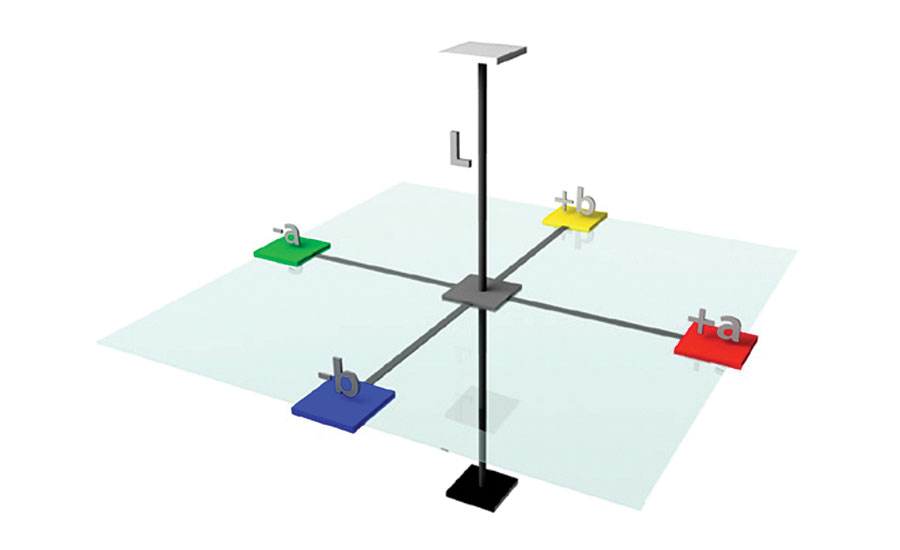
L*C*hº color difference calculations are derived from L*a*b* values, but mathematics converts the rectangular coordinate system to a cylindrical polar coordinate system (Figure 2).
• L* is the same as in L*a*b* and represents the lightness plane.
• C* is the calculated vector distance from the center of color space to the measured color. Larger C* values indicate higher chroma or saturation.
• Δh° is the calculated hue difference between two colors.
Using the L*C*hº polar coordinate system to set up tolerancing allows a tolerance box to be rotated in orientation to the hue angle. This more closely matches human perception of color, which reduces the chance of disagreement between human observer and instrument readings or values.
Selecting a Tolerancing Method
If you can plot two colors on a color model, you can calculate the distance between them (the Delta) and select a range of acceptable color (the tolerance), similar to calculating the distance between two cities on a map.
DE* (CIELab Delta E)
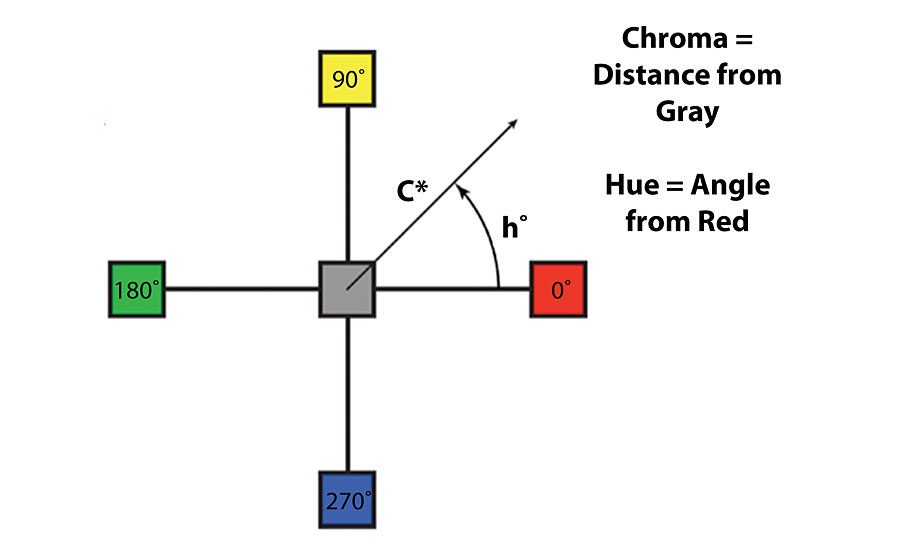
Delta E is spherical tolerance that uses a single number to measure the difference between two colors (Figure 3). Consider you are taking a trip from point A to point B. There are different routes you could take – that’s like using L*a*b* or L*C*h°. Delta E* is a measure of the total distance between the two points “as the crow flies.”
DEcmc, DE94, DE2000
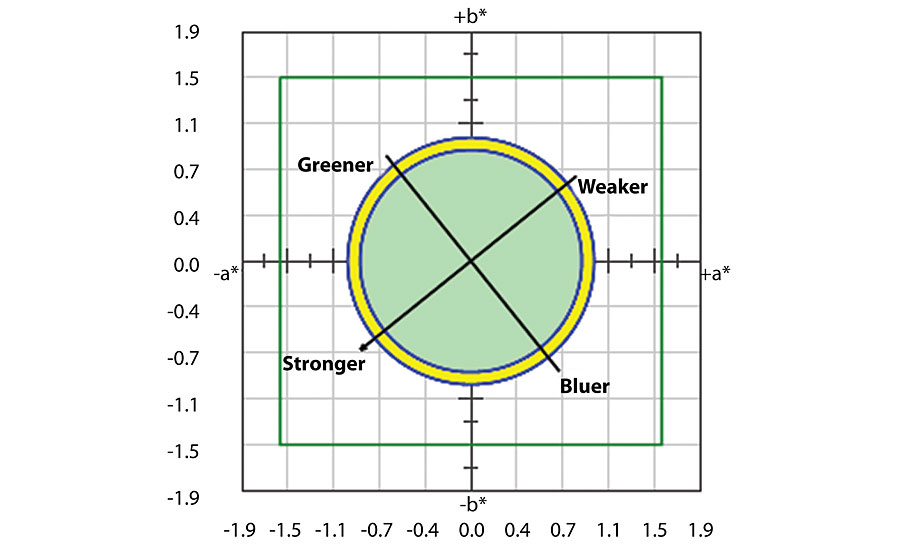
These three elliptical tolerances are progressions in the mathematics and algorithms used to calculate tolerances by measuring the distance between two colors (Figure 4). They are unique because the tolerances change in shape and size based on the color to better agree with human vision.
Aligning Your Tolerance with Visual Assessment
Since the goal is to provide visually pleasing color, most manufacturers want to choose a tolerancing method that most closely agrees with visual assessment. Your eyes will agree with a L*a*b* tolerance pass/fail assessment about 75% of the time. You will get about 85% agreement with L*C*H, and about 95% or better with CMC2:1. Using DE2000, you can reach about 98% visual agreement.
Sometimes customers specify which tolerancing method you must use to win their business, but we suggest looking at multiple metrics to ensure you’re producing good color. Just because you’re assessing pass/fail with one method doesn’t mean you can’t evaluate using them all, and it’s always a good idea to visually evaluate colors that fall close to the outside edge of the tolerance.
Setting an Achievable Tolerance
Using Color iQC, you can set tolerances and evaluate them using different metrics. The examples in this section illustrate the most important steps to set an achievable tolerance using actual color data from Color iQC.
Build a Tolerance Using Real Samples
If you are just getting started and have not set up tolerancing parameters, start by capturing both good and bad samples. Choose samples that your customer did and did not approve, then measure them and evaluate at least 10-20 samples to determine the proper limits.
For example, Figure 5 shows a plot from Color iQC using DEcmc (an elliptical tolerance) with several plotted samples. Those that plot with a green circle are within the current tolerance, and the red circles are outside the tolerance. Red circles that appear to be in the center but are failing are actually outside of the three-dimensional ellipse. If you look at the data on the right, you see these red circles are either too dark or too light. Graphically, it is easy to see which samples passed and which failed.
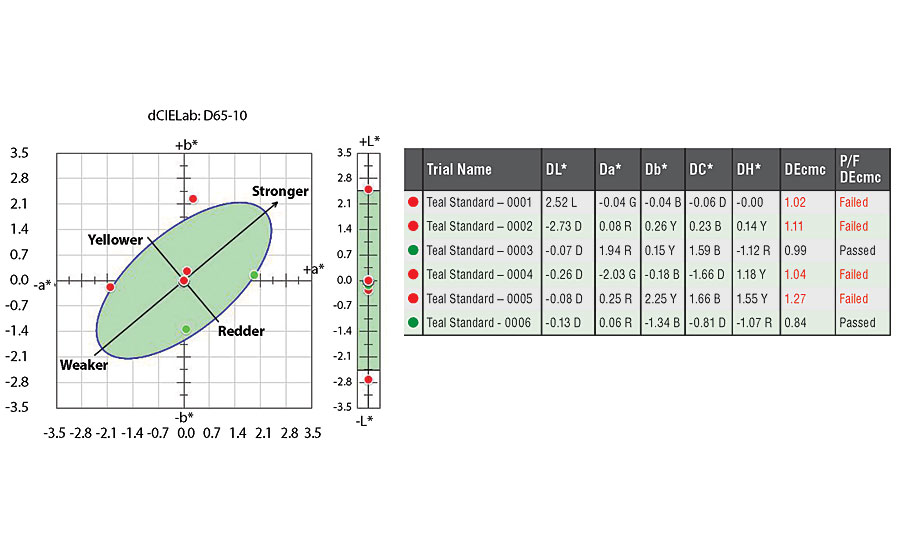
For this example, let’s assume samples 0001 and 0004 are visually acceptable and approved by the customer. Since they fall at 1.02 and 1.04, a tolerance of 1.0 is probably too small. Adjusting the tolerance to 1.05 will plot more samples with a green circle and a passing green checkmark.
Of course, it’s never this straightforward. It’s not unusual to have a customer accept a color with a higher DEcmc than a color they rejected. That’s why visual evaluation is also important. To set an achievable tolerance, find the DE of the lowest sample you want to fail, and make sure the tolerance is less so you don’t pass anything the customer will reject.
Make Your Tolerance Actionable
The difference between good and bad color is not a knife’s edge. For example, if your tolerance is 1.00, that doesn’t mean that .99 is great color and 1.01 is awful – visually they are essentially the same color. Setting a margin in Color iQC can help you take action before you get too close to the edge of the tolerance.
In the example in Figure 6, the default tolerance is 1.0 with a 10% margin. Colors that fall below 0.9 will pass with a green circle, colors that fall above 1.0 will fail with a red circle, and colors that fall between will appear with a yellow circle.
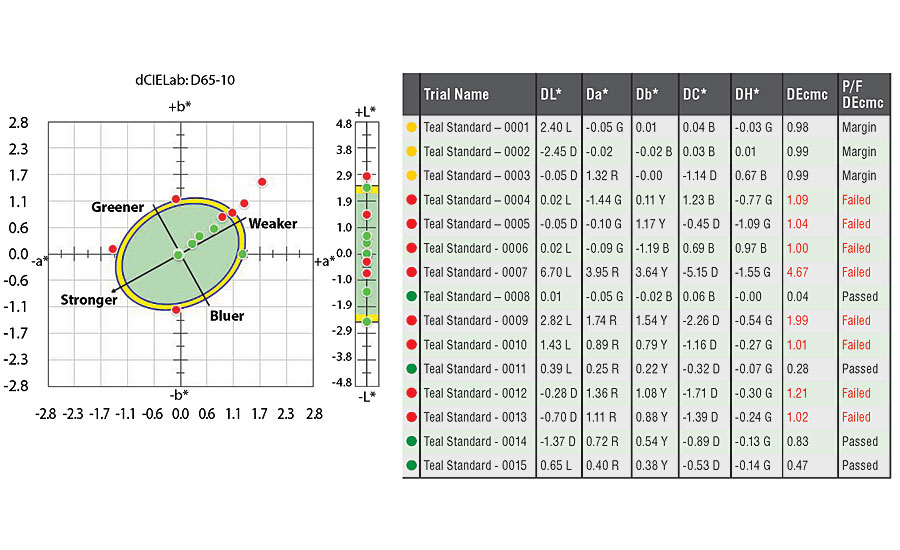
If you’re watching production trends and see the Delta E enter the yellow margin, you can stop and take action. The margin will also allow you to pass green circles with confidence because you know they are not close to failing. The amount of margin you set is up to you. It simply makes the tolerance a little tighter so you can visually evaluate anything that is in danger of not passing customer inspection.
Employ Multiple Metrics
While elliptical tolerances like Delta E or Delta E CMC are very good at showing you colors that pass and colors that fail, they don’t tell you how to fix issues. We recommend pairing L*a*b* or L*C*H* – whichever three-dimensional color space you are most comfortable with – to correct issues.
In Fig 6 we can see the second sample (0002) is in the margin, nearly failing, but why? And what should we be doing to correct this color before it starts to fail? When you look at DL*, Da* and Db* you can see that it is 2.45 units too dark, and nearly spot on for Da* and Db*. This gives us the direction we need to adjust this color to bring it back to passing the tolerance.
Using Color iQC makes it is easy to tolerance in both Delta L*a*b* (or L*C*H*) and Delta E. Figure 7 shows toler-ancing in Delta Ecmc with instructions to also test DL*, Da* and Db*. Although it appears to be plotting the same things, it is actually plotting two tolerances. For a sample to pass, it has to be inside the box AND inside the ellipse, three-dimensionally.
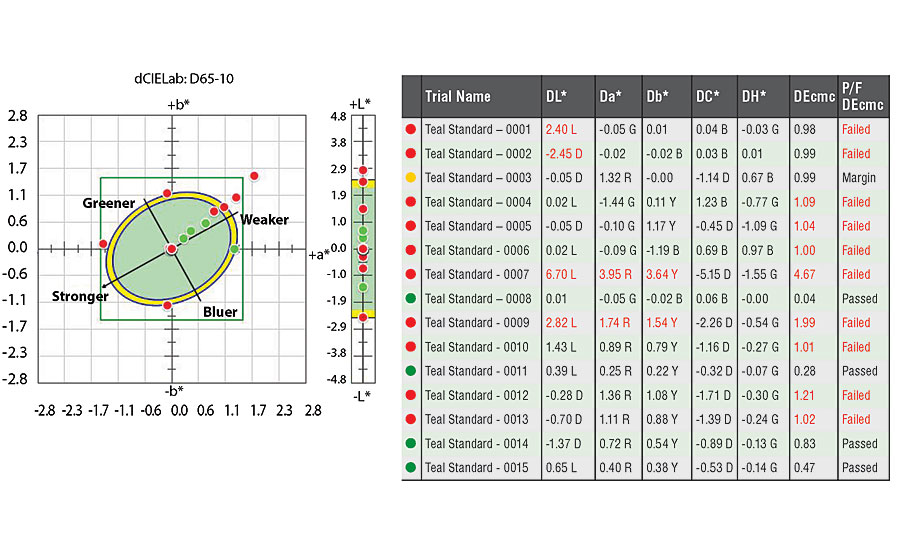
While the first two samples passed with DEcmc, they both fail when DL*, Da* and Db* are added. Leveraging this additional tolerancing method not only stops you from accepting a color that your customer will likely reject, it also shows why the color failed.
Conclusion
While Color iQC can take the guesswork out of tolerancing, it does not replace the need for human interaction. Be sure to fully understand the choices that are selected in the software and incorporate visual evaluation for the most effective tolerancing program.
For more information, visit www.xrite.com.
Looking for a reprint of this article?
From high-res PDFs to custom plaques, order your copy today!


