
A Comprehensive Evaluation of PVDF Water-Based Resins for Exterior Coatings Performance

Need to Know
- This article evaluates PVDF water-based resin performance using accelerated aging, QSun weathering and salt spray testing.
- Results compare viscosity stability, pH drift, gloss retention, color change and corrosion resistance across formulations.
- The study highlights formulation-dependent tradeoffs influencing durability, adhesion and chemical resistance in exterior coatings.
Background on Resins and Water-Based Formulas
Resins are often defined by their chemical structure, which reflects their physical attributes. These polymers can be further divided into various groups, such as thermoplastic and thermoset materials. Thermoplastic polymers are those that maintain their chemical identity as they transform into the final material, whereas thermoset polymers react chemically to achieve the final product.1 Resins can be characterized by various markers, including minimum film-forming temperature (MFFT), gloss, chemical resistance, mechanical resistance and rheological performance.
Resins provide an important function in the coatings industry: to protect the underlying material. The protection provided by the resin is often measured by variables such as color retention, and mechanical and chemical durability.2-3 The variables in the environment in which the coating is used will determine the strength of durability needed from the coating. For example, an area that receives more direct sunlight will require a topcoat that can provide better UV degradation resilience than an overcast area. Further, areas near the coast will require topcoats that offer corrosion resistance due to increased salt concentration.
Recently, in the coatings industry, there has been an effort to switch from solvent-based systems to water-based systems. This is largely impacted by new regulations that classify certain solvents as volatile organic compounds (VOCs) that exhibit photochemical reactivity and create increased concentrations of ground-level ozone. This increased concentration negatively affects the environment as well as human health. Another factor influencing this switch is the movement away from petroleum-based materials, an effort that is increasingly important as the plastics industry continues to grow and the demand for petroleum products rises, requiring a shift to different material sources.
Switching from a solvent-based system to a water-based one has its challenges. First, the resins and additives that were used in a solvent-based formula need to be soluble in water. This can occur through modifying the additive directly by creating a new version that exhibits similar properties as before but is now hydrophilic.4 Second, these water-based systems need to meet the same specifications as the previous solvent-based systems in order to be viable for commercial use. Third, since the system is water-based, the energy required for film formation increases due to the evaporation rate of water compared to other organic solvents. Another issue with the water-based system is that the components of the formula are water soluble and therefore can more easily enter the ecosystem, potentially causing more difficult-to-address pollution issues since the pollutants are water soluble instead of insoluble as before.5
Supplier A’s PVDF Latex Emulsions
Supplier A provides the three PVDF latex emulsions that are used in APV’s NeverFade products. The resins for this project were chosen due to their prevalence in the marketplace and inclusion of this PVDF polymer. The current understanding of this material and its contributions is that PVDF provides good impact strength, hardness, mechanical strength and thermal stability as well as piezoelectric properties.6-7
Because of these reported properties, PVDF is prevalent in many fields, including sensors, energy harvesting, biomedical devices and coatings.7 The use of PVDF in water-based systems lowers the absorbance of UV radiation in the 200–400 nm region compared to other commercially available water-based resins. Other reported benefits of these PVDF resins include higher gloss readings and improved color retention over time.8
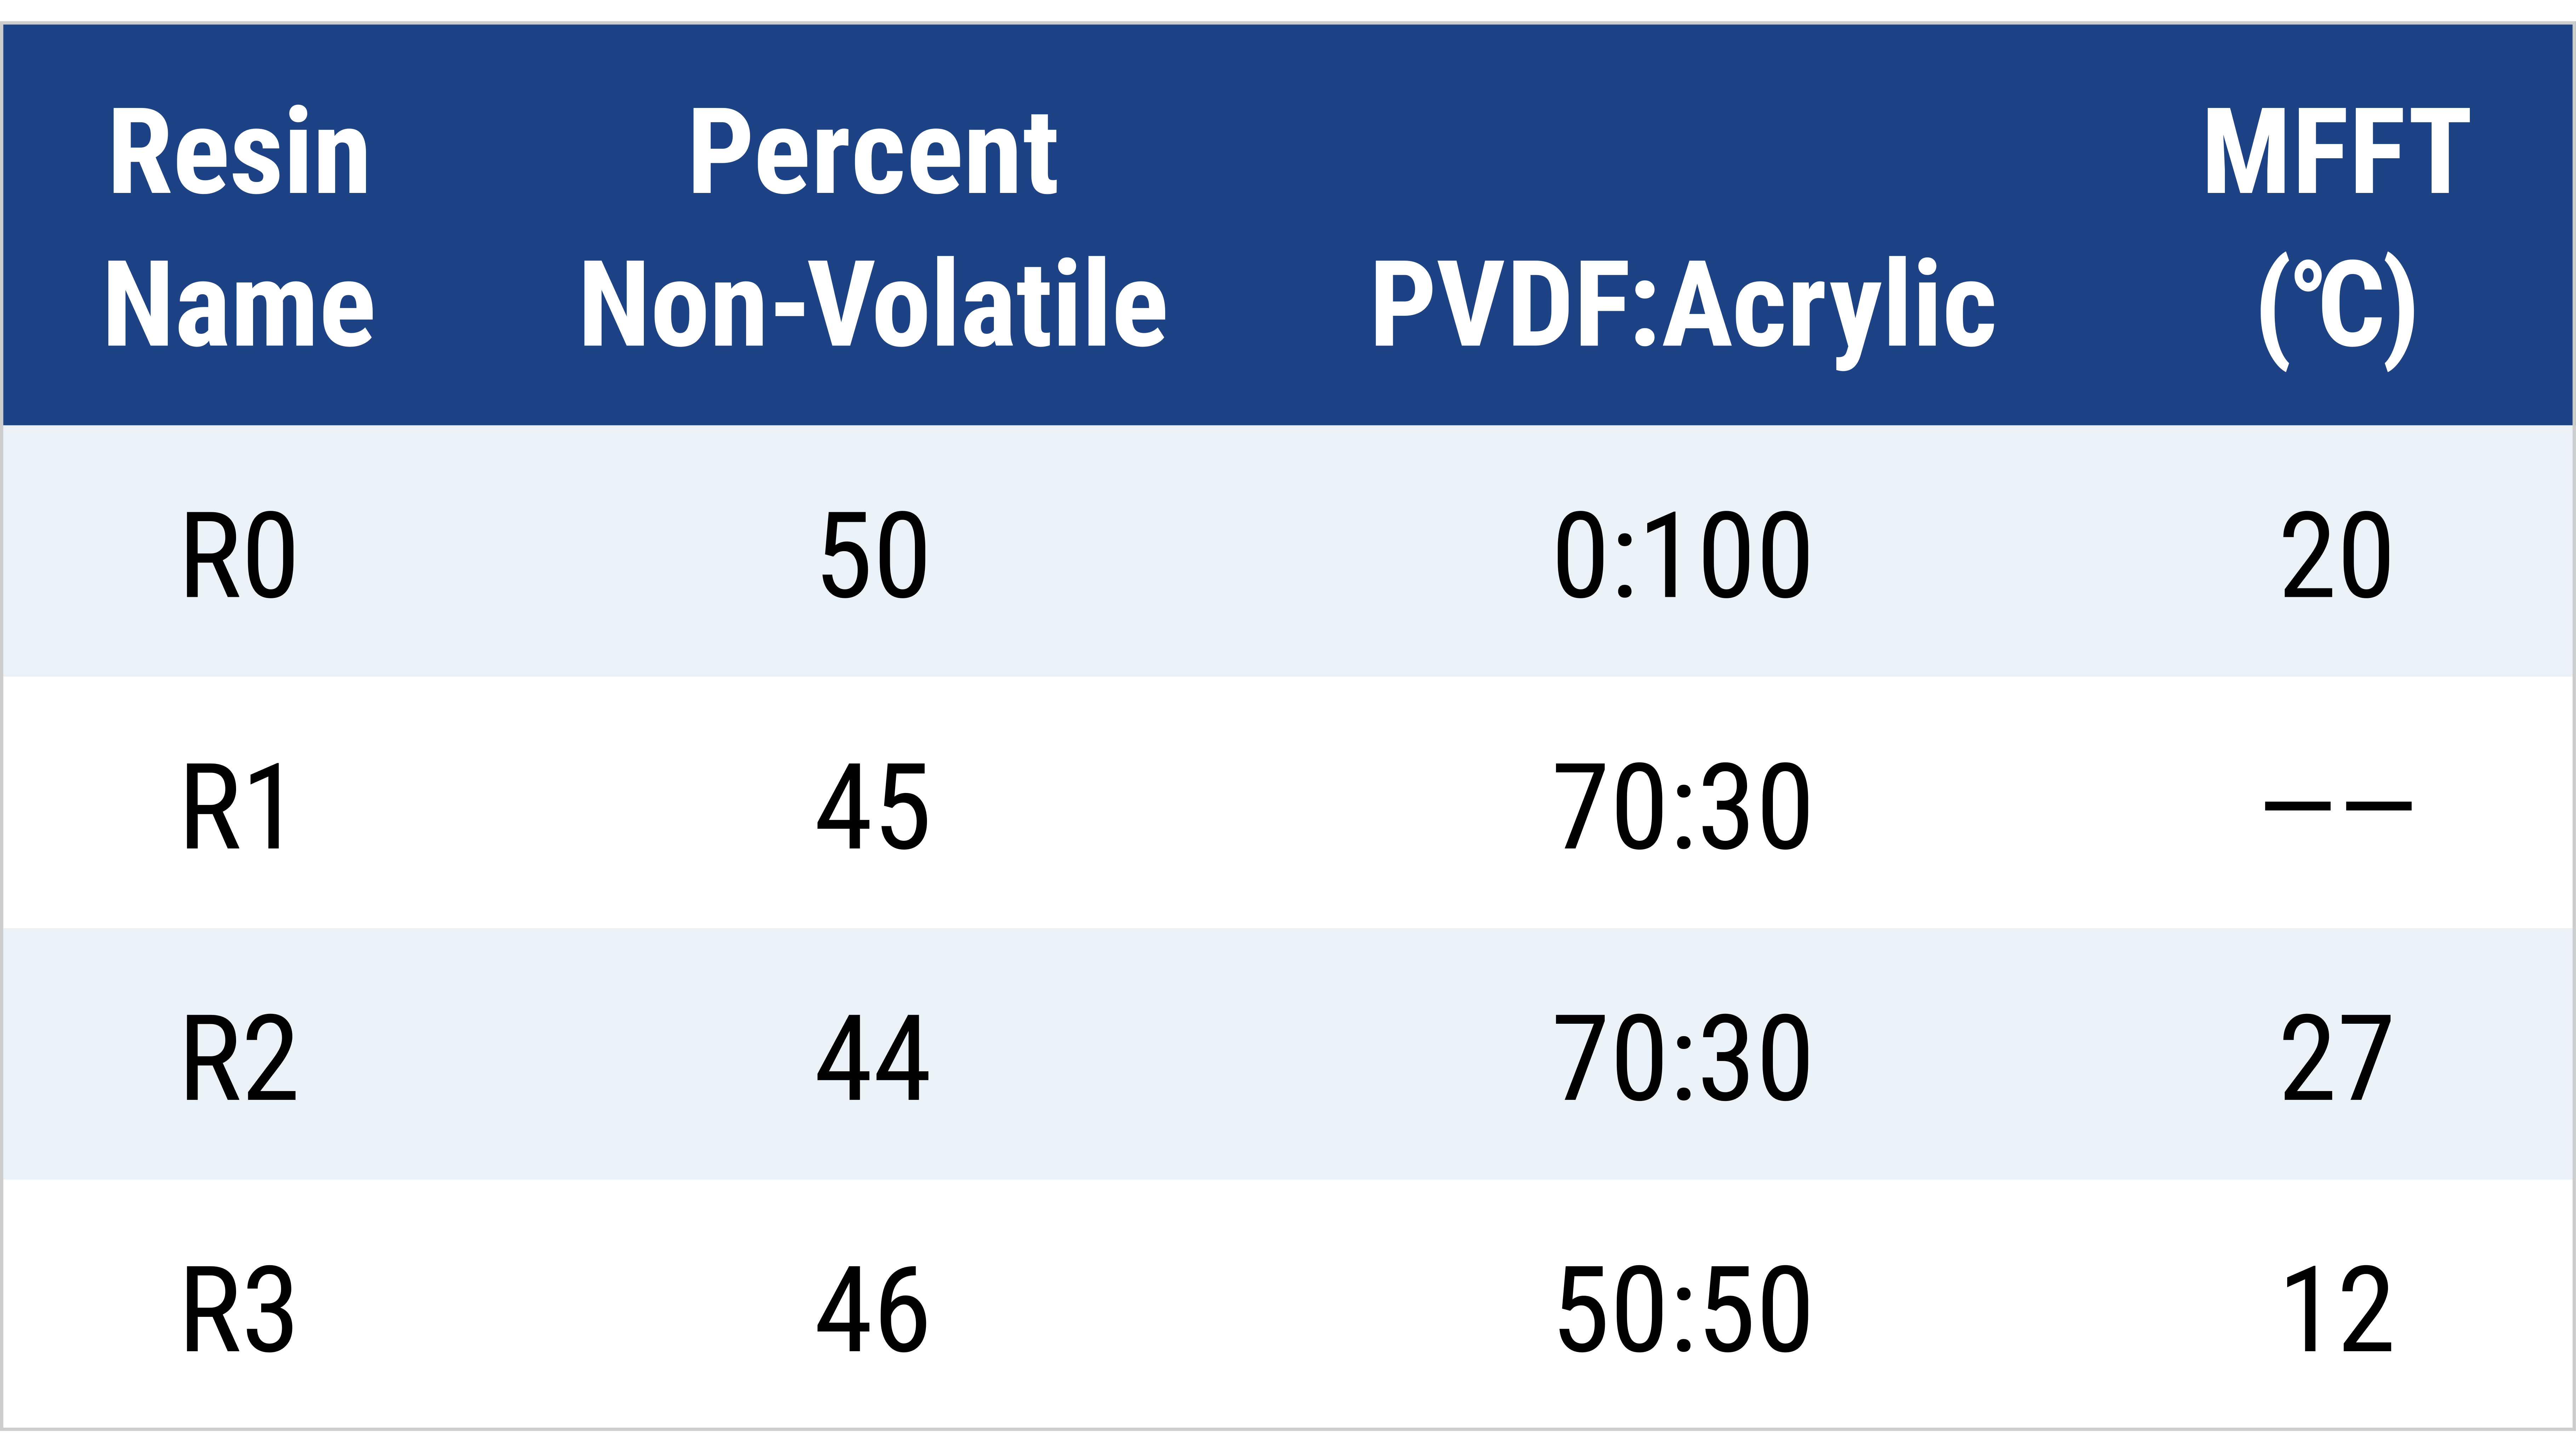
The goal of this summer research was to utilize this information regarding the industry shift to evaluate three of Supplier A’s PVDF latex water-based emulsions, R1, R2 and R3, against an all-acrylic, no-PVDF resin (R0) with a similar nonvolatile weight percentage (Table 1). Through this work, a series of additives was used for initial testing and formula adjustments to observe resin qualities and changes over time between each resin. Additionally, a series of tests from the American Architectural Manufacturers Association (AAMA) was implemented to better compare and contrast these resins and their performance under a standardized test framework.
Experimental Methods
The following four resins were tested in this project: R0, R1, R2 and R3. The first three resins were provided by Supplier A, and R0 was the all-acrylic standard.
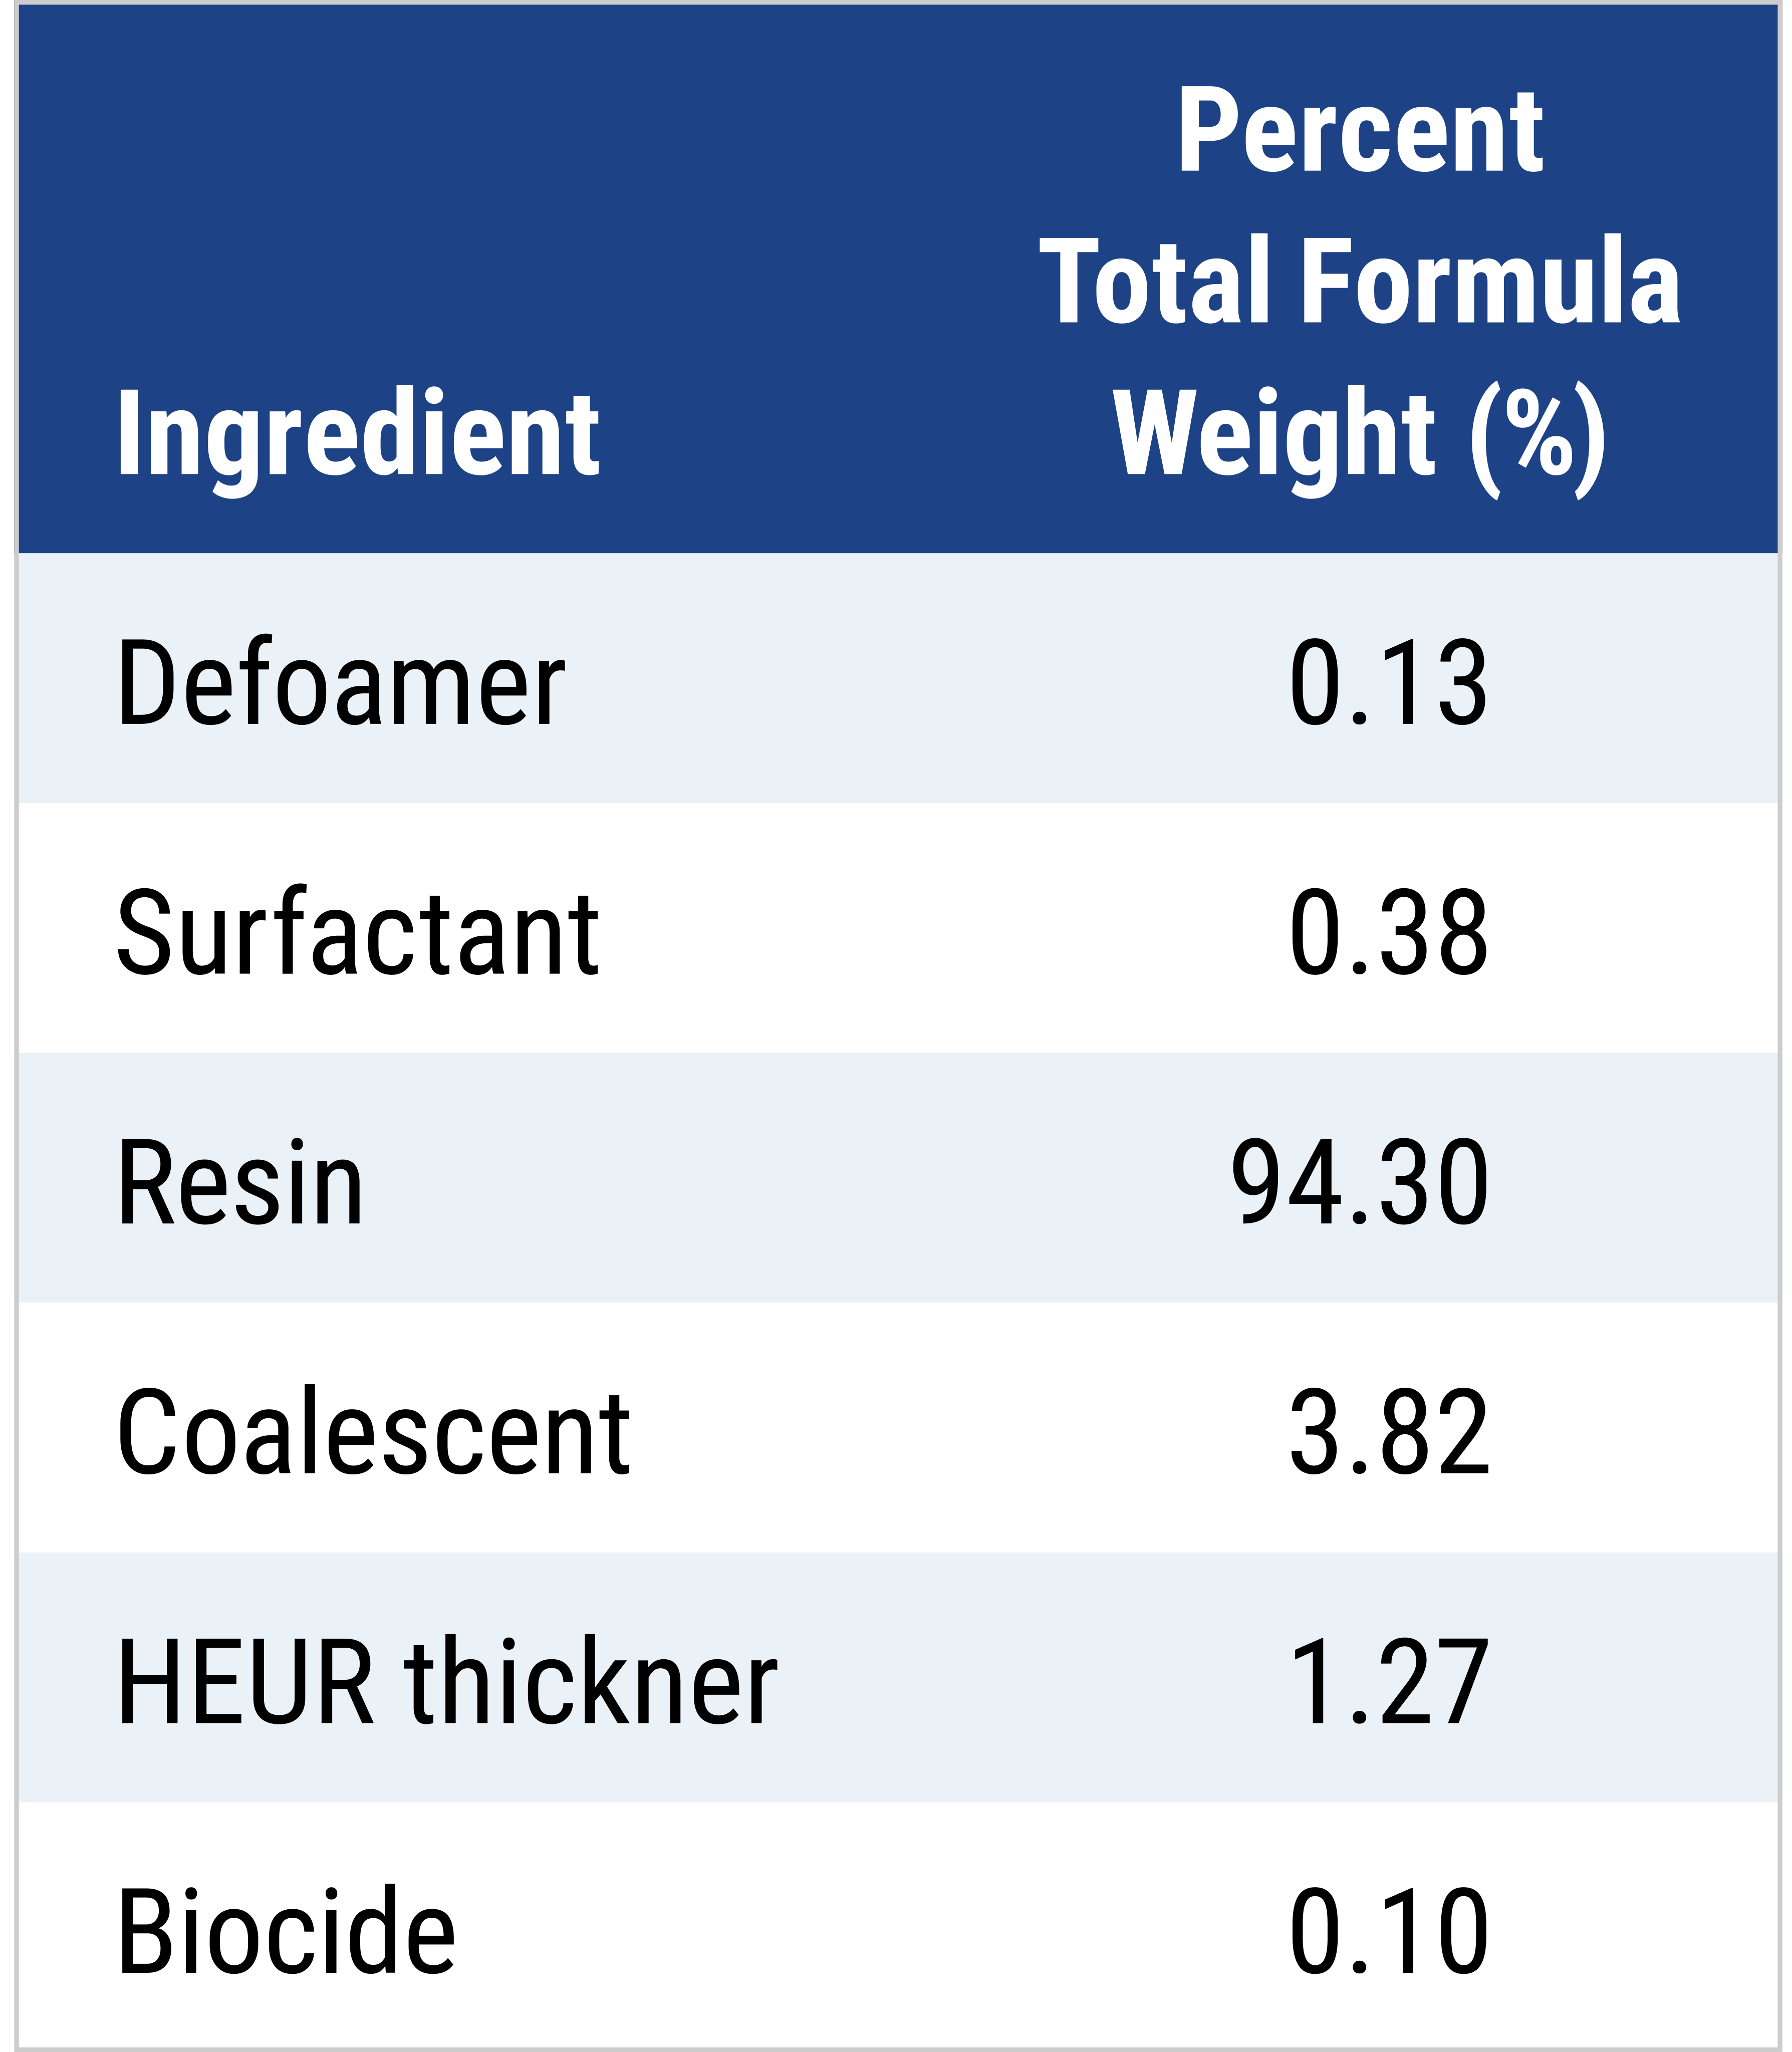
Two different formulations were prepared using these four resins. The first formula was made using approximately 95% resin of total formula weight and utilized a hydrophobically ethoxylated urethane (HEUR) thickener along with a defoamer, surfactant, coalescing agent and biocide (Table 2).
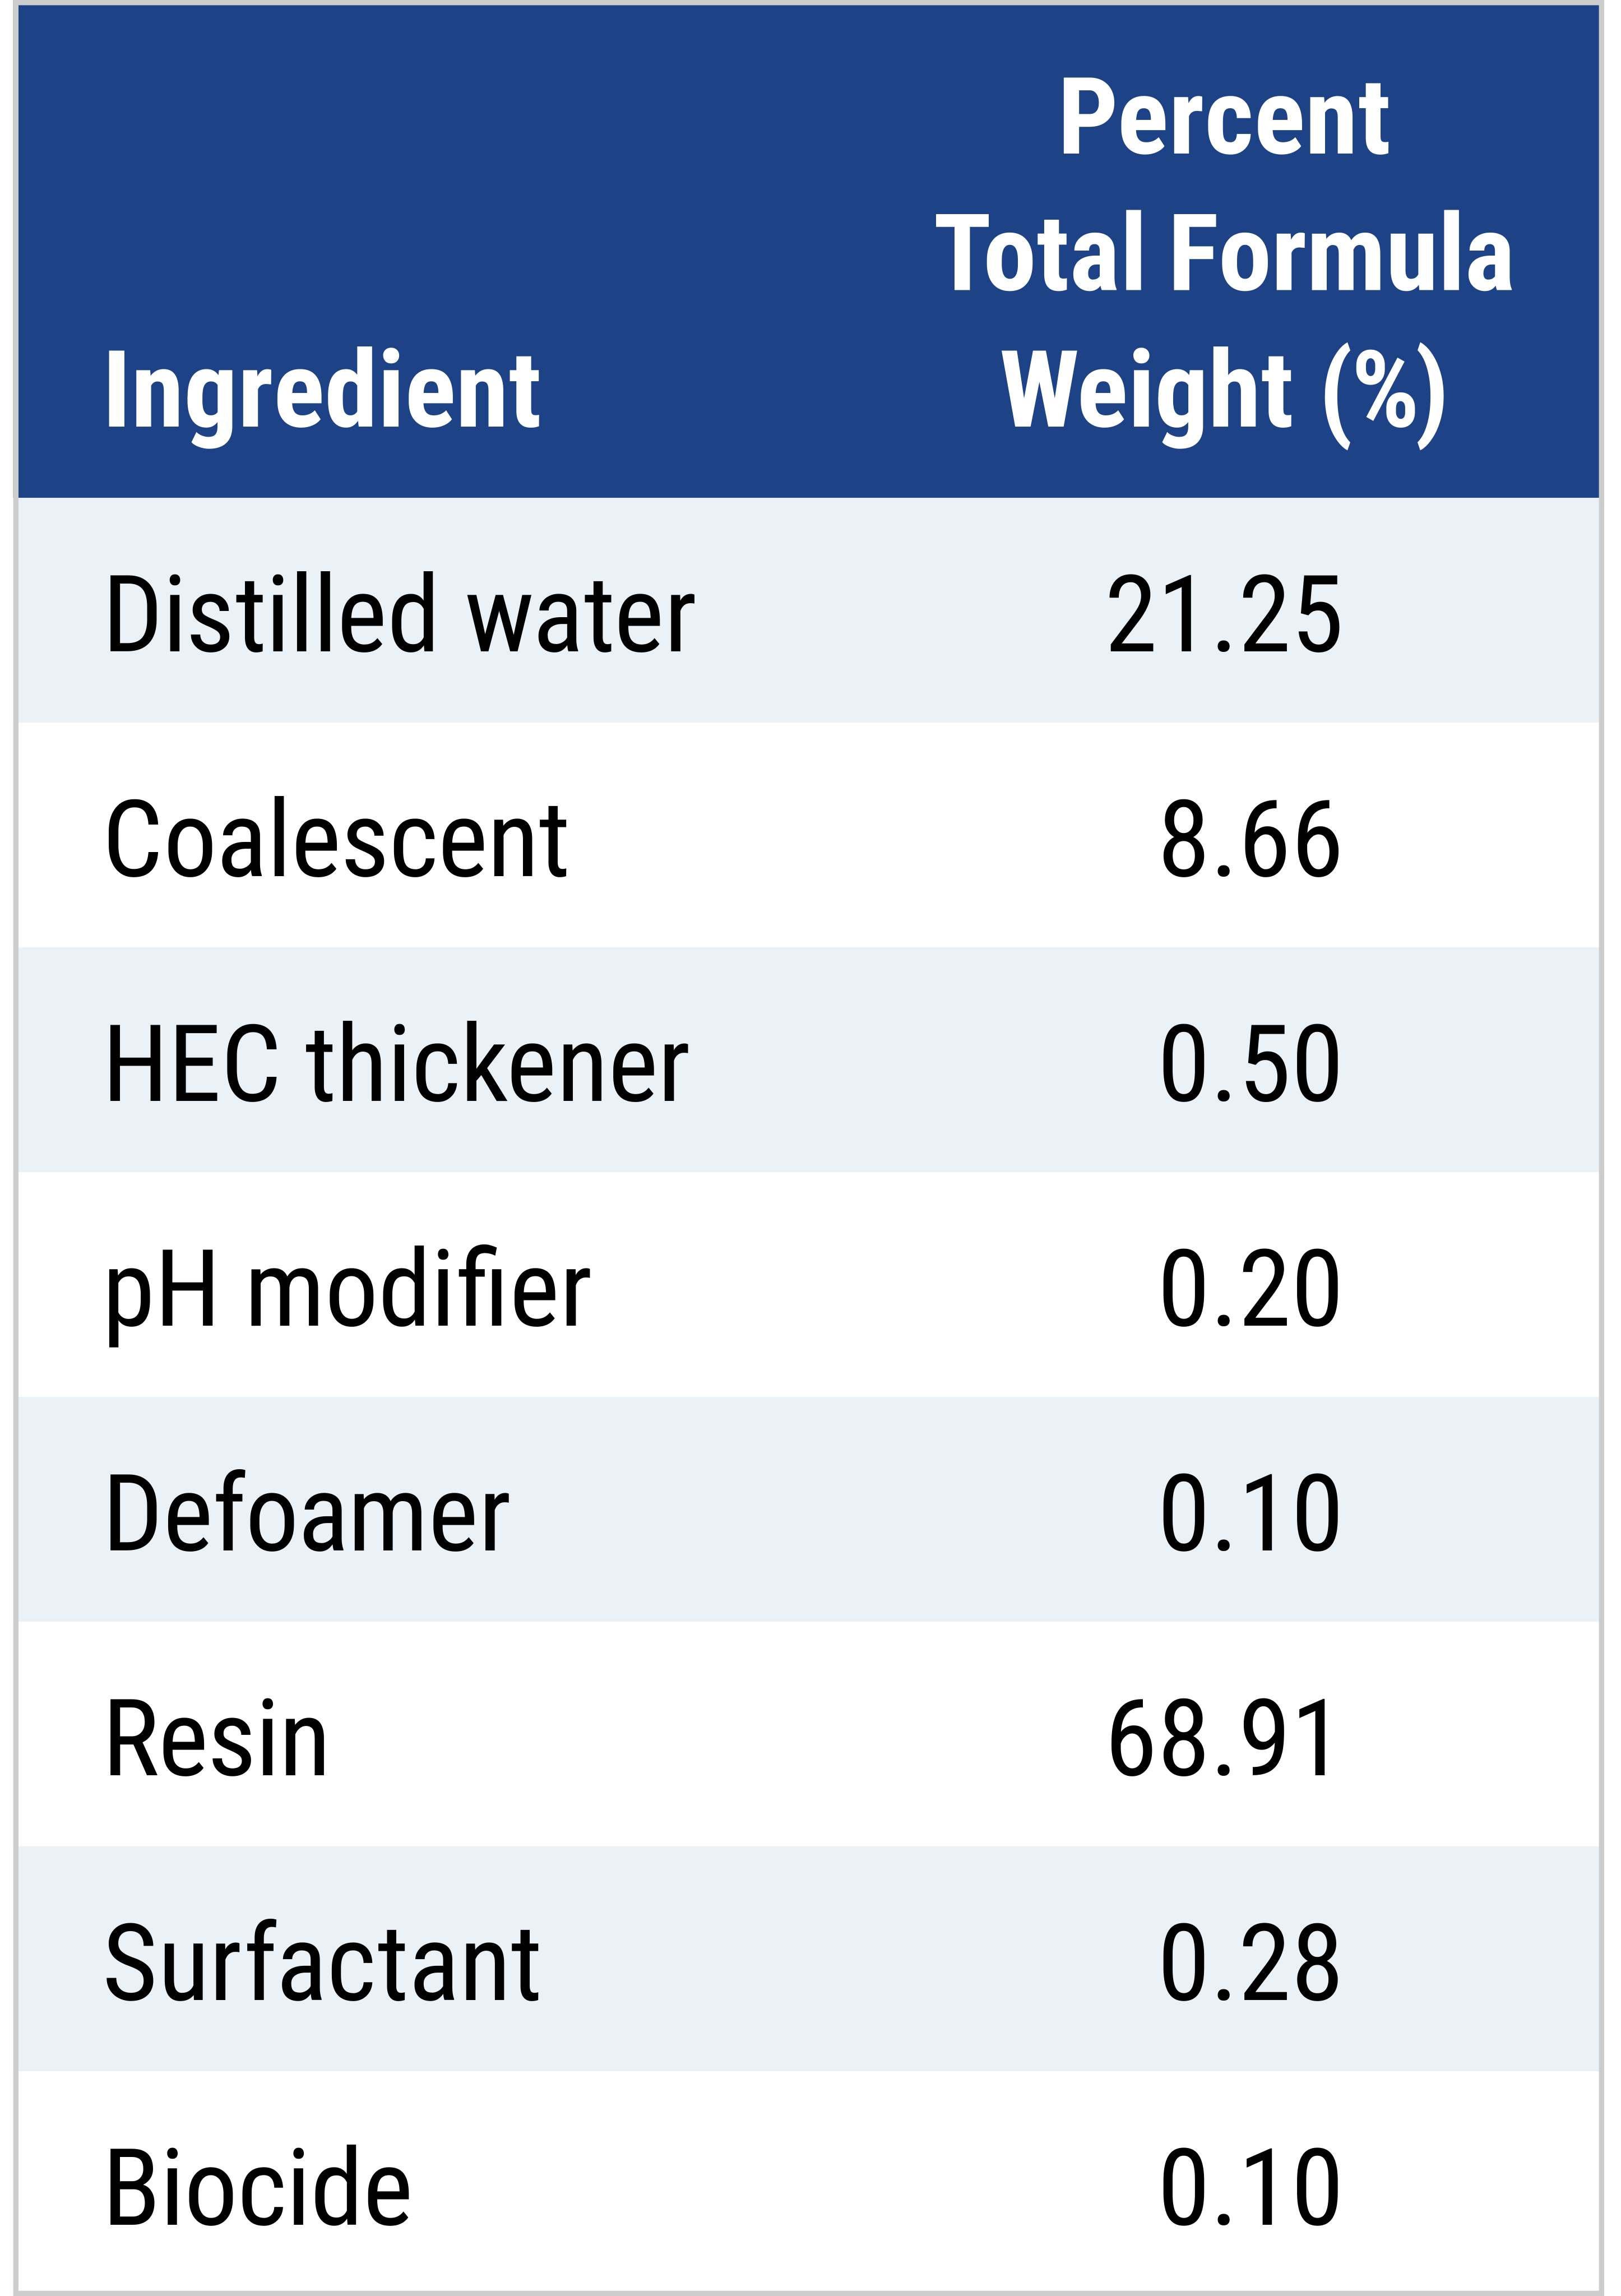
The second formula reduced the resin weight to 31–34% of the total formula weight, changed the thickener to hydroxyethyl cellulose (HEC), increased the coalescing agent concentration and added a pH modifier (Table 3).
The application performance of these two formulas was then tested. Aluminum Q-panels were used for this portion of the testing in accordance with AAMA for specular gloss (7.2), dry film hardness (7.3), dry film adhesion (7.4.1.1) to various substrates, gloss retention (7.9.1.4) and color retention (7.9.1.2) through simulated weathering (D). First, each panel was cleaned and coated with a white primer before application of the topcoat. The topcoat layer was then sprayed onto the primer and allowed to cure for 72 hours under ambient conditions. Formula 2 required a five-minute oven cure for the topcoat prior to testing.
The same procedure was followed for salt spray corrosion resistance testing (7.8.2), with the modification of using steel panels due to their higher oxidation affinity compared to aluminum. Only Formula 2 was used for this portion of testing, and each sample was applied to two panels.
Results
Accelerated Aging
The pH and viscosity were measured for each of the eight samples over the course of 10 weeks. All samples were held in an oven set to 50 °C and removed periodically for mixing and cooling to 77 °F prior to data collection. From Figures 1 (page 23), 2 and 3, it is shown that R1 in Formula 1, without a pH modifier, experienced the largest change in pH compared to the other resins. The point at which the pH for this sample decreased below 7 was accompanied by solidification of the sample after one week in the oven. The viscosity instability of R1 became evident during week six, when Formula 2 also experienced hardening and separation from solution.
Additionally, Figure 2 indicates some instability for R3 in Formula 1, but this behavior was not propagated in Formula 2, as the percent change in viscosity of the R3 formulation was consistent with the other samples according to Figure 3.
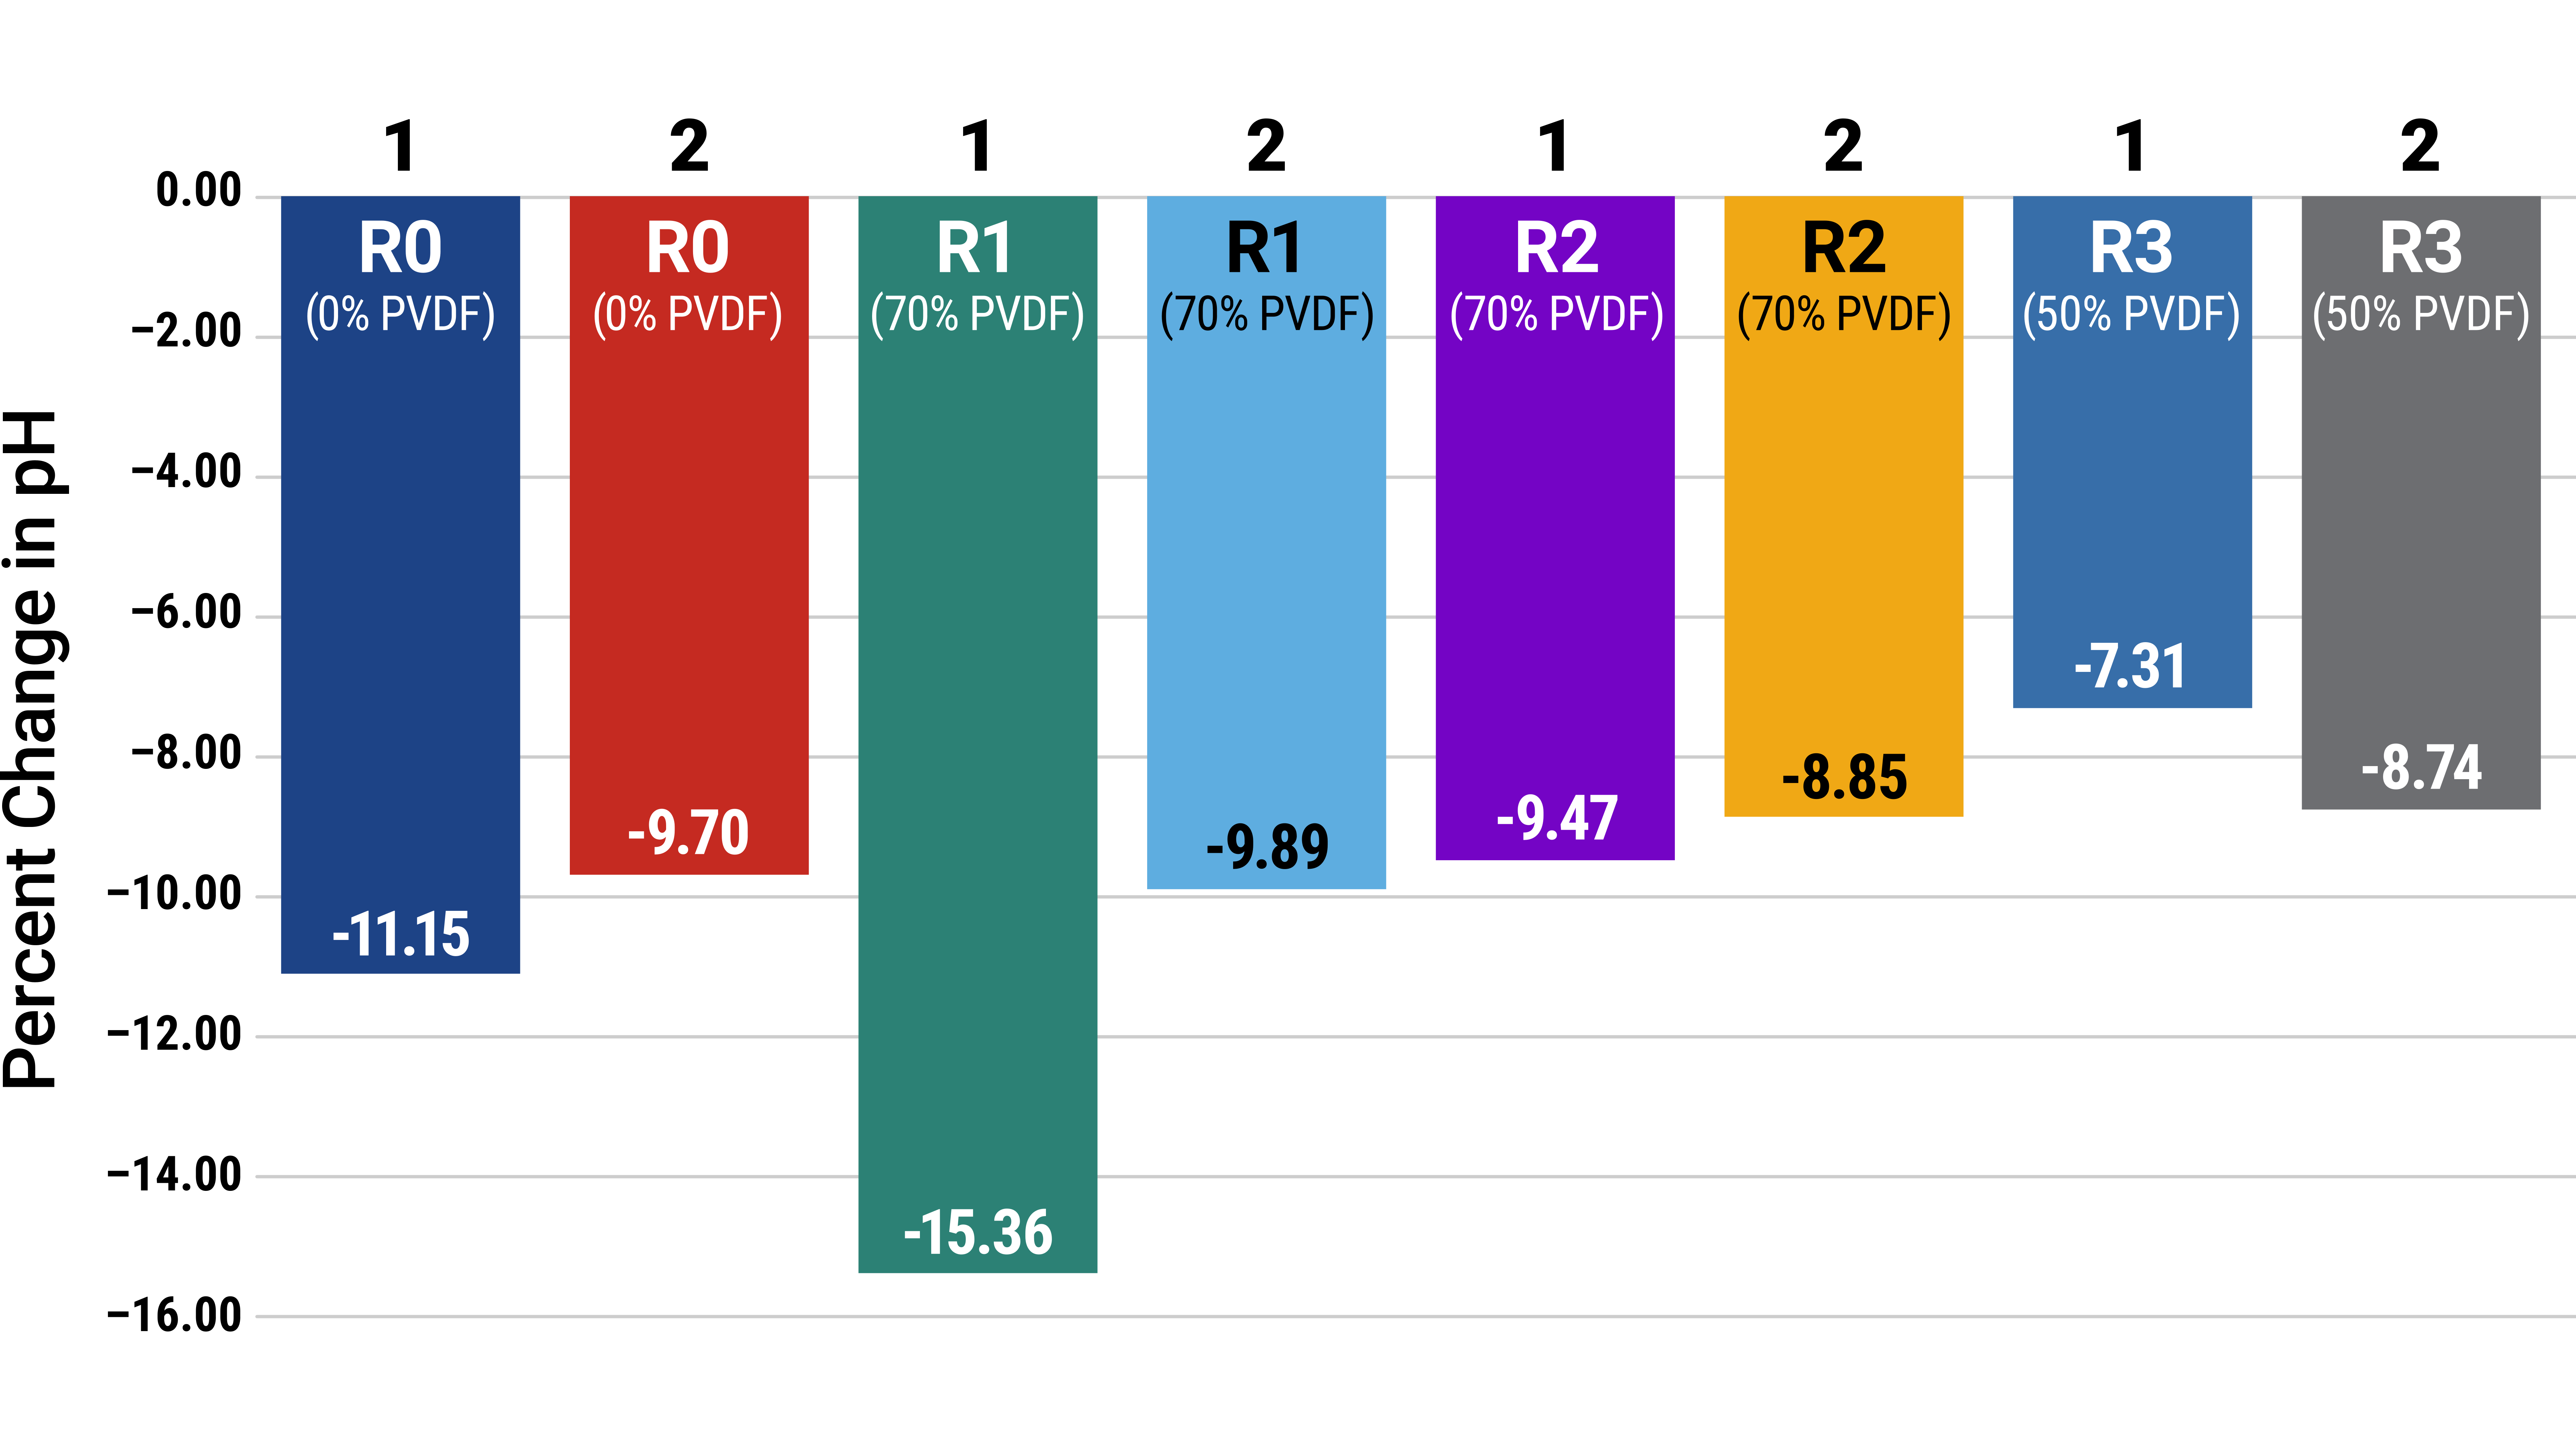
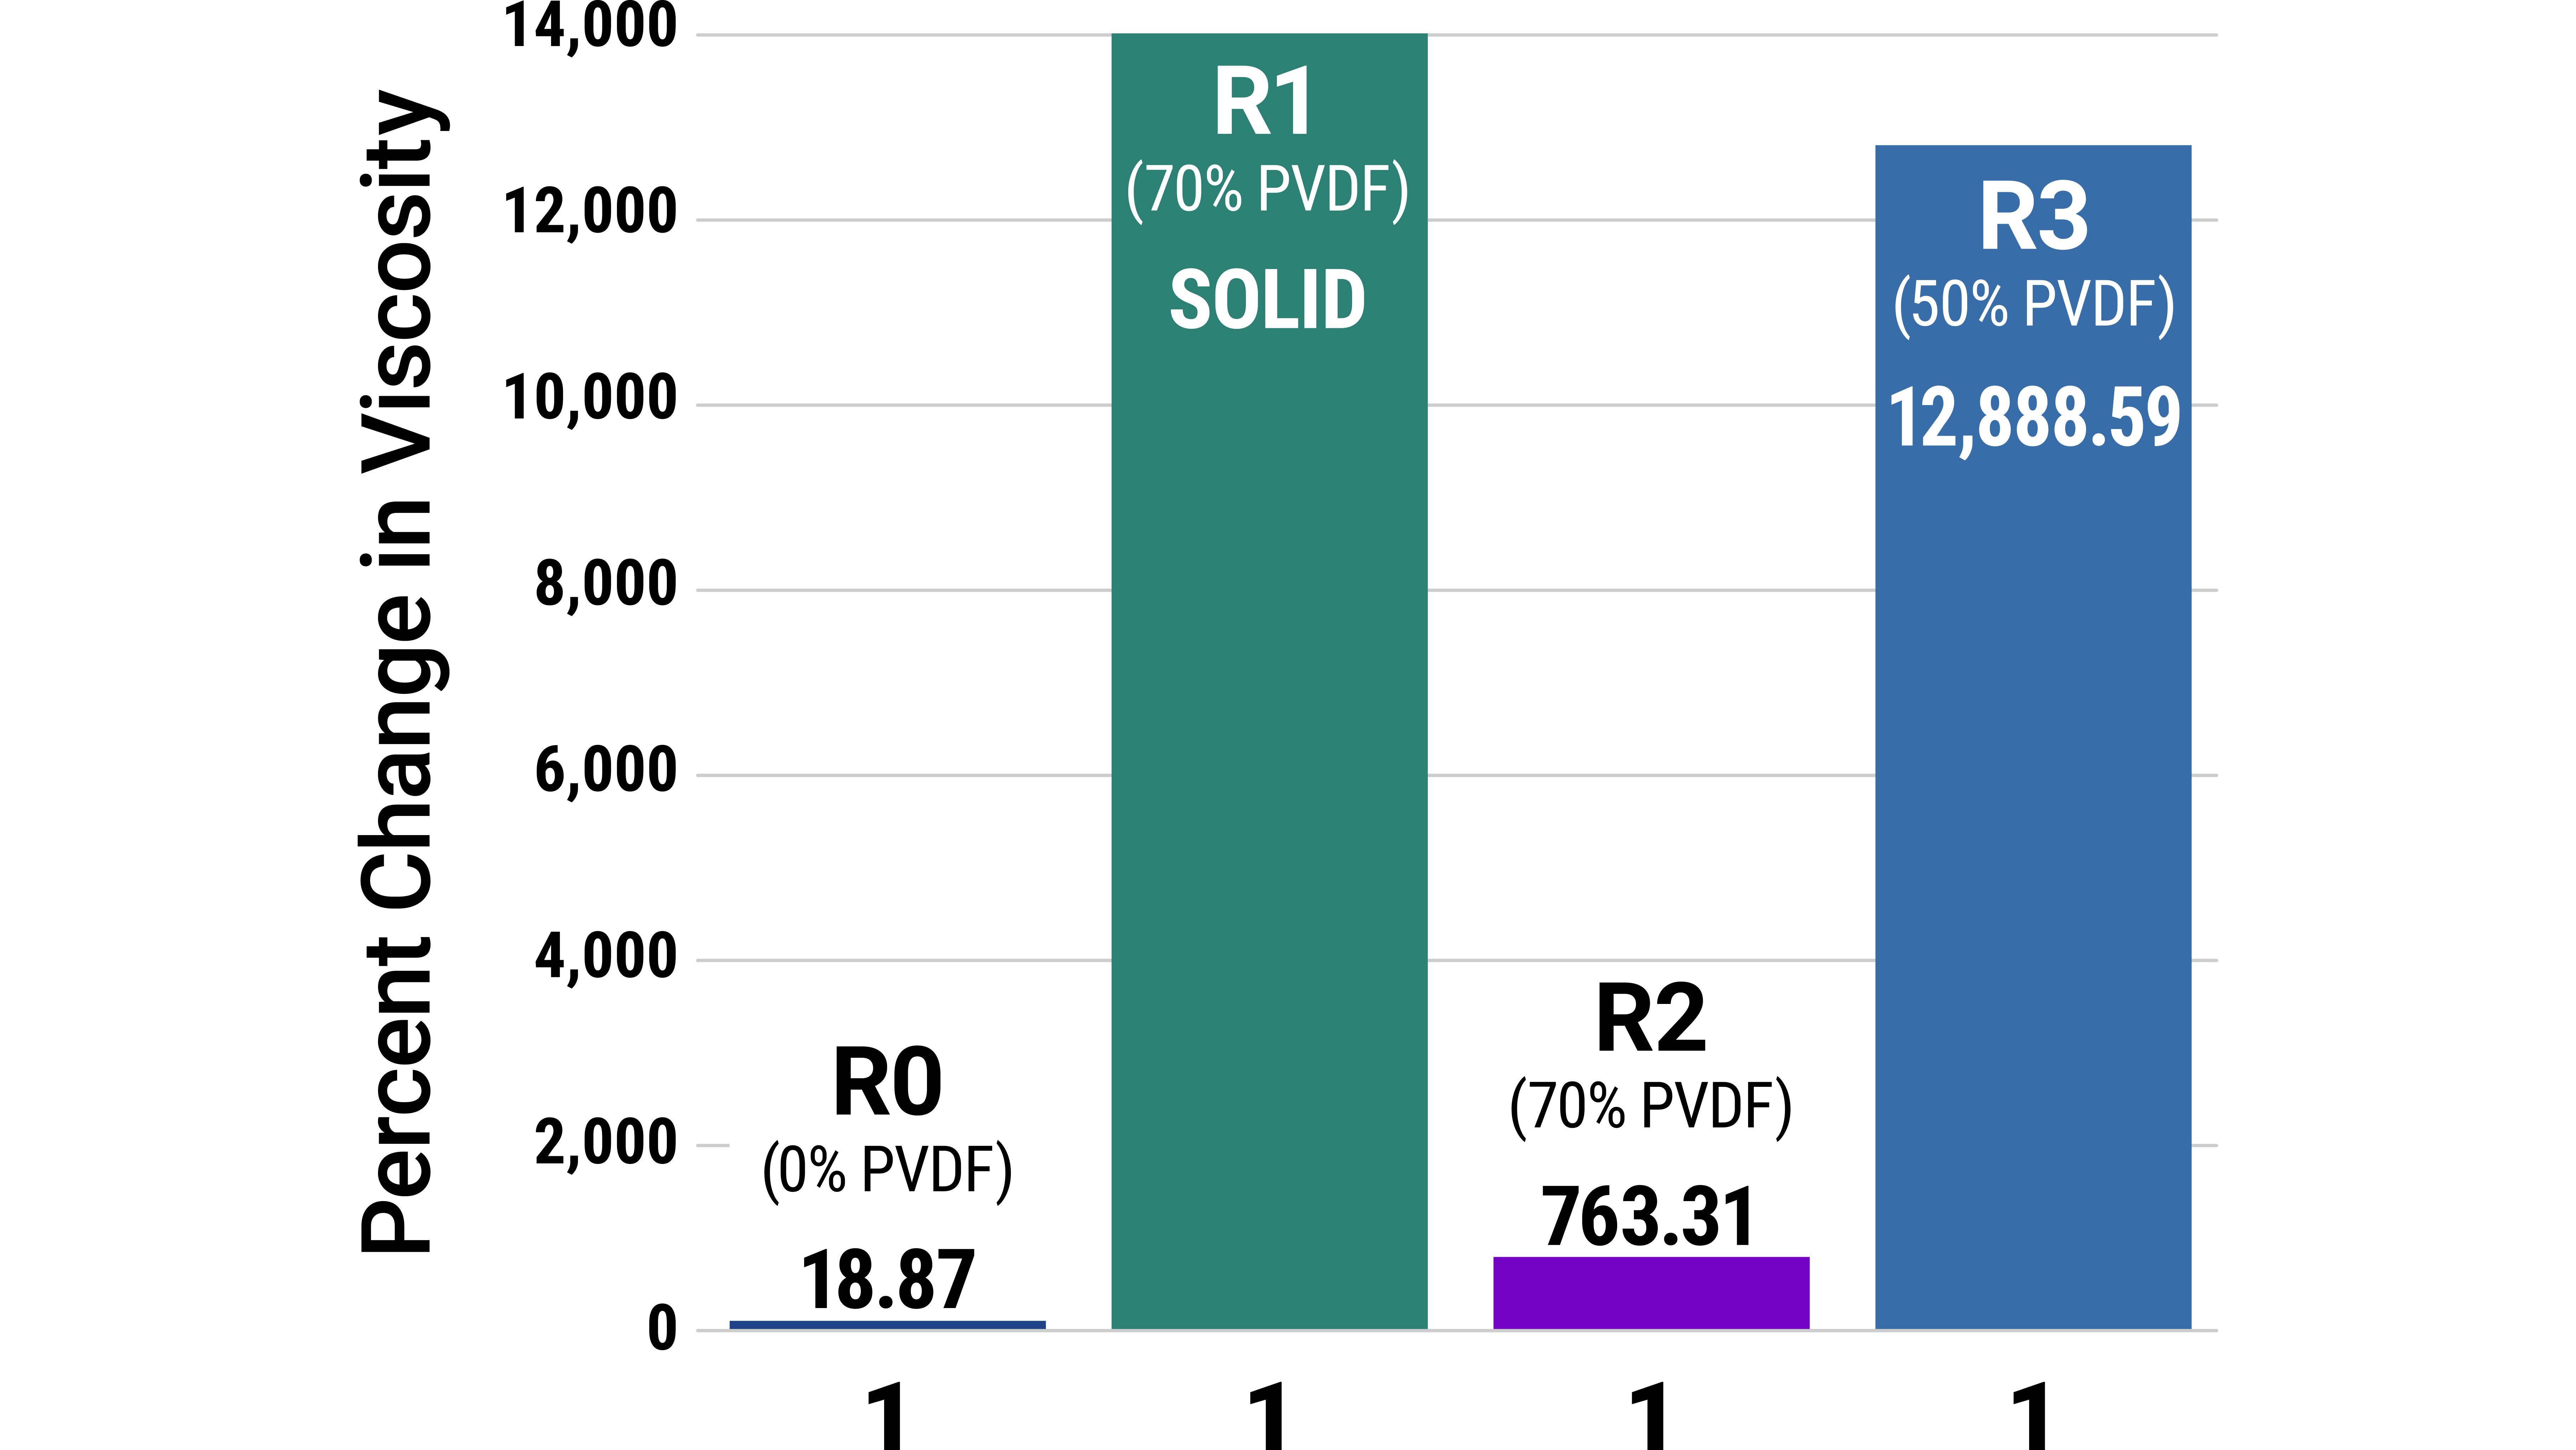
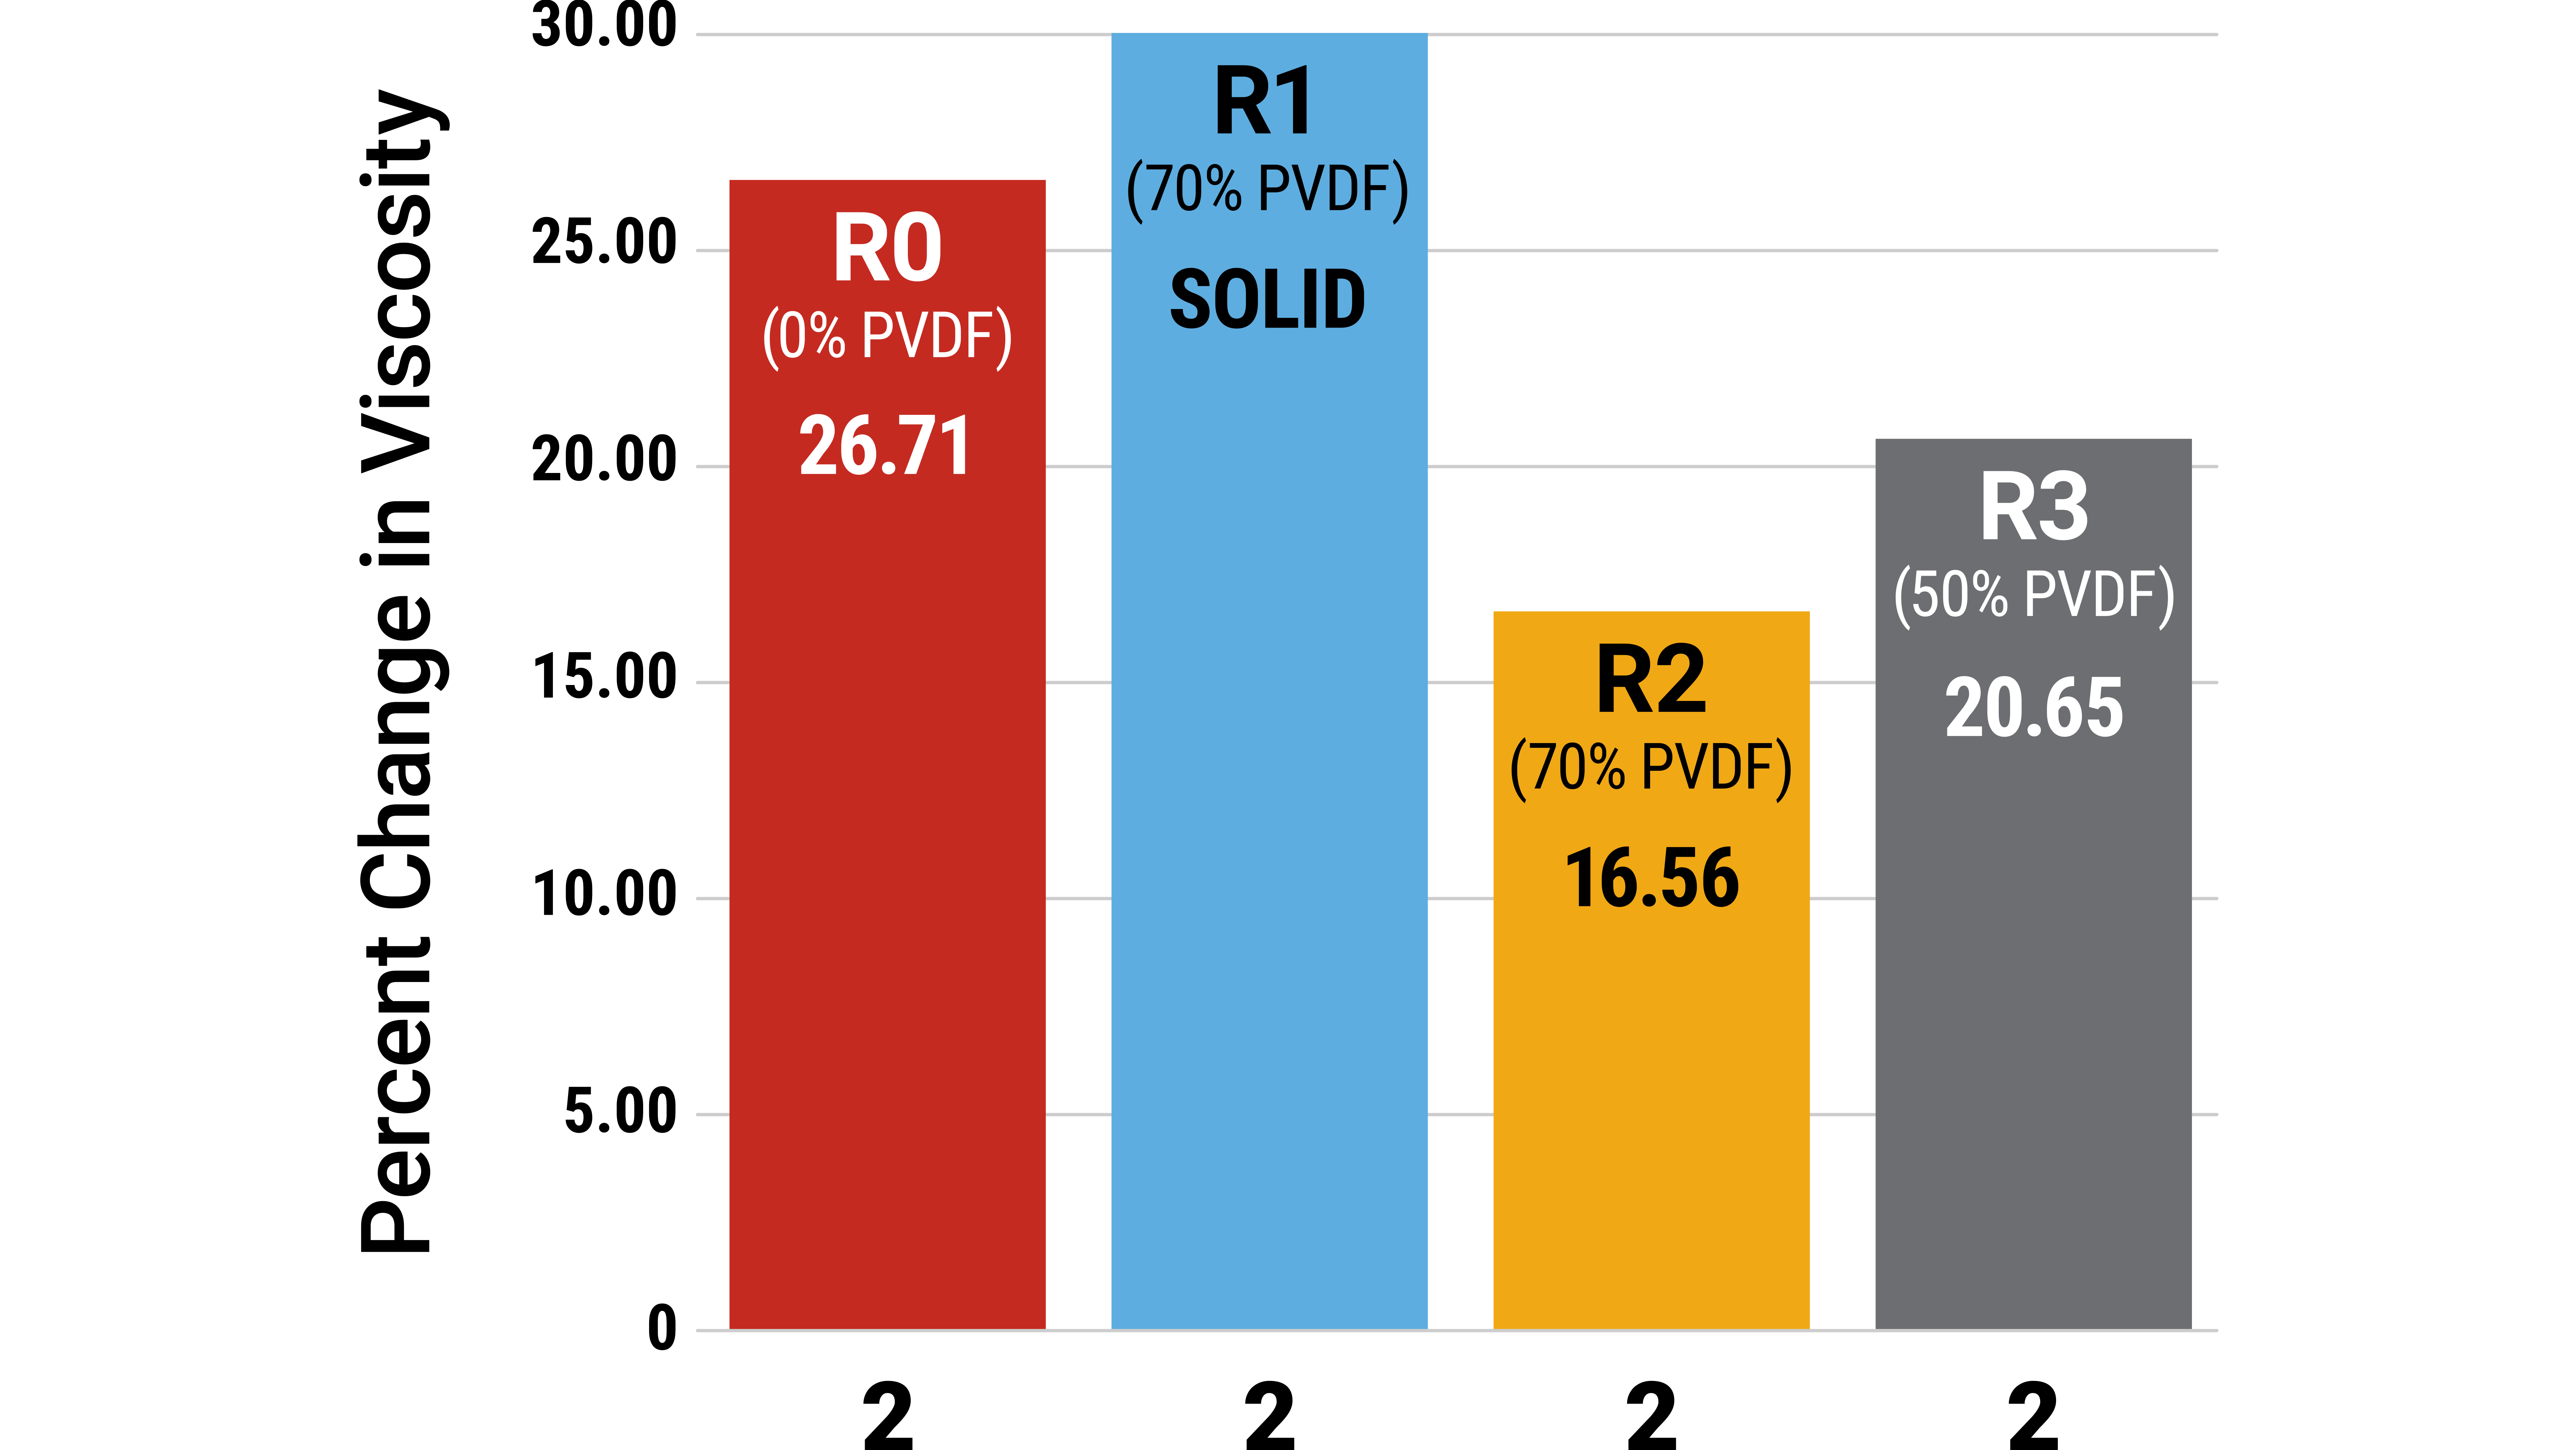
From this initial series of accelerated aging tests evaluating pH and viscosity stability over 10 weeks, R2 showed greater consistency between the two formulas used in this project and exhibited a lower percent change in viscosity compared to the other resins.
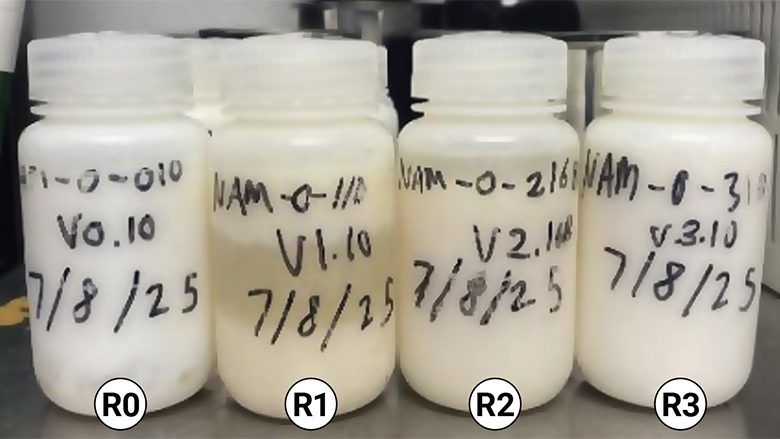
Qualitatively, Figure 4 shows yellowing of the R1 Formula 2 sample compared to the other samples. The syneresis observed in R1 was more pronounced than in the other formulations and was found to occur more frequently with the hydroxyethyl cellulose thickener.
Gloss and Color Retention (ASTM D 523 and ASTM D 2244)
Based on Figures 4 and 5, the only two resins that showed consistent results from the Q-SUN testing were the all-acrylic standard and R2. Both R1 and R3 completed their 2,000-hour cycles with ΔE values of 1.62 and 1.37, respectively. This represents a substantial difference compared to R0, R2 and the Q-panel that was coated only with the white primer and no topcoat. Further, the gloss of R1 was also greatly impacted and showed the largest change in gloss compared to the other resin formulas. This was primarily due to the low initial gloss value of 5.5, meaning that any change had a larger effect on the percent difference. Again, R2 demonstrated more consistent performance than the other resin formulas.
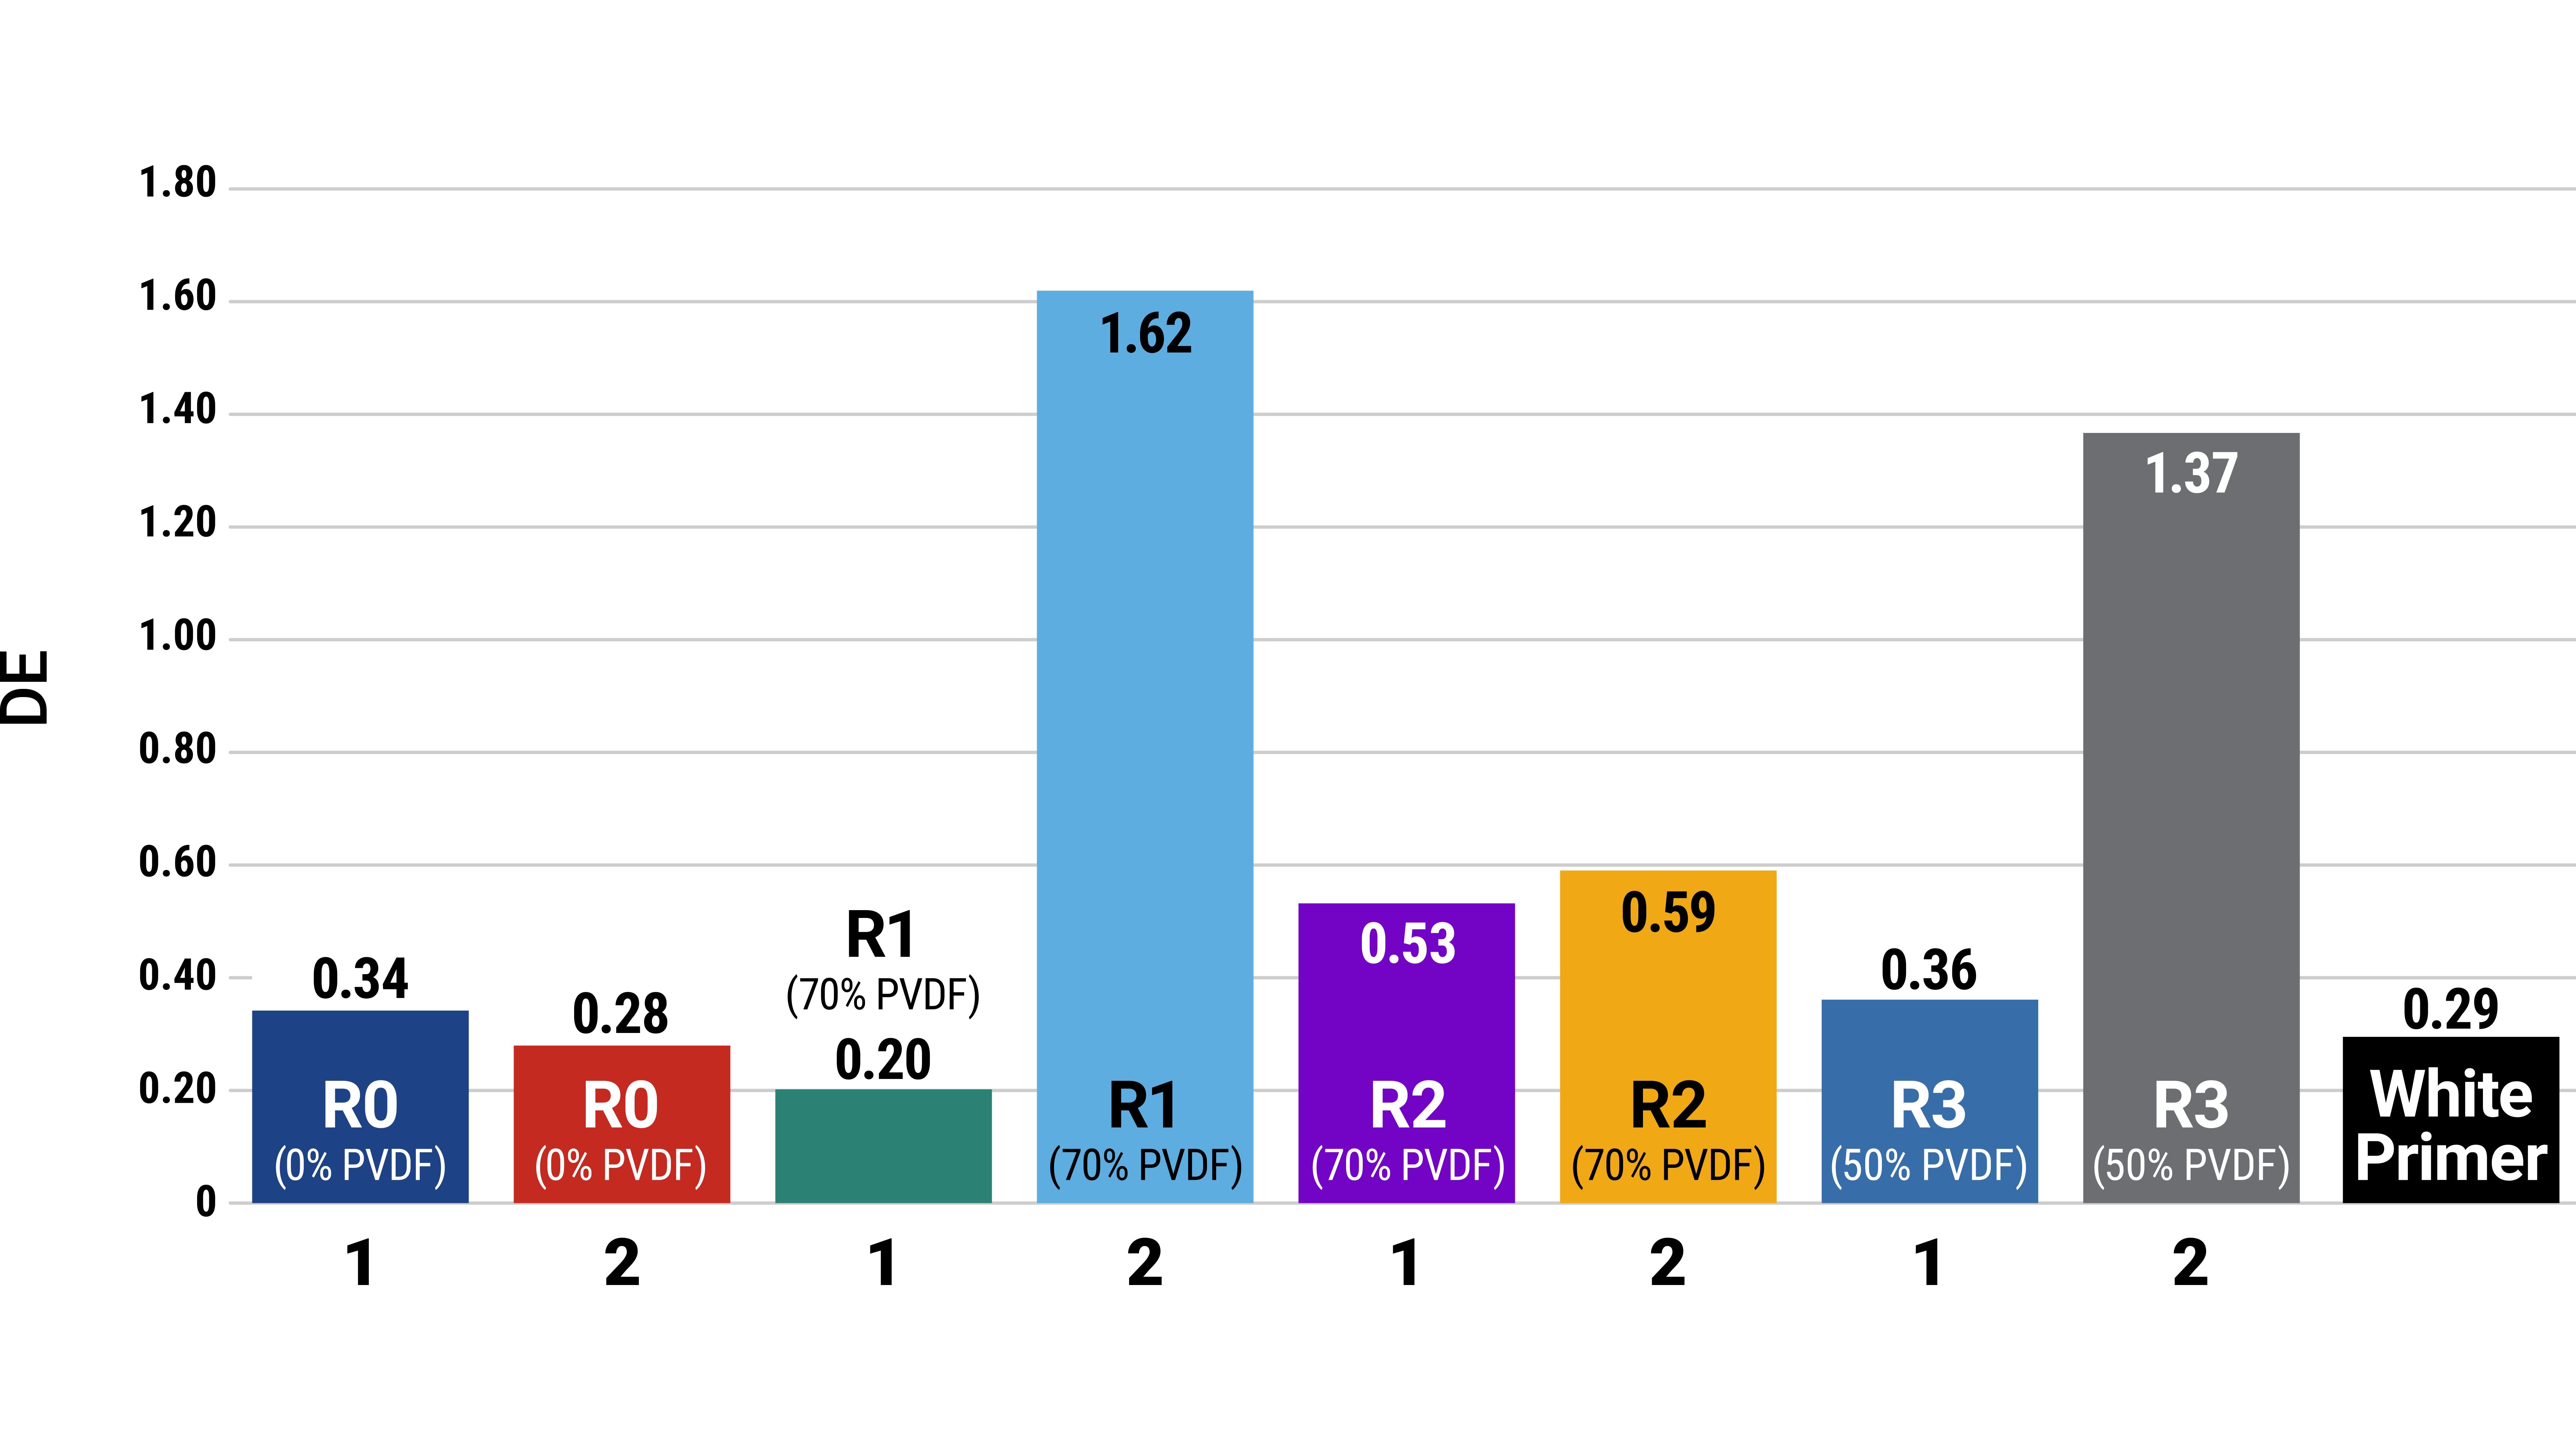
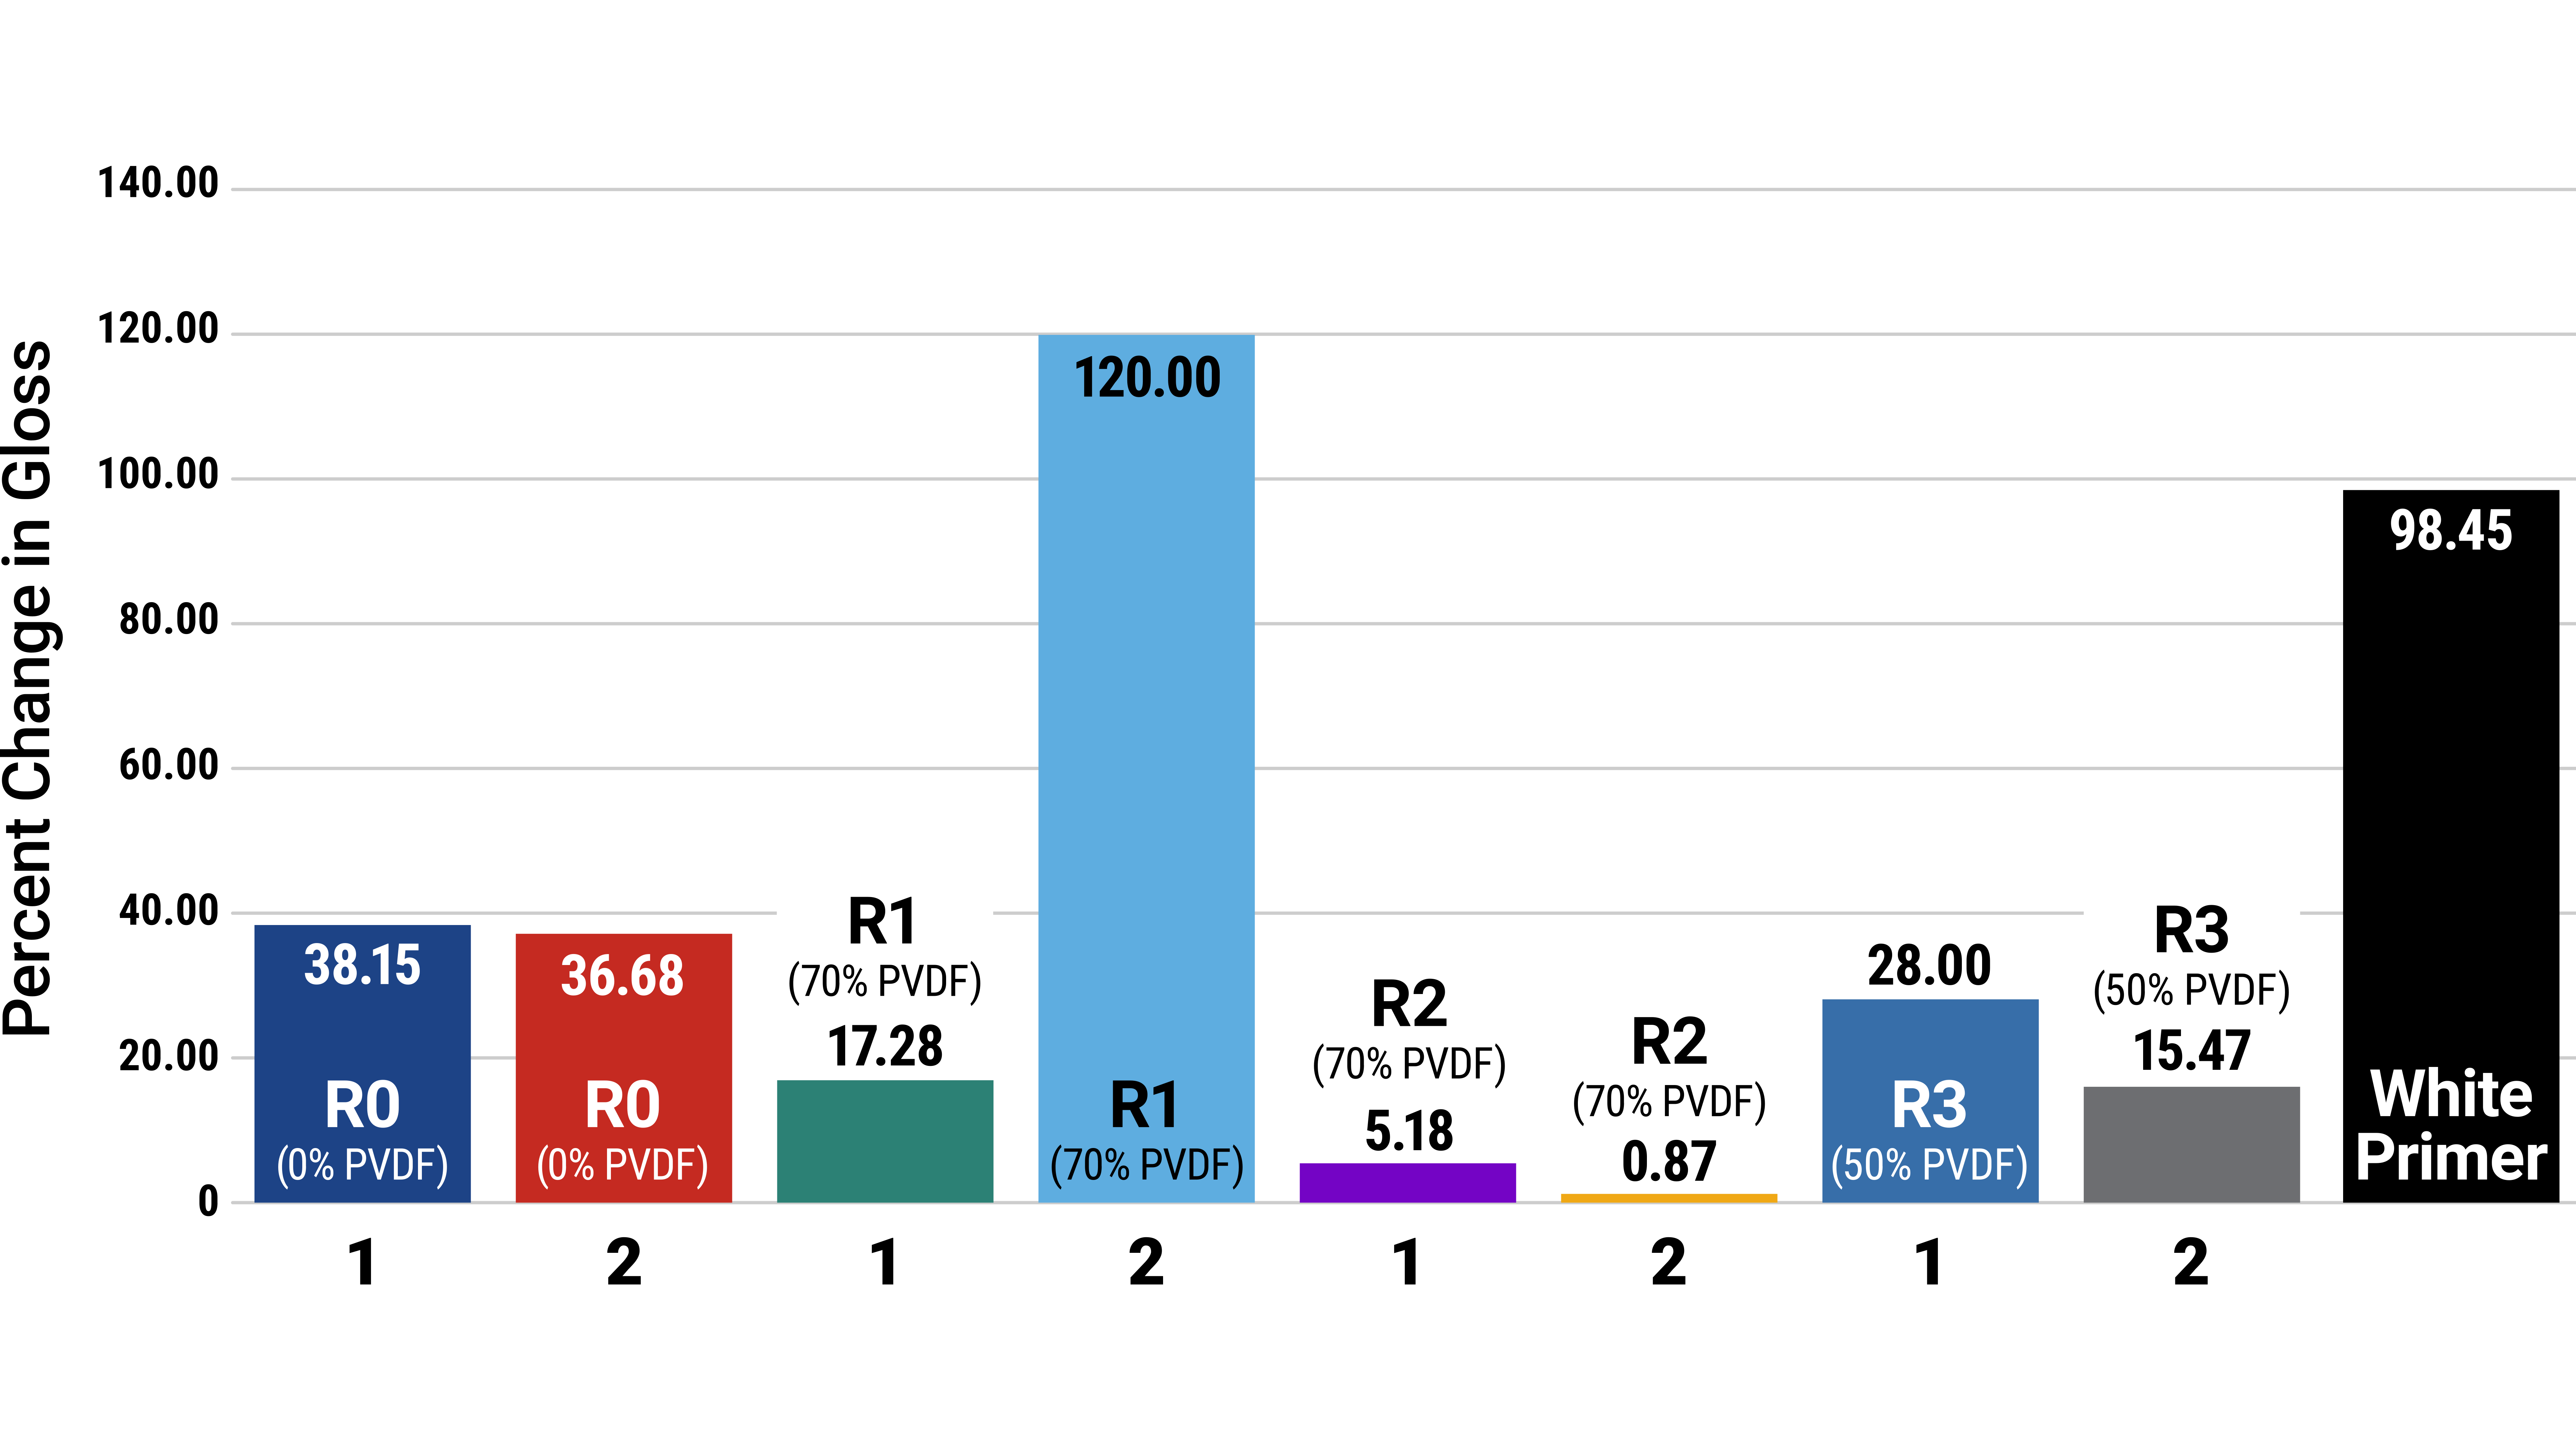
When evaluating the Q-SUN results, the consistency of R2 was observed across both formulas, as shown in Figure 4 (page 25). Preliminary results favored R1 during week five, as ΔE values of 0.14 and 0.11 were measured for Formulas 1 and 2, respectively. However, over the final five weeks, the Formula 2 results for R1 increased substantially compared to R0 and R2, ending with a ΔE of 1.62. This increase for Formula 2 of R1 was also mirrored by Formula 2 of R3, which ended with a ΔE of 1.37. This behavior could indicate that the performance of R1 and R3 decreases significantly at lower formulation concentrations compared to R2.
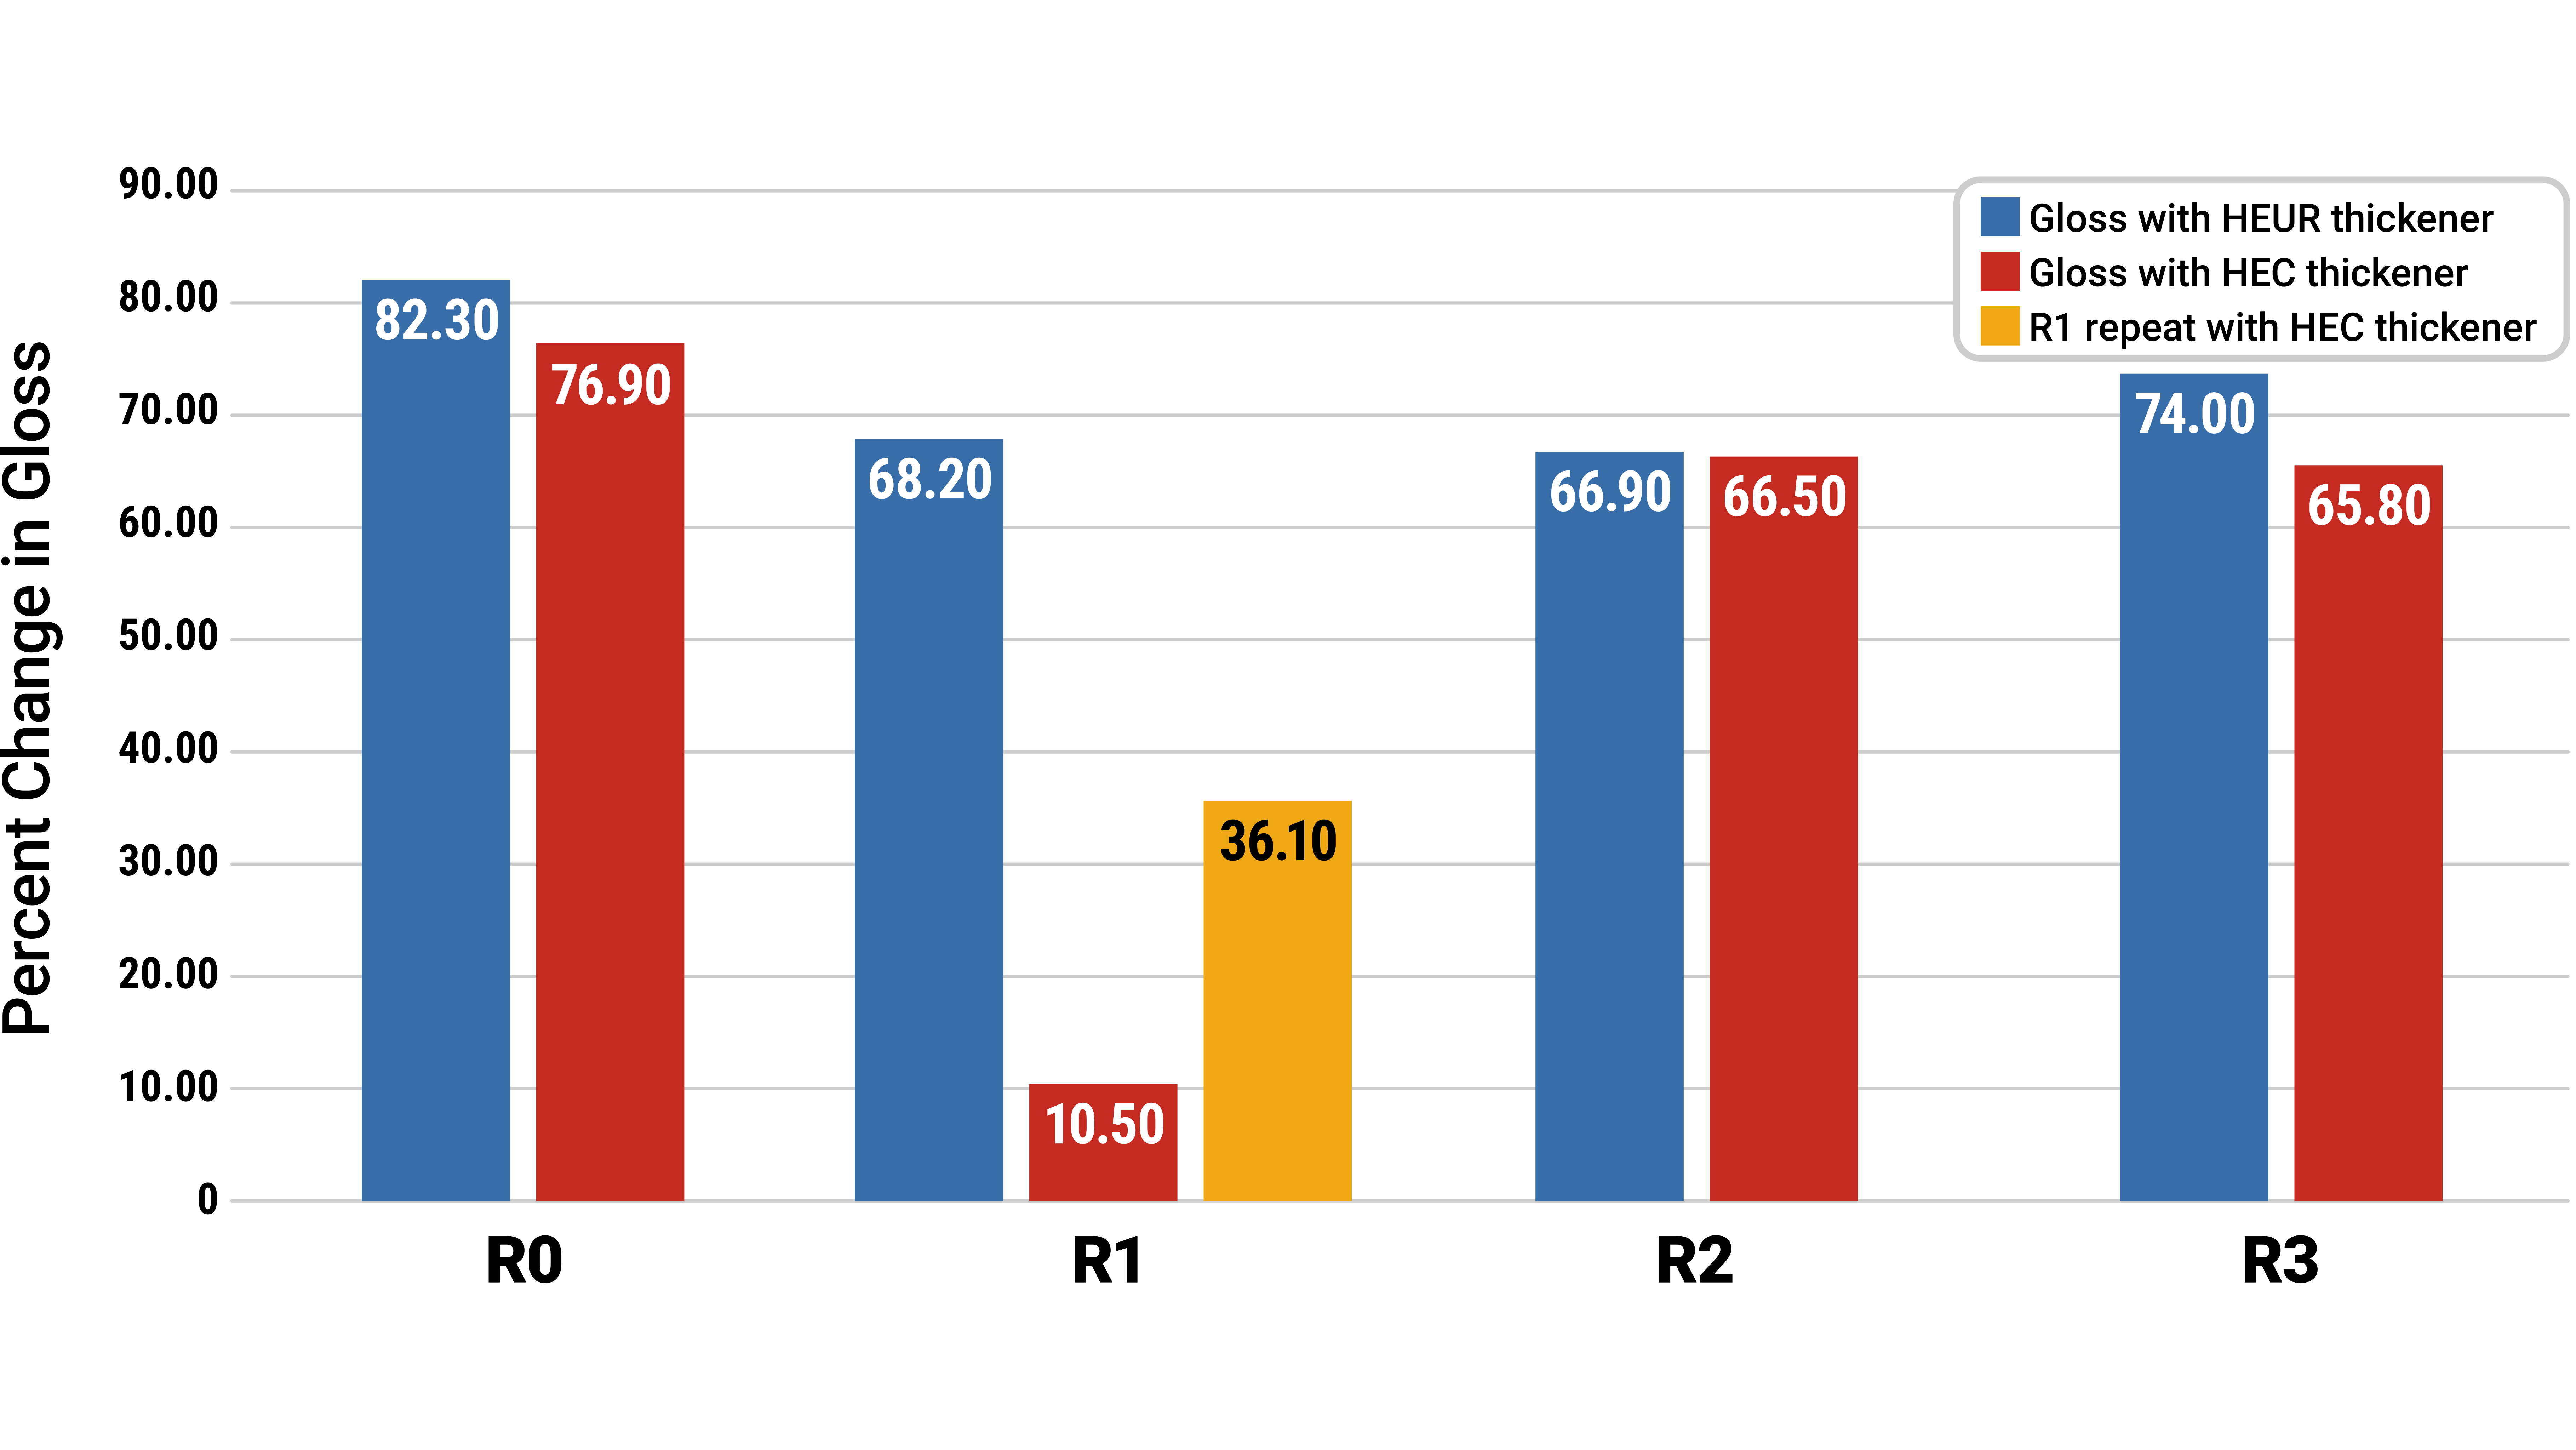
Another observation regarding gloss for R1 is that when paired with the two hydroxyethyl cellulose thickeners evaluated in this project, both produced low gloss readings in the 5–10 range. During the later stages of the project, a different production batch of R1 was received and tested for this same effect. The results are shown in Figure 7.
Salt Spray Resistance (ASTM D 1654) and Degree of Blistering (ASTM D 714-02)
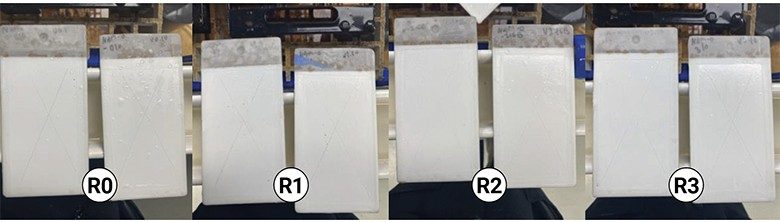
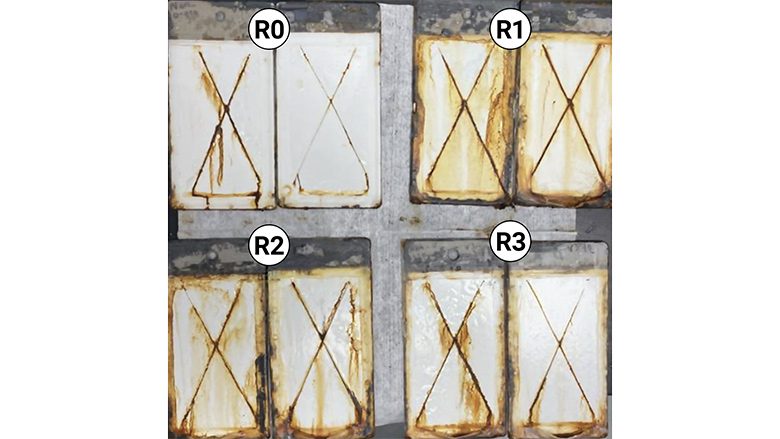
The results of the eight samples from the salt spray resistance testing are displayed in Figure 7 after approximately 2,100 hours of salt fog exposure. The numerical results are shown in Table 4. Through the ASTM D 714-02 test, blistering of each sample was evaluated in addition to creep from the scribe, as the samples were approximately halfway through the 4,000-hour cycle.
The percent blister failure was evaluated using a ¼-inch grid system based on the exposed area to measure how many squares within the grid blistered. Size and frequency were determined based on the references provided in ASTM D 714-02. Size was determined on a scale of 0–10, with 10 indicating a sample with no blisters. Frequency was categorized into four options of increasing density: few (F), medium (M), medium-dense (MD) and dense (D).
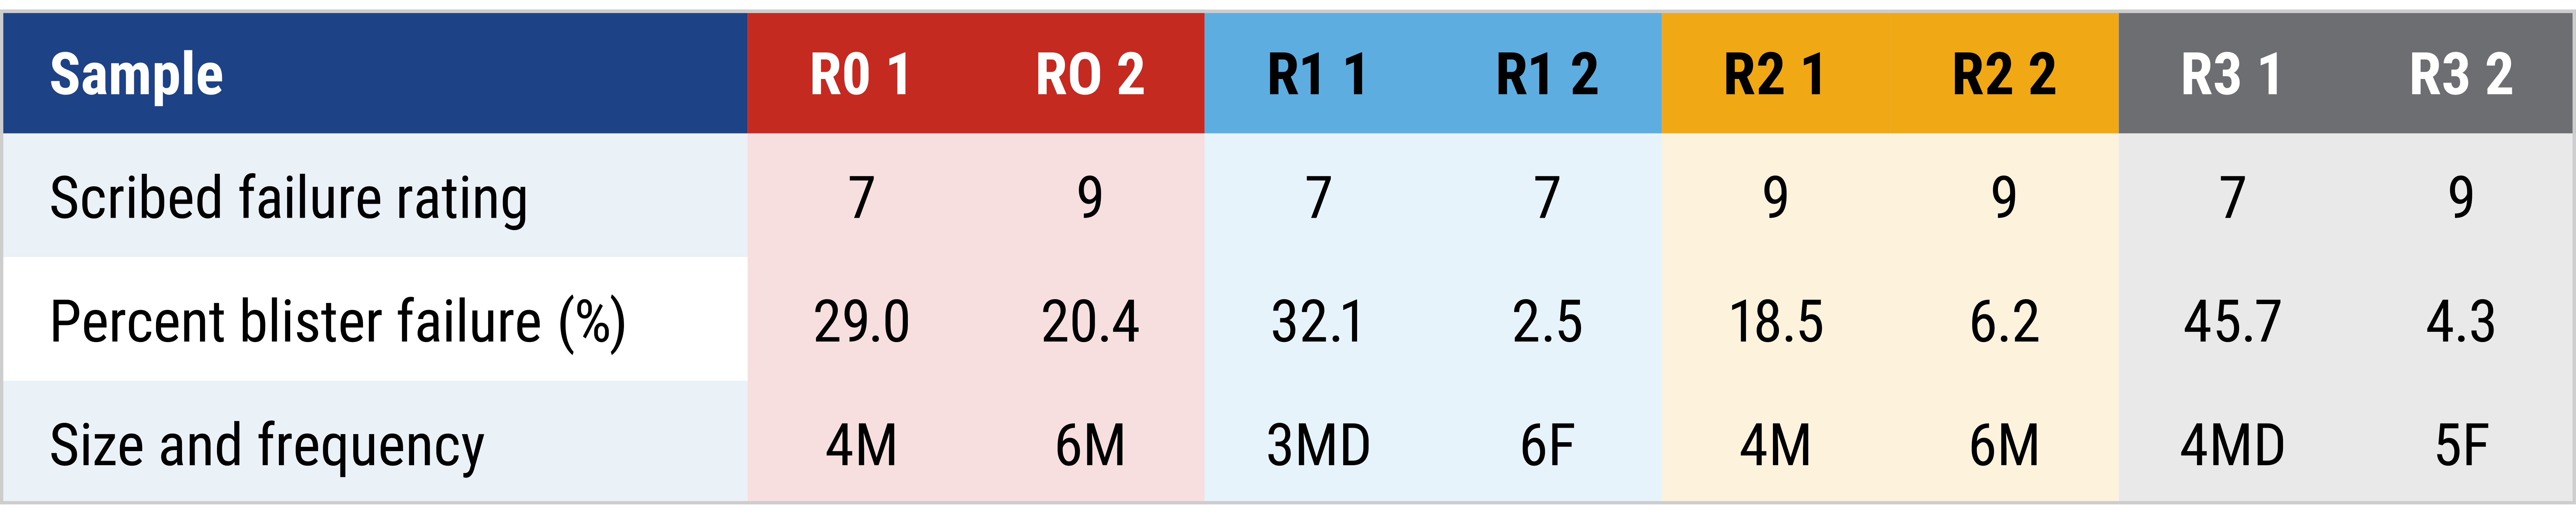
From Table 4, the R2 formula shows slightly better corrosion resistance when comparing the first set of resin samples, as it exhibits both a lower blistering percentage and lower failure in the scribe test.
Dry Film Hardness (ASTM D 3363)
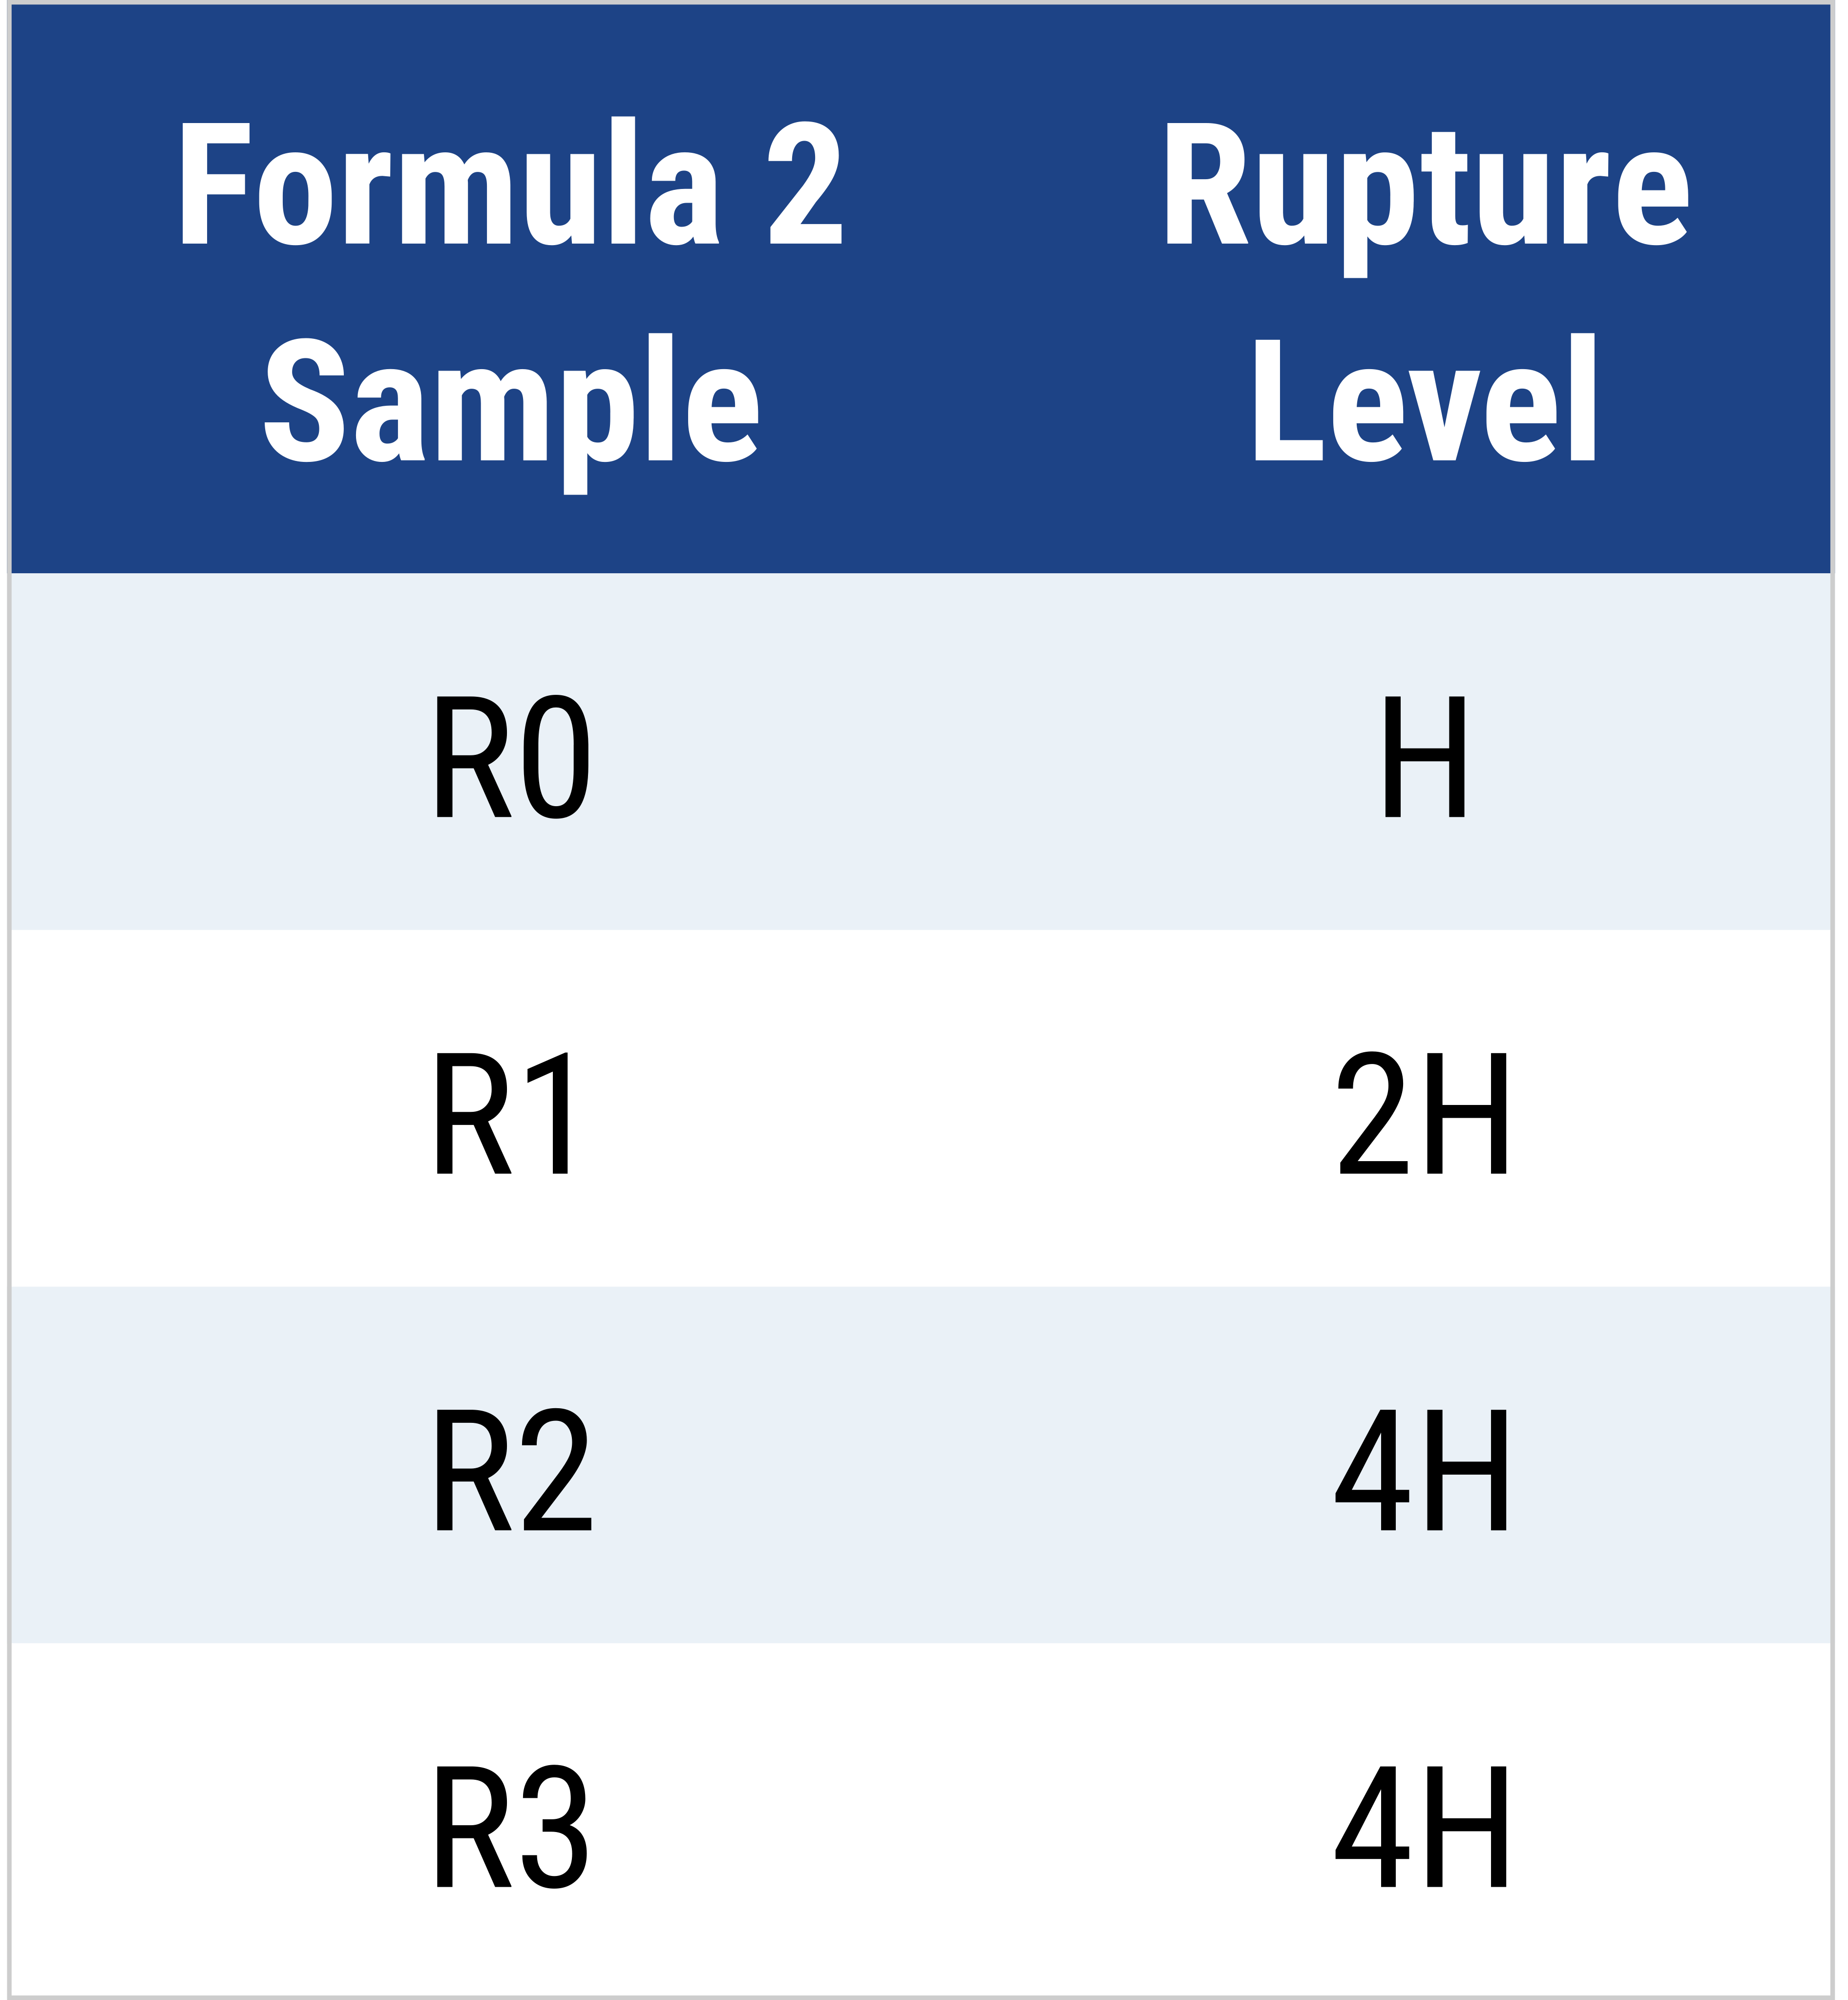
The dry film hardness of the four samples from Formula 2 was evaluated. This test showed that the samples containing R0 and R1 exhibited coating rupture with pencil leads of lower hardness compared to R2 and R3, which ruptured at the 4H lead level. The results are recorded in Table 5.
Substrate Adhesion (AAMA 7.4.1.1)
The substrates used for dry film adhesion testing were white primer, aluminum, steel and plastic. For the primer adhesion samples, all formulations showed 0% failure. This result differed significantly from the direct-to-metal applications on aluminum, steel and plastic. Each plastic adhesion sample was heat treated to improve wetting and adhesion.
All aluminum applications experienced 100% failure, and nearly all steel and plastic samples did as well. R1 Formula 2 performed better according to the dry adhesion test guidelines for steel and heat-treated plastic, with failure ratings of 0% and 4%, respectively.
Chemical Resistance and Crosslinking Effect
Another testing method used for these resins evaluated chemical resistance against three solvents: isopropyl alcohol, acetone and methyl ethyl ketone (MEK). The Formula 2 coatings were applied using a 30-drawdown bar and cured in a 150 °C oven for five minutes. Each solvent was applied to a cloth and rubbed 50 times over the coating to determine the final result.
Additionally, each formula sample was treated with a Part B carbodiimide crosslinking additive to observe its effect on chemical resistance. Part B was added at 2.5% of the total formula weight. Only R0 and R3 showed improvements in chemical resistance following crosslinking. Overall, R3 exhibited the poorest chemical resistance, while R1 showed slightly improved resistance, with partial resistance to acetone. These results are summarized in Table 6 (page 27).
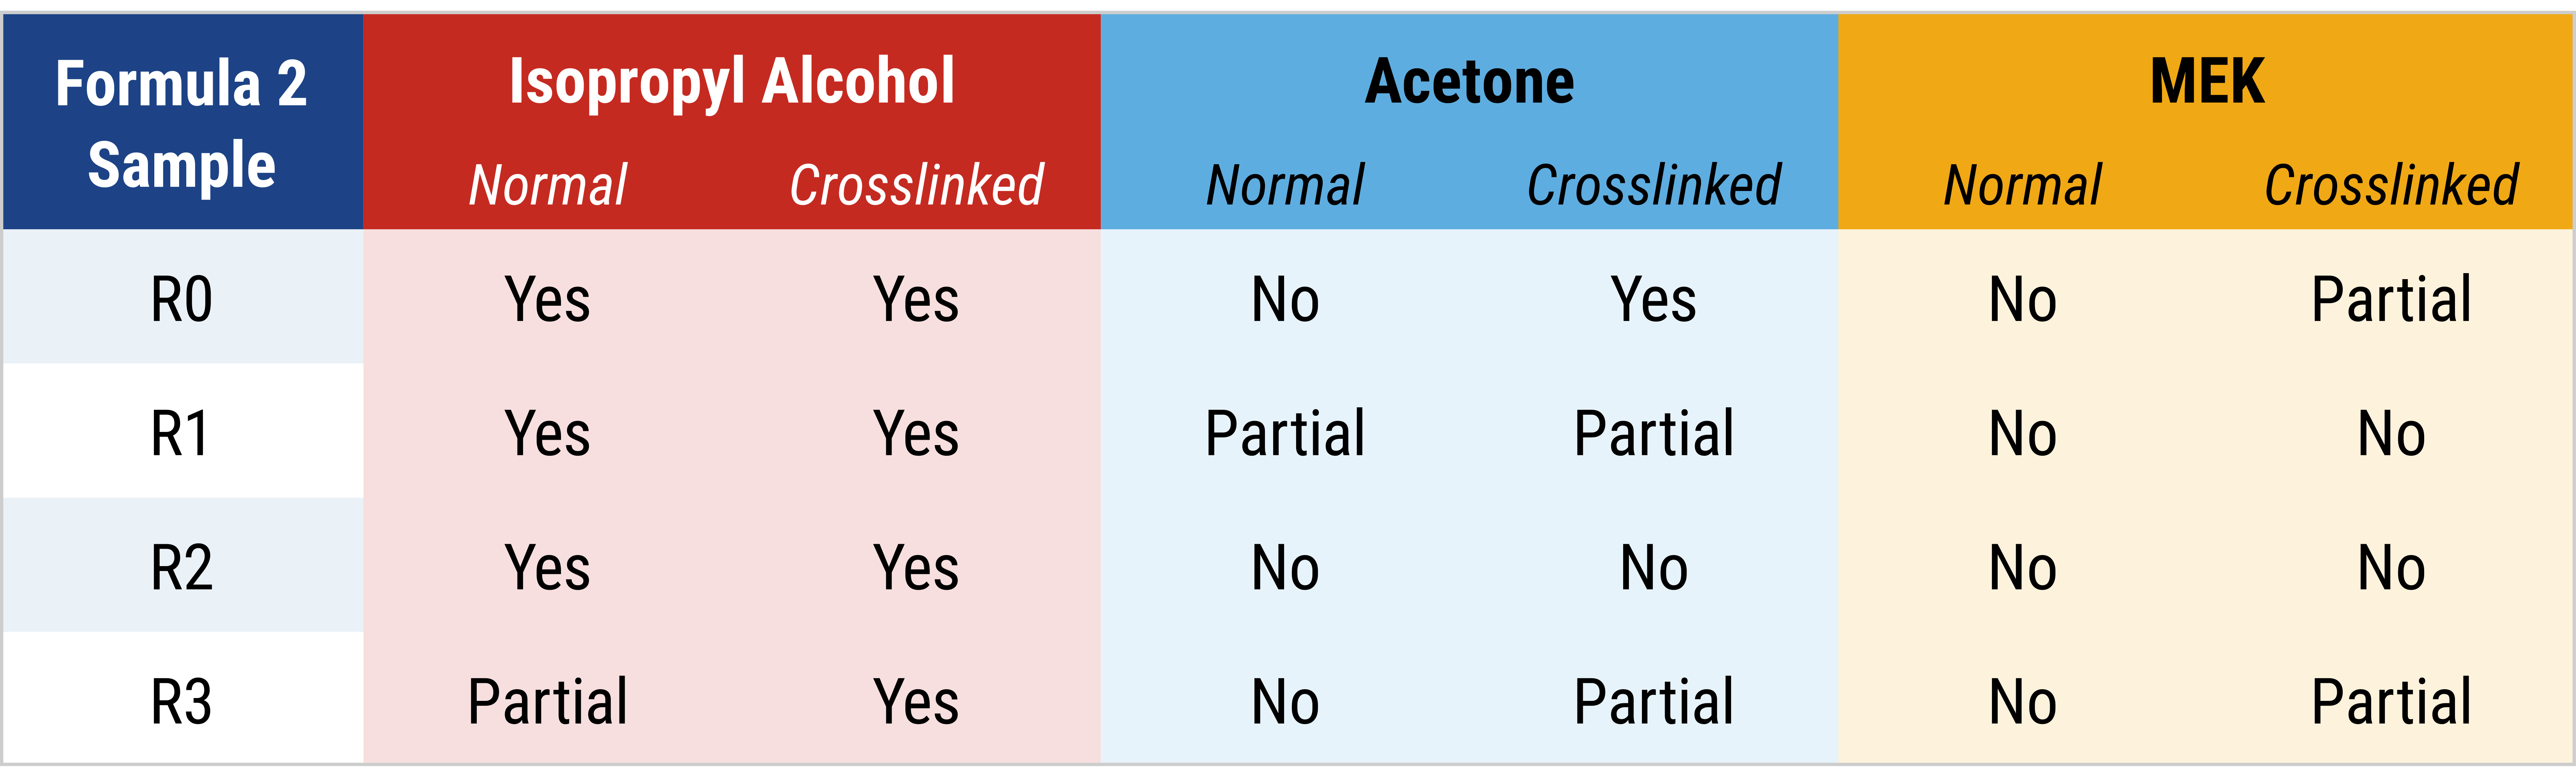
Table 6 shows that the samples of the standard Formula 2 were relatively similar in chemical resistance. The R1 formulation showed slightly greater chemical resistance than R0 and R2, while R3 provided slightly poorer resistance. However, the crosslinked versions of samples R0 and R3 showed significant improvements in chemical resistance, reaching partial resistance to methyl ethyl ketone (MEK). A “yes” rating signifies no film alteration, a “partial” rating signifies slight film alteration and a “no” rating signifies complete removal of the film.
Conclusion
The results from this series of tests, including accelerated aging stability, UV weathering for color and gloss retention, salt spray resistance, dry film hardness, film adhesion and chemical resistance, indicate that R2 has advantages over the other two PVDF water-based resins, R1 and R3. Across the scope of testing, viscosity and pH values for R2 during accelerated aging remained consistently lower than those of the other resins and were consistent between formulations. In the color and gloss retention tests, R2 also displayed lower ΔE values and smaller changes in gloss across both formulations.
During salt spray testing, R2 showed lower creep from the scribe and a lower failure rate when evaluating the degree of blistering. Additionally, all PVDF resins exhibited slightly higher hardness than the all-acrylic standard, as shown in Table 5 (page 27). In substrate adhesion testing, all samples performed with similar adhesion across the tested substrates, with the exception of R1, which also demonstrated low adhesion failure on steel and heat-treated plastic.
References
1 IUPAC. Definitions of Terms Relating to Reactions of Polymers and to Functional Polymeric Materials. Pure Appl. Chem. 2003, 75, 189–218. https://doi.org/10.1351/pac20037501189.
2 Dössel, K.-F. Top Coats. In Automotive Paints and Coatings, 2nd ed.; Wiley-VCH: Weinheim, Germany, 2008; p 175.
3 Smith, J.; et al. Polymer 2001, 42, 345–356. https://doi.org/10.1016/S0927-7757(01)00507-6.
4 Jiao, C.; Sun, L.; Shao, Q.; Song, J.; Hu, Q.; Naik, N.; Guo, Z. Advances in Waterborne Acrylic Resins: Synthesis Principle, Modification Strategies and Their Applications. ACS Omega 2021, 6, 2443–2449.
5 Kwaambwa, H. A Review of Current and Future Challenges in Paint and Coatings Chemistry. Prog. Multidiscip. Res. J. 2013, 3, 75–101.
6 Alaaeddin, M. H.; Sapuan, S. M.; Zuhri, M. Y. M.; Zainudin, E. S.; Al-Oqla, F. M. Properties and Common Industrial Applications of Polyvinyl Fluoride (PVF) and Polyvinylidene Fluoride (PVDF). IOP Conf. Ser.: Mater. Sci. Eng. 2018, 409 (1), 012021. https://doi.org/10.1088/1757-899X/409/1/012021.
7 Nivedhitha, D. M.; Jeyanthi, S. Polyvinylidene Fluoride, an Advanced Futuristic Smart Polymer Material: A Comprehensive Review. Polym. Adv. Technol. 2023, 34, 474–505. https://doi.org/10.1002/pat.5914.
8 Wang, W.; Vaessen, D.; Peterson, B.; Miller, A. Advances in One-Component PVDF-Acrylic Hybrid Dispersion and Its Applications. CoatingsTech 2025, July/August issue; American Coatings Association: Washington, DC.
9 American Architectural Manufacturers Association (AAMA). AAMA 2605-05: High Performance Organic Coatings on Architectural Aluminum; StarRail, 2005.
This article compares various PVDF resins used in the NeverFade Exterior Paints product line manufactured by APV Engineered Coatings.
Learn how resin selection influences long-term durability and performance in modern Industrial Coatings formulations.
Looking for a reprint of this article?
From high-res PDFs to custom plaques, order your copy today!