Deposition of BaTiO3 Nanoparticles by Electrostatic Spray Powder Charging

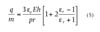
In most models of ESC behavior, Pauthenier's equation is critical to the calculation of the maximum deposition thicknesses and to the spatial distribution of deposited particles.7-15 Today, the most common and widely accepted equation for modeling the charging of powders during electrostatic deposition is Pauthenier's equation. It is given by:
where m is the mass of the particle, E is the breakdown electric field of (E=3MV/m), e0 is the permittivity of free space, er is the dielectric constant of the powder, r is the bulk density of the material, r is the
particle radius.5
While there are several sophisticated modeling schemes that model the deposition behavior, Mazumder et. al. presents a model that is straightforward and works decently for particles as small as 10 µm. This model uses the electrostatic adhesion and repulsive forces to calculate the maximum deposition thickness that a particle of a particular size can produce through ESC deposition without the presence of back ionization (also called orange peel).
To model the adhesion and repulsive forces in respect to particle size, Mazumder et. al. noted the electrostatic forces acting on a charged particle situated on top of a charged powder layer.7 The attractive image force on the particle is given in Equation 2 (above)
The net repulsive forces are given in Equation 3 (above)
where a is the volume fraction of the powder layer and q/m is the charge to mass ratio as given by Pauthenier's equation, R is thickness of the substrate and t is the thickness of the powder layer.
Mazumder's work plotted the attractive and repulsive forces with respect to film thickness while holding the particle size constant.7 They found that as one increases the film thickness, the attractive force increases at a slower rate than the repulsive forces. The intersection between the two graphs shows the maximum film thickness that can be created by a particle of a particular size.


Experimental
The particles were deposited using a Versa Spray II gun that was vertically mounted in a custom-made Plexiglas booth. Inside the booth was a sample platform that consisted of a grounded metal grid platform, which allowed for a gun to substrate distance of ~36 cm. The substrates were 1 cm x 1 cm silicon dies upon which 500 nm of Ti and 2 µm of Cu were subsequently deposited by sputtering. Because airborne nanoparticles are of unknown toxicity, we developed a safety protocol to protect personnel as well as a facility for their containment.Using our barium titanate powders of three distributions, ~2 µm, 123-85 nm and 10-1 nm, we performed three trials at 0 V and 60 kV for a total of six trials per particle size. For each trial, we sprayed six dies for a total of 36 dies per particle size. In total, we prepared 108 samples.
We calibrated the gun spray pattern by first spraying uncoated steel plate and noting the powder distribution. We then adjusted the nozzle and/or stage such that a consistent spray pattern was formed. After the spray pattern calibration, the powder was weighed, and the substrates were placed on the stage. The fluidization pressure was adjusted to 30 psi followed by voltage adjustments. We then sprayed 0.3g of material onto the substrates. Following spraying, we wait for 30s before turning off all equipment.
Between trials, we cleaned the booth, gun and hoses to prevent cross contamination. Booth cleaning consisted of washing all panels with warm soapy water, followed by cleaning with multi-surface cleanser. The guns were cleaned by washing the fluidization pump, nozzles, powder supply hose, sample stage and powder supply hoses individually, ultrasonicating three times for 1hr (or until water is clear), followed by air drying and visual inspection.
Results and Discussion
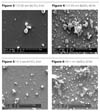
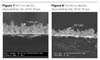
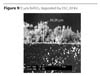
Comparing the results for 0 V and 60 KV it becomes immediately apparent that the use of a charging voltage increases surface coverage for all particle sizes (Figures 1-6). The 2 µm powder is evenly dispersed while both the 125 nm-85 nm and 10 nm-1 nm powders are more sporadic. As expected, the 2 µm particles yielded the thickest depositions. However, the maximum deposition thickness of the 125-85 nm particles are thinner than the 10-1 nm particles (17.6 µm vs.14.7 µm). This can be seen in Figures 7-9. This is in contradiction to the model. Looking at the results more closely yields a possible reason: agglomeration.
where h is an agglomeration constant. From the observations of the 0 kV depositions, we believe that this constant roughly ranges between 5 and 1000.
Conclusions
Since the popularity of ESC as a coating process became widespread, smoother, thinner coatings with better surface coverage have been improved by the reduction of particle radii. Extrapolating the trend may lead one to assume that the use of nanoparticles may show promise of improvement in these areas. While these improvements may be realized, one must note that achievement of these improvements is not as straightforward as current theories predict. Agglomeration, which becomes more prevalent as the particle radii is reduced, may affect the charging and ultimately deposition behavior. Thus powders with smaller particles deposited by ESC may display similar smoothness, thickness and surface coverage characteristics to powders containing particles several order of magnitude larger.
Acknowledgements
Dr. Wenping of Nanomech; Dr. Biris and Dr. Mazumder of UALR; Sandy of Powder Coating in Fayetteville; Dr. Leldon King of University of Arkansas; Mike and Jane Brosius of Engineering Research Center (ENRC); Danny Moore and Steven Woods of ENRC; my advisor, Dr. Ajay P. Malshe; and the rest of the crew that made this work possible.
Looking for a reprint of this article?
From high-res PDFs to custom plaques, order your copy today!


