Dissecting Orange Peel - A Process-Oriented Approach, Part 1
In late 2017, Saint Clair Systems, Inc., Carlisle Fluid Technologies and BYK Gardner formed a collaboration to definitively prove how common process variables combine and contribute to the formation of orange peel in highly critical painted surfaces. In this two-part series, we explore how this carefully crafted design of experiments (DOE) isolated and contrasted the impact and interaction of three key process variables:
- Film build
- Atomization, and
- Coating viscosity (as determined by temperature).
The subjective criteria used to evaluate their impact on finish quality was wave-scan balance and distinctness of image (DOI). While the first in this series of tests to be undertaken, the ultimate goal was to determine how to control orange peel and improve overall finish quality by managing critical process variables. In this series of articles, we will review the testing process, the data obtained and the analysis of that data.
Spoiler alert: Film build, atomization and coating temperature at the point-of-application all have a significant and interactive impact on finish quality, especially with respect to orange peel.
The Key Players
Carlisle Fluid Technologies is a global leader in precision finishing equipment and the parent company of five brands recognized globally for their pioneering history and finishing expertise: DeVilbiss, Ransburg, MS, BGK and Binks. They provided the facilities of their Toledo, Ohio, laboratory, the necessary robotic dispensing equipment and vastly knowledgeable personnel to facilitate the testing.
BYK Additives & Instruments, part of the ALTANA Group, is one of the world’s leading suppliers in the field of additives and measuring instruments. BYK-Gardner is their instrument section and they provided their Wave-Scan II laser measurement system and a team of talented folks to support it. Wave-Scan measurement technology is the global “gold” standard for objective orange peel and distinctness of image measurements.
Saint Clair Systems, a globally known leader in the field of temperature and viscosity control for more than 25 years, supplied an in-booth, point-of-application, 2K paint temperature control system to set and maintain the clearcoat at any desired temperature throughout the course of the testing.
Why Focus on Orange Peel?
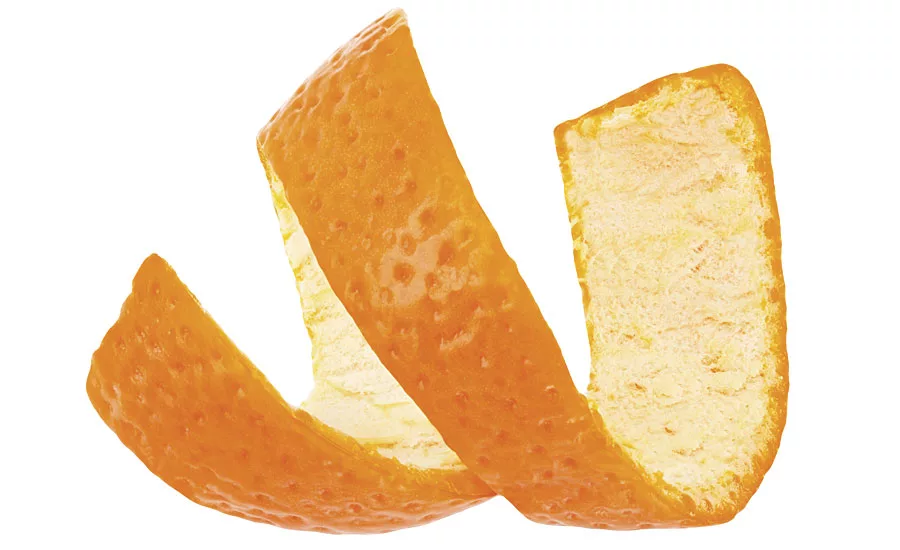
It’s obvious. Which is to say it’s obvious to everybody with the naked eye. Color, while immensely important, is very subjective, and variations can be hard to detect visually. Likewise, one person’s gloss may be another person’s semigloss. And though there are instruments for subjectively measuring both color and gloss, orange peel, as shown in Figure 1, is obvious even to the untrained eye.
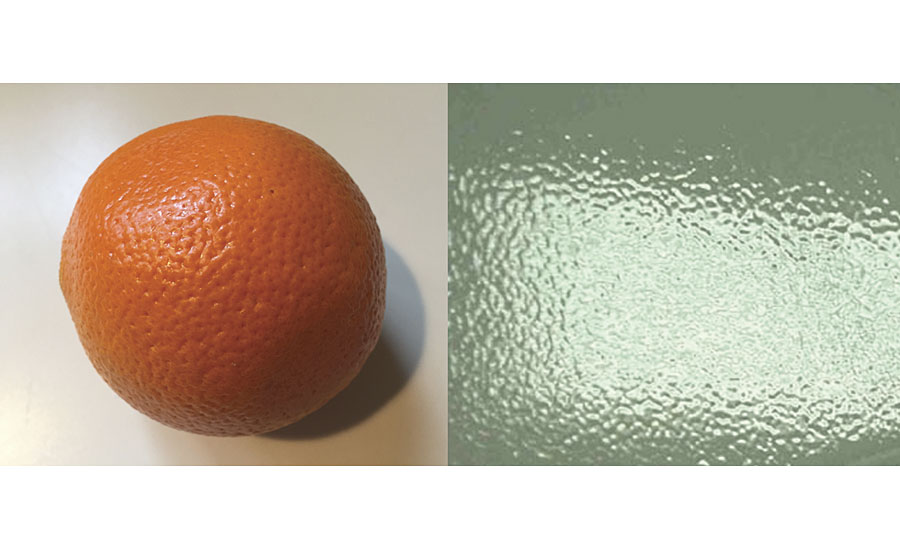
FIGURE 1 » Examples of orange peel.
Who Cares About Orange Peel?
Orange peel is generally considered to be an appearance problem, but there are a host of reasons products are coated that go well beyond improving the aesthetics. Coatings provide protection against such things as scratches, moisture, corrosion and UV damage. They may also affect the performance of the part in its final application. Reducing drag is a key function of coatings in the automotive, aerospace and aeronautical industries. Consider automobiles, airplanes, wind turbine blades, boats and submarines, even rockets, missiles and torpedoes. The structure of their surface finish determines the drag coefficient as they pass through the air or water. Smoother surfaces produce lower drag, and lower drag means greater efficiency and higher fuel economy. Practically, this can determine the miles per gallon of an automobile or the range of an airplane or missile. Consider the economic impact of orange peel in fuel cost for an airline and it is easy to see how this goes well beyond simple aesthetics.
But there is a cost to the aesthetic nature of orange peel as well. Consider the automobile example. Modern automobiles are comprised of many parts, each created from the material best suited for that part’s function. These parts are manufactured in facilities that offer the greatest comparative advantage, and thus, the lowest cost to the OEM. These factories may be in different states, or even different countries, from the assembly plant where they are all brought together into the final vehicle. This means a diverse array of substrates including various alloys of steel and aluminum, a range of thermoplastic and composite formulations, and many others, all of which are being coated in facilities tens, hundreds or even thousands of miles apart. Yet, they all have to match when they are brought together and placed adjacent to one other in the final assembly, where variations in finish quality stand out by comparison. This one common example shows the importance of establishing methods to control how the finish behaves in the final application in order to consistently meet the required rigorous appearance standards.
The automotive end customer is becoming more and more sophisticated. They not only expect a comfortable, quiet ride with responsive drive trains and handling packages, they also expect good fit and finish, both on the interior and exterior of the vehicle. The problem is that our customers expect something like what can be seen in Figure 2, and we’re asking them to accept something like Figure 3.
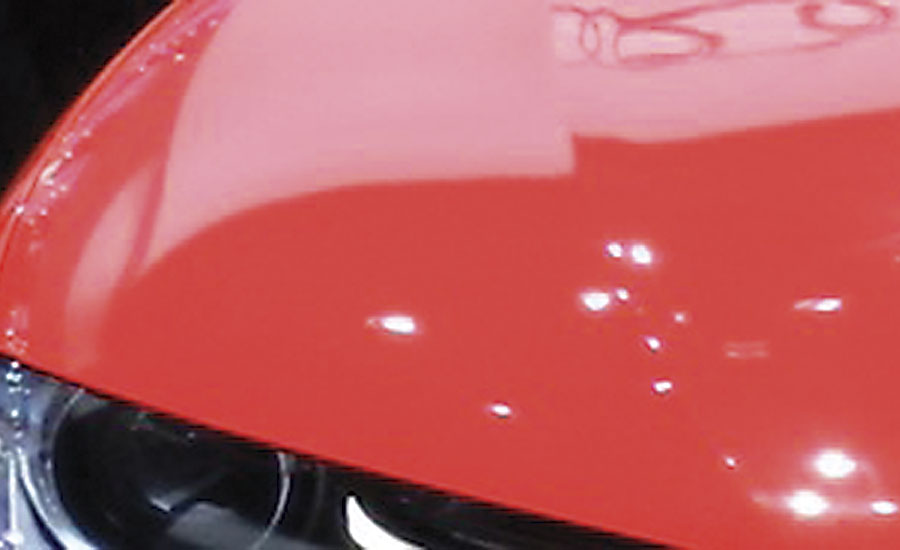
FIGURE 2 » Customer expectation.
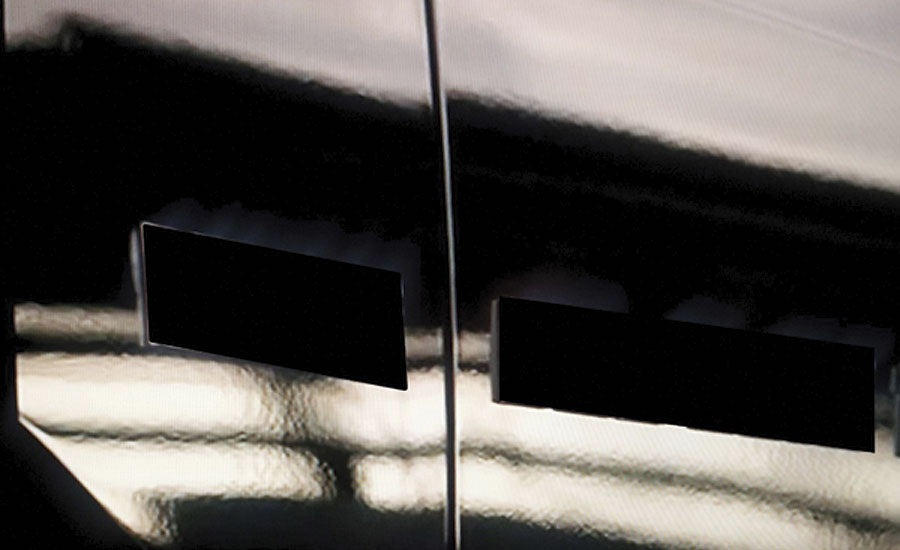
FIGURE 3 » What is sometimes provided.
Why Was the Testing Necessary?
As purveyors of process temperature and viscosity control systems for all kinds of fluid dispensing systems, we’ve been working with paint and coating users for more than 25 years. Over a time frame like that, you hear a lot of “rules of thumb” that processors use to guide their operations. Often times, they are based on observation and perception, rather than on sound science. One of those has to do with controlling temperature within a narrow window to maintain a consistent process outcome. Painters are no exception. Time and time again we have been told that, in order to control orange peel, it is necessary to maintain paint temperature within about a 3 °C window. And scale doesn’t matter, as ±3 °F is equivalent to a window of 3.3 °C!
For example, a Midwest manufacturer of high-end vehicle appearance and performance components found that a 3 °F variation in paint temperature resulted in unacceptable orange peel in their Class A finishes:
“As part of our ongoing continuous improvement plan at Roush, we decided to take a more aggressive approach to our temperature control in the paint shop. The resulting quality improvement was immediately noted and helped drive our FTC (First Time Capability) up and sustain it where we needed it to be.” - Patrick Henterly, Roush Manufacturing.1
We’ve come to call it “The 3-Degree Rule”. Three is a busy number. Things happen in threes. Like sneezes. Bad things seem to come in threes. We’ve even come to use colloquialisms like, “Third time’s the charm” when we are trying to get something right. But it’s not superstition. There is actually a great deal of data to support our “3-Degree Rule”.
One example we often cite is the temperature viscosity curve for the common Valspar solventborne paint shown in Figure 4. This shows the typical nonlinear relationship associated with coatings over the normal ambient temperature range. It is worthwhile to note that this is shared with virtually all liquids and is a physical property not a defect. But what’s import here is that Valspar states that the optimum application viscosity range for this coating material is 26 ±2 seconds. When this is extended over to the curve and projected down, as shown in the graph, we can see that it correlates to a 3 °C window from 26.5 °C to 29.5°C. If the paint temperature is outside of this narrow 3 °C window, it will be outside of its optimal viscosity range and finish problems will result. Problems with orange peel, gloss, color match, adhesion, blistering, etc.
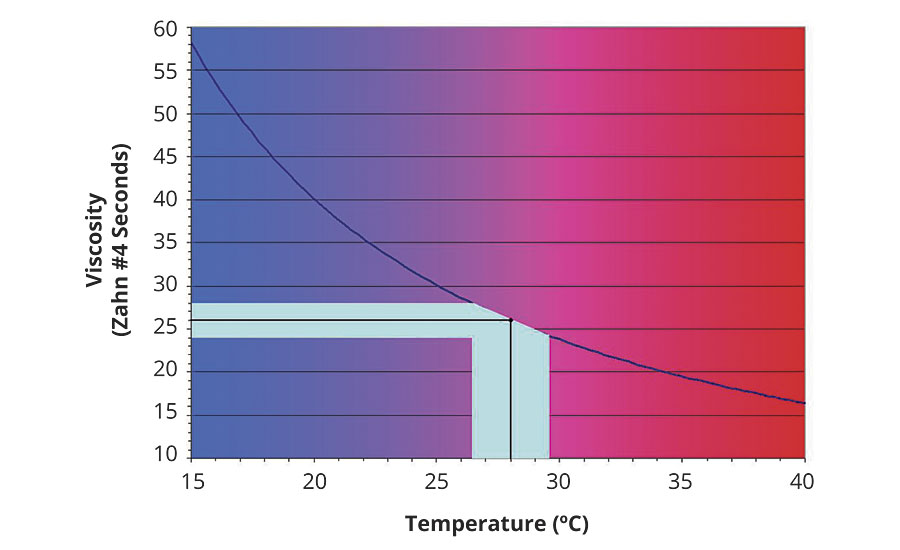
FIGURE 4 » Paint viscosity vs. temperature curve for Valspar 080 White.2
Supporting Field Data
In the July 2013 Digital Edition of PCI magazine, our article, Paint Temperature Control Solves Finish Defects, revealed a study performed with an Automotive Tier I supplier in Spain, in which we examined the impact of temperature on finish quality in a production setting.
In what was to be our first in-depth testing utilizing the BYK Wave-Scan measurement system as our criteria, we ran multiple racks of parts at different temperatures to determine the impact of temperature on paint finish quality. This customer’s criteria was the calculated shortwave and longwave balance and Distinctness of Image (DOI). The impact of temperature on these measurements was striking, as shown in Figure 5.
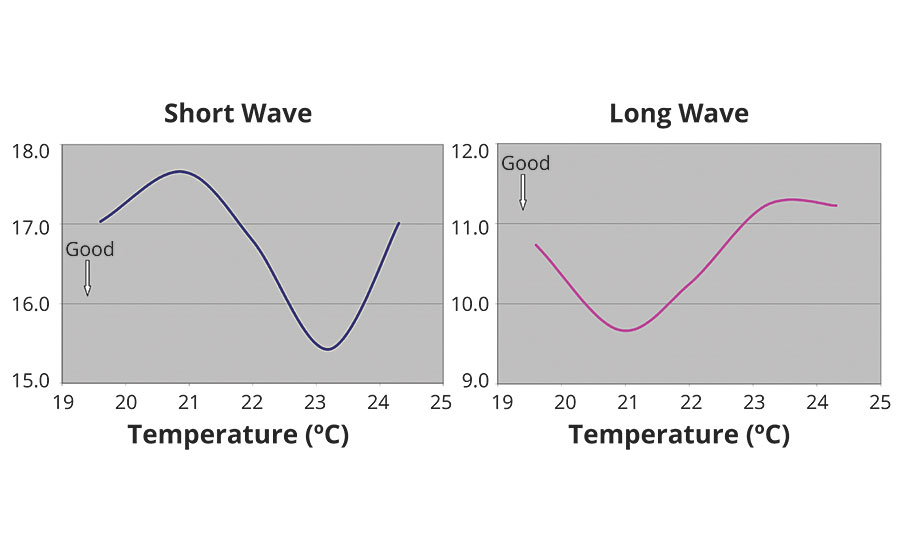
FIGURE 5 » Shortwave and longwave vs. temperature.
Here we see optimal shortwave performance at just above 23 °C, whereas the optimal longwave performance occurs at approximately 21 °C. Furthermore, the shortwave plot is virtually an inversion of the longwave plot.
Note that these two plots cover the same 19-25 °C temperature range and three-step Wave-Scan range. If we overlay these two data sets on the same graph, as we have in Figure 6, we can see the shortwave-longwave balance as a function of temperature.
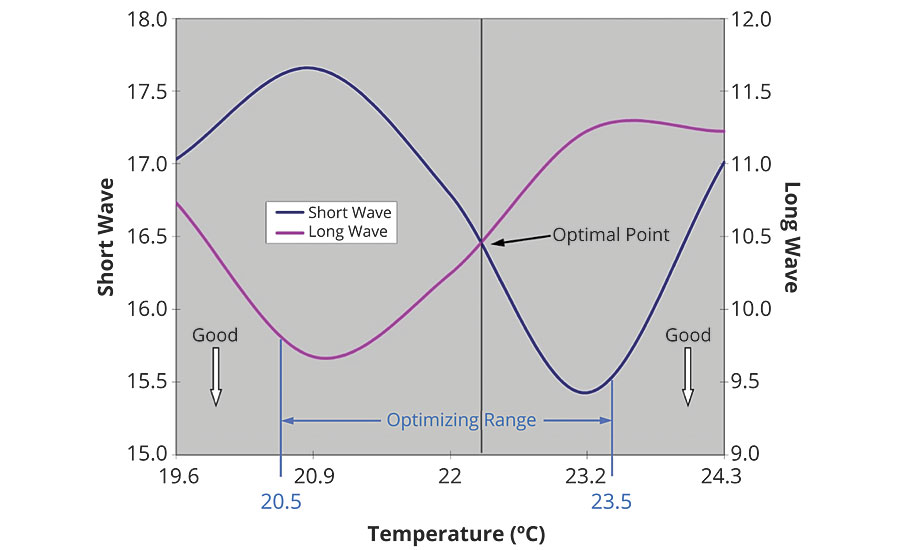
FIGURE 6 » Shortwave-longwave balance.
This shows the balance point to optimize both shortwave and longwave parameters occurring at about 22.3 °C. Increasing in temperature toward 24 °C will optimize shortwave performance, sacrificing longwave. Conversely, reducing temperature toward 21 °C will optimize longwave performance, sacrificing shortwave. This provides the ability to shift the balance between shortwave and longwave in the surface finish simply by adjusting coating temperature during application. Note the 3 °C optimizing range for this balance – again, the “3-Degree Rule”.
Why is Process-Based Testing Important?
Most paint lab testing is done with drawdowns. Traditionally done in the flat using a drawdown bar, either manually or with a machine, they are ideal for testing film-related parameters like color, opacity, dry film build, gloss, pigment dispersion and curing stability, just to name a few.
The problem with the drawdown method is that it does not directly emulate the final production process. To begin with, drawdowns are often done on a paper or plastic card as opposed to the actual substrate. Next, automobiles and airplanes, snowmobiles and jet skis, motorcycles and boats, ships and submarines, wind turbine blades, rockets and missiles are all comprised of a mix of vertical and horizontal surfaces combined with complex curves, none of which can be coated with a drawdown bar. This is the reason that they are sprayed. In short, the drawdown process ignores substrate concerns, and spray process variables like atomization, air drafts and evaporation, just to name a few.
In order to produce directly applicable results, the test methodology must simulate the production process and be performed on a similar substrate.
Creating a Process-Based Test
The stated purpose of this test was to emulate the automotive painting process, so we decided to perform the test on ACT 12” x 18” e-coated cold-rolled steel test panels. Because of the number of combinations and permutations involved in the three variables in our DOI, we also decided to narrow our focus to spray the panels only in the horizontal with a rotary bell atomizer, reserving the vertical spray exercise for a future testing opportunity. In addition, we decided that, since most coaters believe that orange peel is formed in the clearcoat layer, we would focus this test on that layer. This fit well with using the e-coated test panels, as they provide a smooth, consistent finish over which to apply the clearcoat. This eliminates any variations that might otherwise be attributed to the basecoat layer. This allowed us to focus on the impact of our three selected variables on clearcoat performance without interference.
A common PPG 2K automotive clearcoat was provided for this testing. A standard Fanuc P250 paint robot, resident in Carlisle’s Toledo Lab, was selected to reproduce the same path, speed, distance and angle to the “part” on each panel. It was equipped with a Ransberg RMA 560 Bell to handle the atomization, and that was coupled with their RCS (Ratio Control System) to control clearcoat flow rate, resin/catalyst ratio, cup speed, and shaping air. All of this was set up in their side-draft test booth as shown in Figure 7.
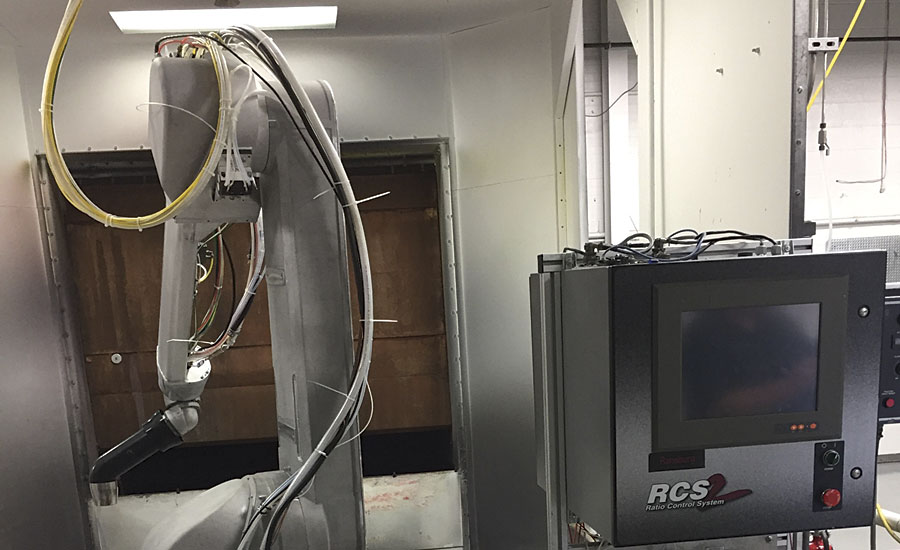
FIGURE 7 » Robot with bell and RCS.
As with most laboratories, Carlisle’s Toledo Lab is a climate-controlled environment. Ambient was continuously monitored and found to hold throughout the testing process at 70 °F ±1.0 °F. All of the test panels were stored in this environment to assure a stable substrate temperature during testing.
In order to manage the clearcoat temperature (and therefore its viscosity), a Saint Clair Systems in-booth point-of-application Temperature Control System (TCS) was used. This system was comprised of SCS’ AT-5900 TCU (Temperature Control Unit), shown in Figure 8, and patented Recorable Coaxial Hoses, one for the resin and one for the catalyst, shown on the robot in Figure 9. These were connected to our patent-pending temperature-controlled 2K Mixer Block, shown in position on the robot arm in Figure 10, which replaces the common Y-block and not only provides backflow control, but also connects directly to the static mixer just before the bell inlet. An RTD fitted into the resin path provides temperature feedback to the TCU to assure that the temperature of the clearcoat being fed to the bell is held constant throughout the entire test. This system also enabled the clearcoat temperature to be rapidly changed and stabilized so that each set of panels could be painted at a different temperature. This simulates the change in paint temperature being fed to the bell as the temperature changes from morning to night or from season to season.
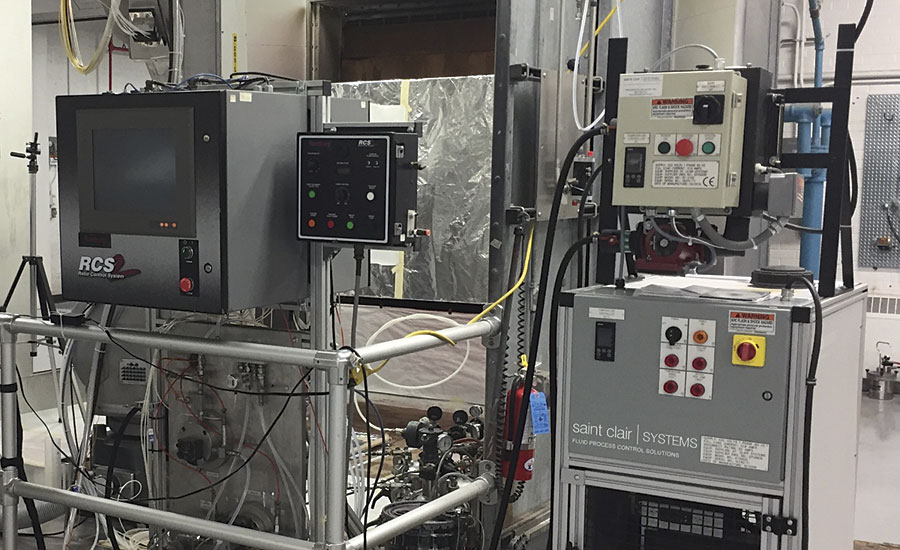
FIGURE 8 » RCS and TCU.
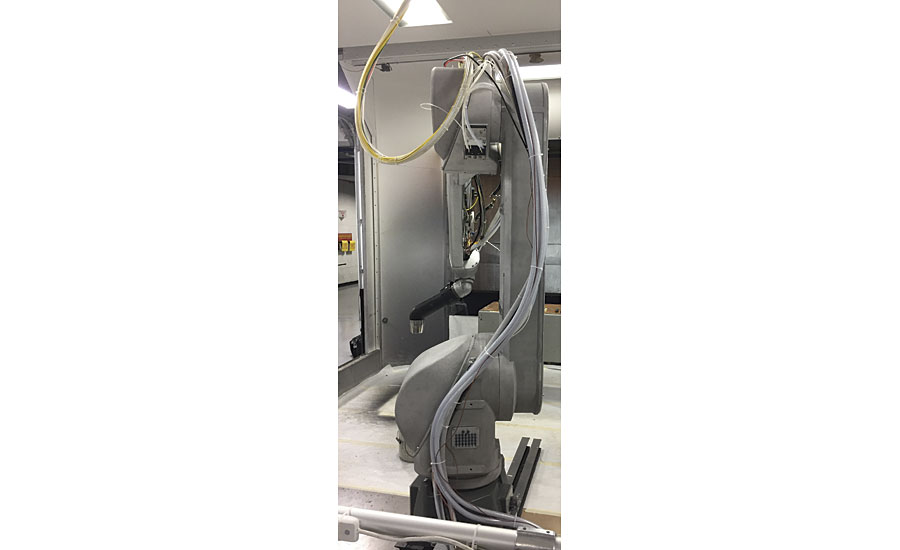
FIGURE 9 » Recorable coax hoses on robot.
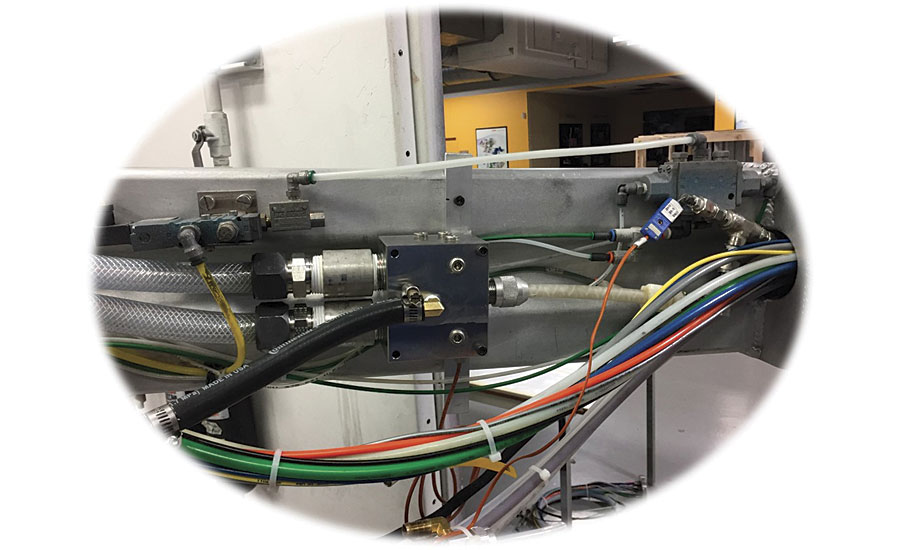
FIGURE 10 » Temperature-controlled 2K mixer block.
Process Definition
All steps in the test process were designed to simulate a production line process. In order to promote the higher film builds required for most clearcoats, it is commonplace to apply them in a two-pass operation. To simulate this taking place in two sequential booths, a 1-min flash time was set in between passes. Then, to simulate the travel through the flash tunnel to the oven, a 10-min flash time was inserted after final spray, prior to curing. Based on PPG’s recommendations for peak metal temperature and duration, the cure parameters were set at 25 min in a 275 °F oven, cured in the flat.
To delineate the test procedure, it was necessary to set the boundaries and increments on the variables in our design of experiments. These were defined as follows:
- Film build would range from 1.4 mil to 1.8 mil in 0.2‑mil increments.
- Atomization, set by cup speed, would range from 25K RPM to 45K RPM in 10K RPM increments.
- Clearcoat temperature would range from 65 °F to 105 °F in 5 °F increments.
- With these limits defined, we could set about to creating the test panel set.
Creating the Test Panels
The first step in the test procedure was to set the film build. In order to keep the robot program identical for all panels, the film build was set by changing the clearcoat flow rate with the RCS – a simple task given its inherent ratio management features. This was approximated first by calculation and then fine-tuned by spraying a panel, curing it and measuring the dry film with a Fischer Scope. This process was repeated until the desired film was established. Since this was the longest setup, all subsequent tests were run at this film build to develop the entire panel set before moving on to the next film thickness.
Next, the TCU was set at 65 °F and allowed to stabilize. Once the temperature was stabilized, the cup speed was set at 25K RPM and the first panel was sprayed. The completion time was recorded, and it was set aside for its 10-min flash. The cup speed was then incremented to 35K RPM (a simple setting on the RCS) and the next 65 °F panel was run, its completion time recorded, and set aside for its 10-min flash. The cup speed was then incremented to 45K RPM and the last 65 °F panel was run, its completion time recorded, and set aside for its 10-min flash. To prepare for the next three-panel set, the TCU was set at 70 °F and allowed to stabilize, then the panels were coated at 25K RPM, 35K RPM and 45K RPM.
This sub-process was repeated, incrementing the temperature by 5 °F for each set until the three-panel set at the top temperature of 105 °F was completed.
As each panel reached its 10-min flash time, it was placed in the curing oven and the entry time recorded. At the end of 25 min, it was removed and allowed to cool to room temperature before being handled. This resulted in a set of 27 panels with a 1.4 mil DFT.
The flow rate was then increased to produce a 1.6 mil DFT and the process above was repeated to produce a set of 27 panels with a 1.6 mil DFT. Next, this entire process was again repeated to produce a set of 27 panels with a 1.8 mil DFT.
With the full 81-piece set of DOE panels completed, the next step was to measure the orange peel on the panels with the Wave-Scan II and analyze the results. In the final installment in this series we examine the measurement process and its applicability to this design-of-experiments, then perform an in-depth analysis of this data, draw conclusions, and define the next tests to be performed, as indicated by the results.
References
1 Letter of recommendation to Chuck Hasse, St. Clair Systems, Inc., reprinted by permission, courtesy of Patrick Henterly, Roush Manufacturing.
2 Paint Temperature vs. Viscosity data provided courtesy of Alsco Metals Corporation – Roxboro, NC.
Looking for a reprint of this article?
From high-res PDFs to custom plaques, order your copy today!


