Complete Appearance Control for Effect Paint Systems
The first generation of special-effect paints for automobiles used aluminum flakes to provide what the industry calls “dark and light flop.” When such a sample is tilted, its appearance changes. An instrument that has one viewing angle cannot capture all of the effects.
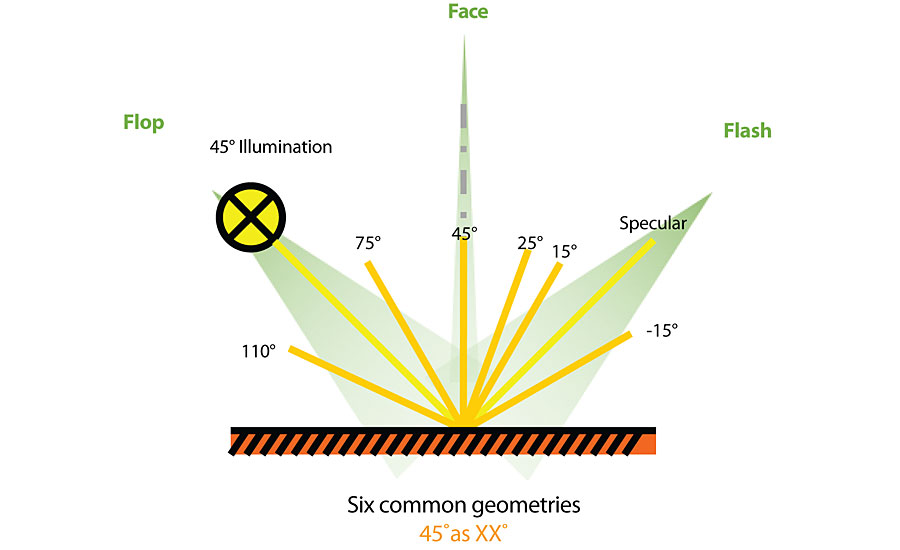
For non-colorful effects (aluminum flakes mainly) you need one angle for each regime to assess color (i.e. lightness) change between observation angles (Figure 1). Face is typically the main color information you see perpendicular to the sample surface, which is the angle where you see your face reflection, therefore it is called “face”. So, this angle is typically 45°as45° or r45°as45°. Flash is any of the three angles close to specular: 45as25°, 45as15 or 45°as-15° (not required for Al-Flakes). Flop is any of the two angles “from the lamp direction”: 45as75° or 45as110°.
The second generation of effect paints introduced more complexity with pearlescent pigments or “color floppers”. These are nano-coated pigments that break light into a shimmering effect. One of the most common is Xirallic ® from Merck, where aluminum oxide flakes are coated with a very thin film of, e.g., titanium dioxide, giving that extra sparkling effect.
This raises the need to be able to measure more color angles based on more than one direction of illumination. Also, automotive manufacturers require the ability to be able to quantify the sparkling effect of that pigment.
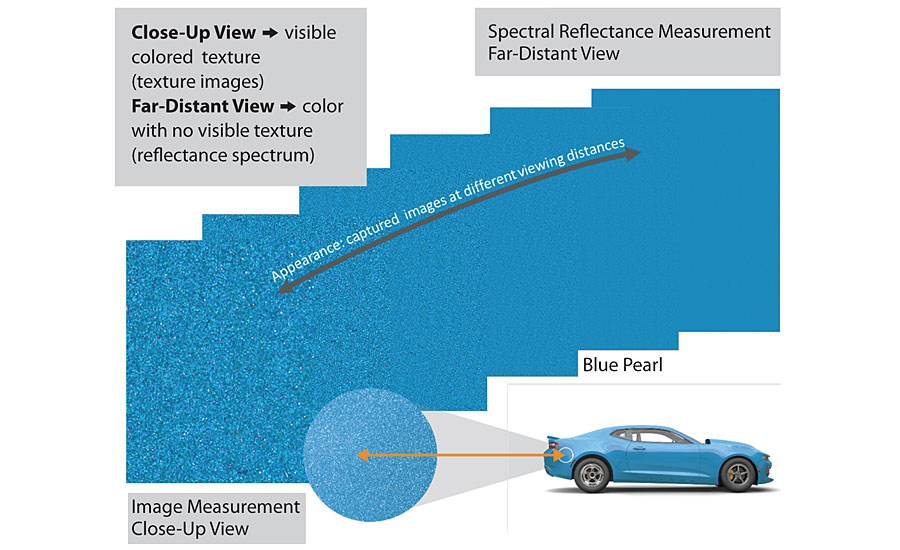
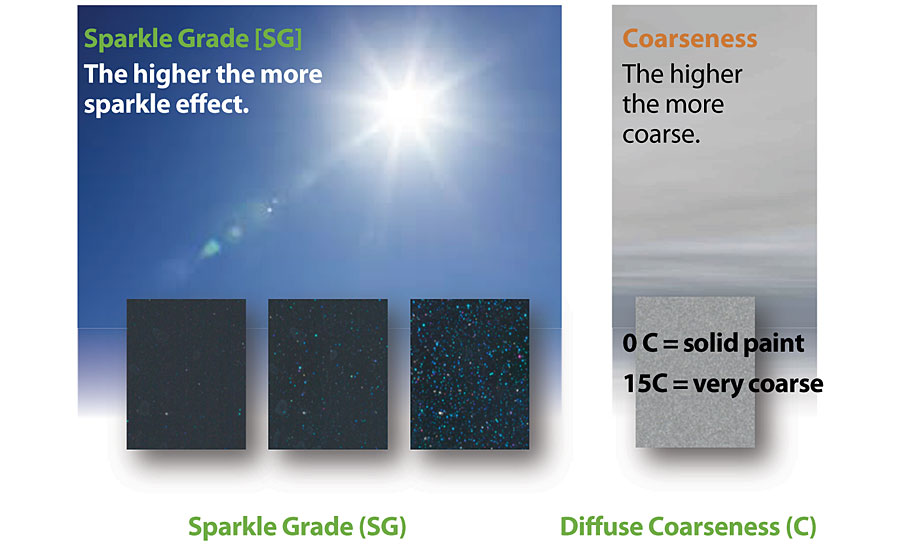
The two primary attributes of special-effect textures that we can see and measure are sparkle and coarseness. Sparkle is an effect seen under direct illumination, such as sunlight. It appears as little bright spots that reflect the light coming from the direct source. Coarseness is seen under diffuse illumination, such as a cloudy sky. It appears as an irregular pattern of dark and white variations.
Visual impression of effect coatings depends on angles of illumination and observation, and illumination and viewing apertures.
Upon closer observation, the flake reflections under direct or diffuse illumination become more evident and change the appearance of the color. The best way to achieve accurate coloration in close-up viewing is to account for the sparkle and coarseness that gives a color its character. Having the ability to measure texture allows color specialists to achieve their intended color when viewed from any distance and especially when viewing up close (Figure 2).
Appearance Measurement Instrumentation
Two different and orthogonal texture features have been proposed for the assessment of visual texture of gonioapparent surface coatings requiring adequate illumination and viewing conditions: graininess/coarseness and sparkle/glint impression. Currently there are two types of advanced appearance measurement instruments available on the market capable of determining radiometric and texture information of effect color shades at various directional and quasi-diffuse measurement geometries.
Both instrument types offer spectral information at six directional measurement geometries already recommended in technical standards (ASTM E-2194-03, ASTM E-2539-08, DIN6175-P2). These geometries can be realized in direct or reverse configurations, which according to Helmholtz’s principle of reciprocity, are equivalent. The difference between both configurations is inversion of illumination and viewing directions. In instrument Type 1, a direct optical configuration has been realized, while in instrument Type 2 the concept of reverse measurement geometries has been preferred. Reverse geometries shown in Figure 3 are indicated by the prefix ‘r’ in the geometry code notation (see also Table 1). The first angle xx in the geometry code xxasyy denotes the angular position of the light source; the second angle yy specifies the aspecular angle between the direction of the specular reflex (as) of a directional illumination and the angle of the detector channel.
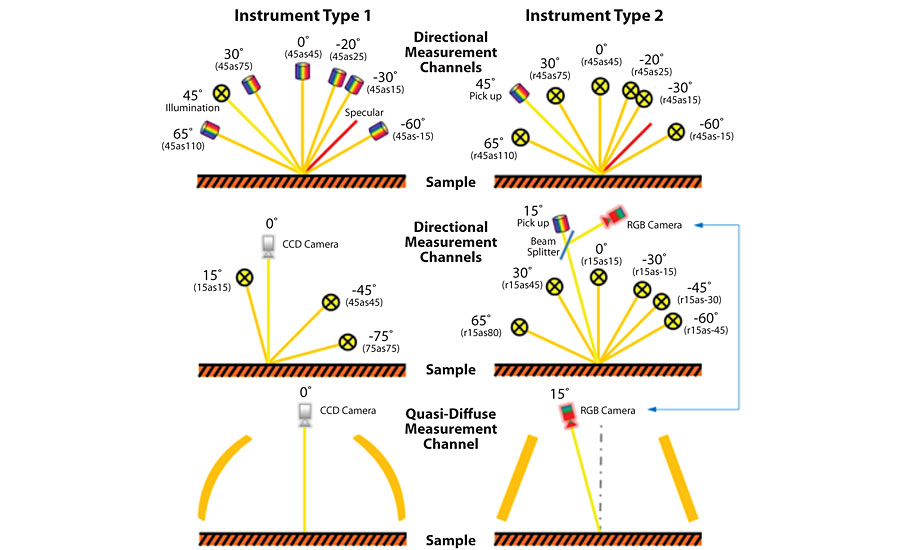
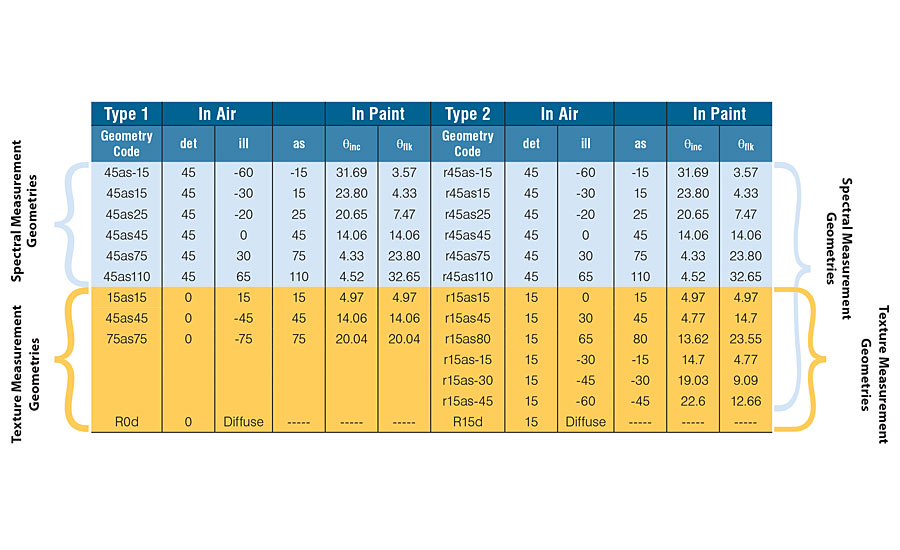
A number of viewing angles can be used, such as, (i) near-specular angles that are viewing angles in a range of about 15° to 25° from the specular reflection direction of the light source, (ii) mid specular viewing angles about 45° from the specular reflection direction, and (iii) far specular angles (also known as flop angles) that are in a range of about 75° to 110° from the specular reflex. Thus, all viewing angles are measured from the direction of the specular reflex of the light source, while illumination angles are referred to the normal direction of the surface of a coating (Fig. 3, Tab. 1).
All measurement geometries realized in both types of appearance measurement instruments are schematically depicted in Fig. 3 and listed in Tab. 1. Besides the above-mentioned six spectral measurement geometries, instrument Type 1 is equipped with three further directional measurement channels for the assessment of texture properties, while instrument Type 2 provides six further shared geometries for color and texture. The 15° detector channel is shared between spectral and texture pick-ups by using a beam-splitter in the optical path deflecting the incoming radiation towards a grating spectrometer and an RGB camera, respectively.
Furthermore, both instrument types are equipped with a quasi-diffuse measurement geometry for texture characterization with illumination apertures wide enough to simulate overcast sky viewing conditions and to ensure a good correlation between visual and instrumental assessments. Besides the different concept of texture assessment, a major difference between both types of instruments is the utilization of a black and white CCD camera (Type 1) and a colored RGB camera (Type 2), respectively.
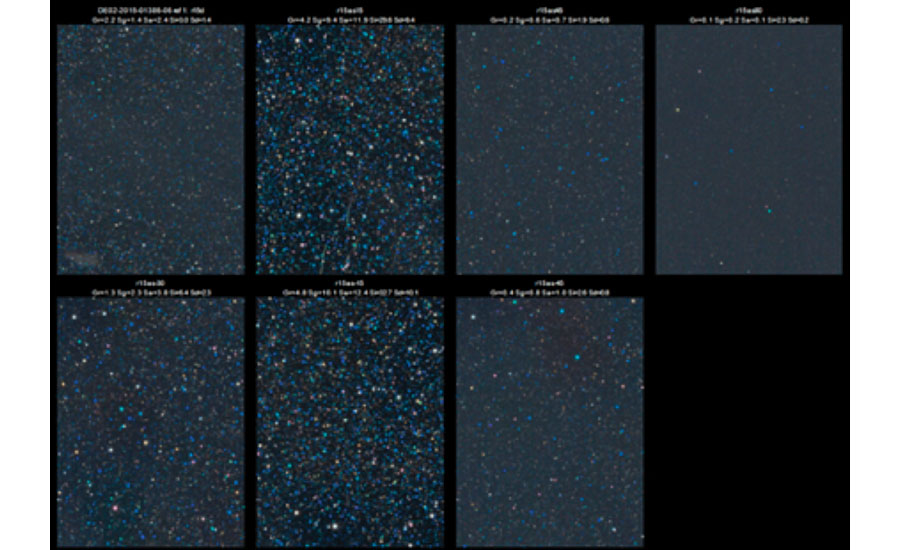
Sparkle Measurement
In gonioapparent surface coatings, platelet-like effect pigments (flakes) produce striking sparkle effects. These effect pigments, having typical lateral extensions of 5 to 40 µm, act as tiny mirrors and become visible when the surface coating is illuminated by directional light. The visual effect is a pattern of bright light spots exhibiting a high contrast to the background signal of the vehicle.
Optimal assessment conditions for sparkle patterns imply a sufficiently high luminance level so that the accommodated eye assumes a pupil diameter of typically smaller than 4 mm. A typical and representative observation distance is 250 to 500 mm. Likewise, the aperture angles of both viewing and illumination are important parameters. They determine the contrast, number, density and chromaticity of the sparkle spots that can be perceived visually.
In instrument Type 2 (Fig. 3), a concept for the image data processing workflow has been implemented, closely resembling the calibration structure for the established spectral color measurement. The general workflow is represented in Figure 4.

The raw data acquisition in the instrument is, in general, device-specific. This hardware part is generally proprietary to the instrument manufacturer. The calibration algorithms transform the raw data into a standardized output format, which has a device-independent definition and an encoding for defined reference conditions. This concept is the basis for general data exchange and the support and compatibility of different measurement technologies. It is also relevant in case of lifetime problems with important technology components like image sensors or LED light sources.
The calibrated output for the radiometric measurement channel is the reflectance factor spectrum, which is defined according to the standards of colorimetry (ISO11664) by a certain spectral resolution, wavelength range, spectral sampling interval and optical bandwidth.
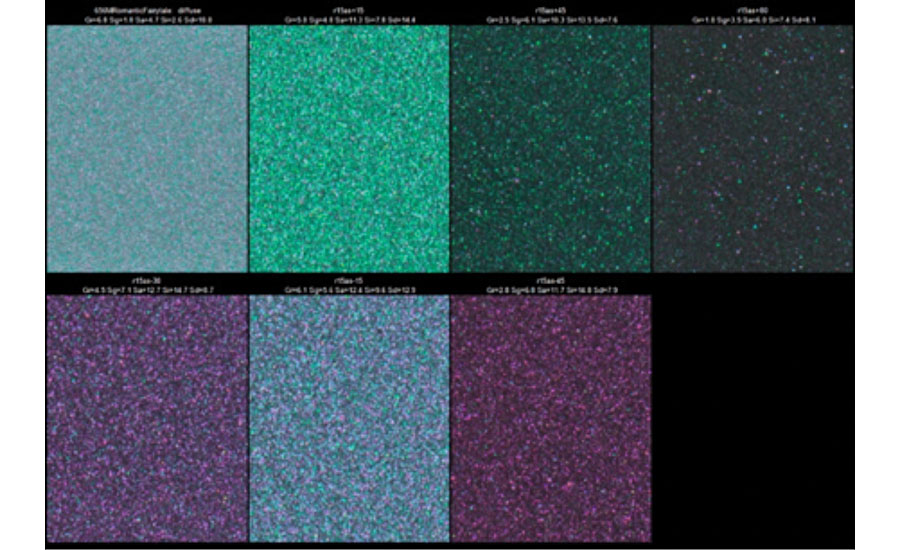
The equivalent to the reflectance spectrum for the texture measurement is a calibrated image, which contains all the physical texture information of a sample for a certain illumination-detection channel (Figure 5 and Figure 6). The manufacturer of instrument Type 2 has defined reference conditions for encoding image data concerning the optical bandwidth of the PSF, spatial resolution and calibration against the perfect white diffuser.
The calibrated image is the lowest interface level between the FW of the instrument and the application SW. Using appropriate image-processing algorithms, one can derive texture scale parameters from the calibrated image that correlate well with visual perception. In Fig. 4, this step is denominated ‘Texturimetry’ in relation to the established ‘Colorimetry’ for the spectral workflow.
Quantifying Texture
In case of the sparkle phenomenon, different assorted characteristics can be visually assessed to investigate their usefulness in constructing instrumental texture scales. Among these characteristic features are physical- and physiological-based parameters (Table 2).
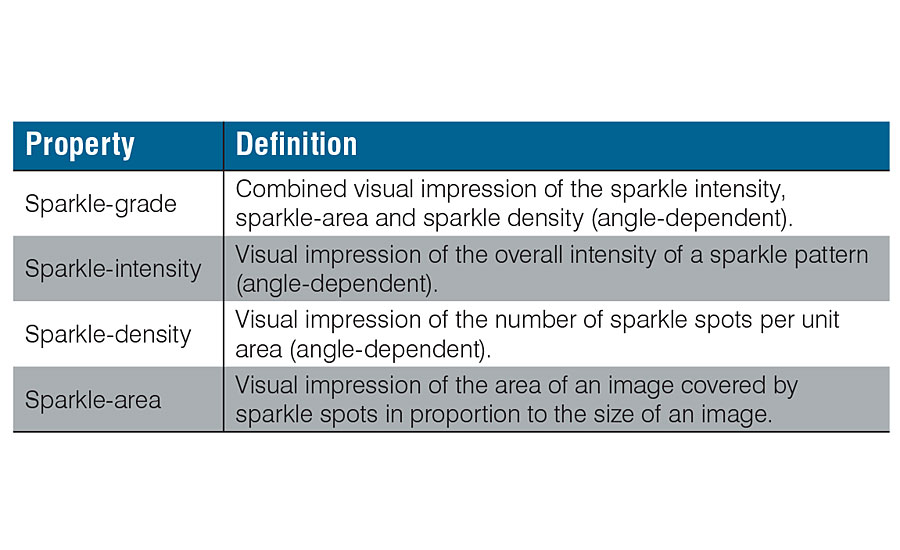
In a QC environment it proved to be difficult for observers to differentiate between sparkle area and sparkle intensity. All test persons in the different experimental settings were assessing the effect sparkle, which is the sparkle grade.
Exhaustive rank-order experiments carried out on a multiplicity of color clusters have revealed that the highest correlation between visual and instrumental texture scales is obtained for the sparkle-grade parameter, followed by the sparkle-intensity with slightly less correlation, while the sparkle-density is hardly correlated with visual perception. The latter observation also applies to the sparkle-area parameter as well as the background coarseness. The overall coarseness parameter for the angular and quasi-diffuse measurement geometries correlates well with visual perception.
More important was that Xirallics and mica pigments show colored sparkle, versus aluminum pigments that have white sparkles. With the evaluation of a black and white metric, the colored sparkles were merging with the background color and the measurements do not correlate with the visual perception. With the evaluation of all three color channels (as depicted in Fig. 3 by instrument Type 2), the color of the sparkles is considered in the evaluation logarithms. The visual perception was then found to be correlated with physio-psychological experiments.
There is a need to quantify texture under directional and diffuse illumination in QC applications (trial-standard comparison), in car refinish for searching database and automatic coatings development (to match appearance). The simplest terms are found to be:
- Sparkle grade captures the effect under directional illumination (sunny sky).
- Coarseness captures the effect under diffuse illumination (overcast sky) (Figure 7).
When to Use Sparkle and Coarseness Measurement
Finished goods often are made from multiple painted components that need to be visually acceptable. The said components may be sourced from multiple locations and consist of different substrate types (plastic, metal, etc.). This in turn can lead to different paint technologies being used (powder, spray, coil etc.).
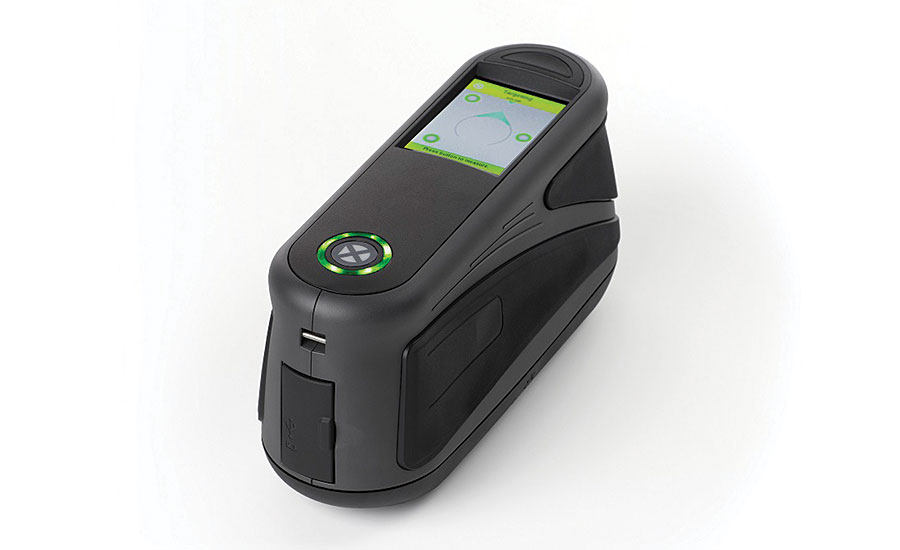
When performing comparisons between different paint technologies and pigment types, it is important to have a full measurement characterization that takes into account both multi-angle spectral color and texture attributes of sparkle and coarseness. Multi-angle spectrophotometers, such as the X-Rite MA-T range, are best suited to this type of application.
Both the MA-T6 and the MA-T12 follow the design structure of instrument Type 2 in Fig. 3. They use RGB cameras, instead of the simpler black and white camera of instrument Type 1, to generate HDR images.
The MA-T6 features six angles of measurement and a single source of illumination.
The MA-T12 features 12 angles of measurement with an additional source of illumination (Figure 8). This improves the performance of measuring hue-shifting pigments as they would appear from multiple viewpoints or lighting conditions. Both can capture sparkle and coarseness. Typically, the MA-T12 will be used by paint developers and laboratory operators who want to develop formulas for automotive, plastics and metal colors, and establish robust standards to be used throughout the entire supply chain.
Within a production process, once a paint formulation has been approved and the pigments and technology are fixed, the degree of variability seen due to changes in flake type or size are greatly reduced.
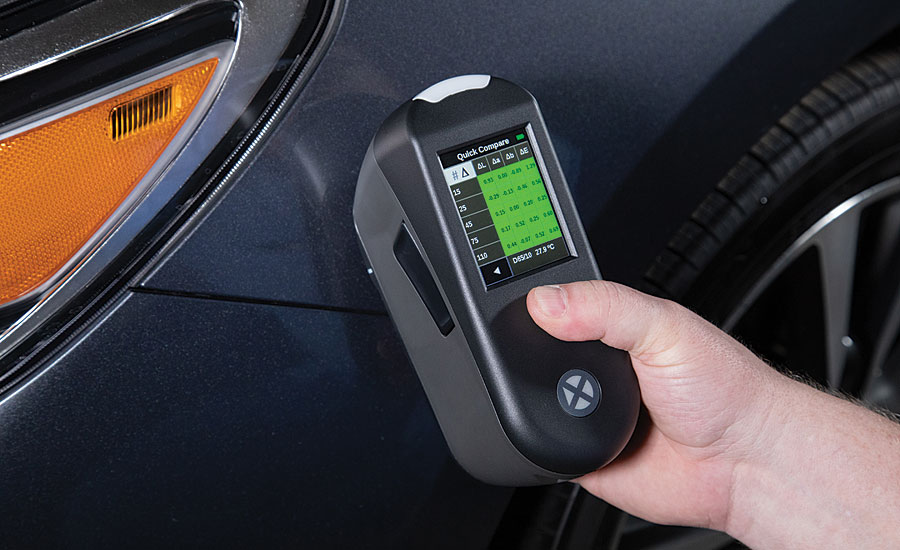
However, spray application and other environmental variables can cause wide color variance, typically due to the flake orientation in the paint layer. These manufacturing variables can be controlled with the use of simpler multi-angle devices such as the X-Rite MA-5 QC (Figure 9). This type of multi-angle device is ideally suited for production environments as it is compact, easy and fast to use. Features such as on-screen sample temperature preview helping reduce issues on thermochromic paint colors.
For more information, email info@xrite.com.
Looking for a reprint of this article?
From high-res PDFs to custom plaques, order your copy today!


