2004 Coatings Industry Report
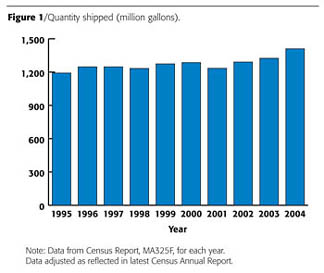
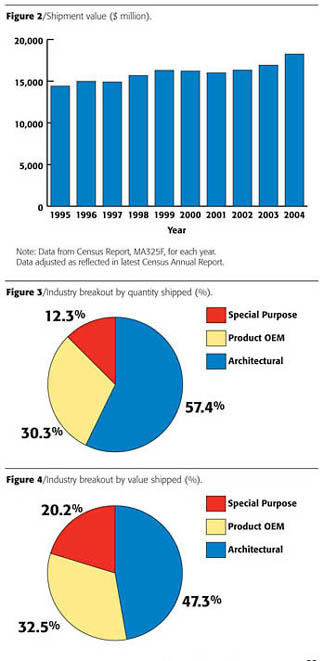
The coatings industry continues to set all-time records. The year 2004, compared to 2003, showed an increase of 6.4% in shipment volume to 1,410.1 million gallons. Shipment value increased by 7.9%, to $18,254.0 million. Figures 1 and 2 show the continued growth of volume and value, respectively, over the past 10 years. Over the past four years, the average growth rate for both volume and value shipped has been 4.5% per year. This is higher than the historical average of less than 2.5% per year.
Industry Segment Results
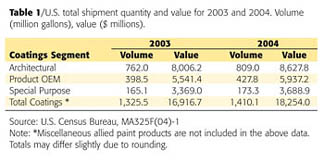
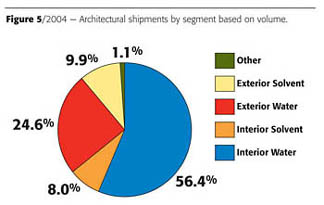
For 2004, industry segment breakout results are shown by volume in Figure 3 and by value in Figure 4. The data in Table 1 shows the segment totals for 2003 and 2004.The annual report indicates some major changes to the year-end totals for the Product OEM and Special Purpose coatings segments. Both of these segments were revised upward having shown good growth over the past couple of years. Although also revised, 2003 still was the low point for these two segments in the last several years. The Architectural segment has been consistent in its year-to-year growth since 2000. The annual revisions mentioned reduced the Architectural segment slightly, although the segment remained strong in 2004.
The Architectural segment in 2004 represented 57.4% of the total volume shipped and 47.3% of the shipment value. These are both down from last year, 1.5% down in volume and 0.6% down in value. The growth of the segment from 2003 was 6.2% in volume shipped to 809.0 million gallons, and up 7.8% in value to $8,627.8 million. This is excellent growth for the segment and reflects the ongoing home building and housing resale boom.
The Product OEM segment showed a surprising upturn in the annual report with a growth of 7.4% in shipment volume to 427.8 million gallons. The growth in shipment value amounted to 7.1% to a level of $5,937.2 million. These numbers are still below the peak year of 2000, but at least show a positive upward trend. The segment represents 30.3% of the total industry volume shipments. The individual product line categories will be examined further in this report to show the growth areas.
Segment Breakouts
The information in the rest of this article is taken from Table 2 of the Census Report MA325F(04)-1. This is mentioned since the totals for each segment differ slightly from the preceding analysis. Adjustments are always applied to the former numbers to reflect a total industry estimate. Since the following data was not adjusted in the Census report the analysis may appear confusing. However, the growth rates and relationships remain similar in both parts of this article.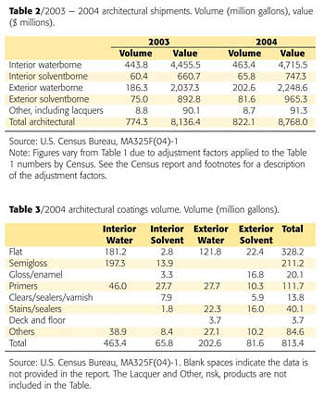
Architectural Coatings
There are many ways of analyzing the Architectural segment. Figure 5 shows the segment breakout by the major classifications of interior, exterior, water- or solventborne. Table 2 also shows this breakout with numbers for both 2003 and 2004, and includes shipment volume and value for each classification.As Figure 5 shows, waterborne architectural coatings represent 81.0% of the total coatings shipped in 2004. This is the second year of declining use of waterborne coatings. The decline, although small, is all due to a decline of interior waterborne shipments to 56.4%, a 1.1% decrease. Both interior and exterior solventborne and exterior waterborne all gained a small share. Just when solventborne coatings were considered to be declining, they are beginning to show renewed life with positive growth for two years in a row.
For interior coatings, waterborne represents 87.6%, another small decrease from the prior year. Solventborne interior gained a small share to 12.4%. For exterior, waterborne represents 71.3%, the same share as last year. Solventborne exterior coatings grew by 8.8% but continued to maintain the same share of total exterior coatings of 28.7%. Solventborne architectural coatings now represent 17.9% of total architectural coatings, an increase of 0.4% from 2003. Interior solventborne increased to 8.0% from 7.5% in 2003, which shows that improved solventborne coatings are again finding a niche. Newly improved solvents having very low VOC emissions are being used. These solvents improve the quality of the coating as well as eliminate offensive odors.
Total interior coatings sold was 64.4% of the total architectural segment, a decline from last year. Exterior showed improvement and now stand at 34.5% of the total. With the expanding number of home resales, exterior repainting is still needed, and even aluminum- and plastic-sided houses require sprucing up after 15 or 20 years, maybe only to change the color of the exterior of the house.
Lacquers and other architectural coatings remained almost the same in both 2003 and 2004.
The Census report provides further architectural coatings information. The categories are broad and sometimes overlapping, as shown in Table 3. As the table shows, the major classification is the finish/top coat, with flat leading, followed by semigloss and primers. Primers are important in both interior and exterior applications. In 2004, primer shipments increased to 111.7 million gallons from 100.6 million gallons, an increase of 11%. Since some coatings are sold for interior/exterior uses, the listing in the table may not give an accurate picture of where the coatings are being applied.
Stains are primarily used for exterior applications. Waterborne stains are preferred for exterior applications and are widely used, especially where solventborne stains are prohibited, e.g., in California. Total waterborne stains represent 55.6% of total stains shipped.
The size of the ‘other' category also points out the problem of accurate descriptive end uses for the coatings, since these ‘other' coatings amount to 10.4% of the coating uses. For additional information on the categories refer to the Census report MA325F(04)-1.
OEM Coatings
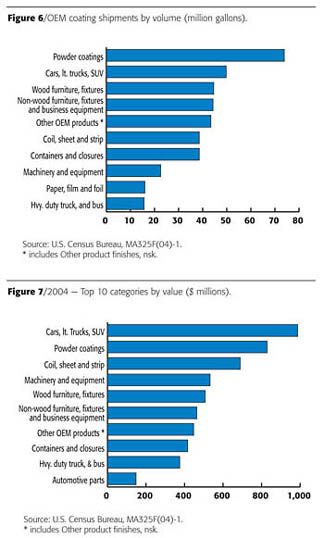
The OEM segment improved significantly in 2004 by 7.4% in volume of shipments, from a restated 2003 volume, which had shown a decline from 2002. The year 2000 set the record with 456.6 million gallons shipped for the segment. Shipments in 2004 recovered to 422.8 million gallons, a strong improvement for the segment. The results of the individual categories were very strong, with gains in almost all categories. Only Other Transportation (including railroad and aircraft), showed a small decrease. Electrical insulation coatings showed a major decrease, but it must be due to reporting or changes that occurred in the category due to merger or acquisition. Some of the individual powder categories showed declines, but the overall Powder coatings category grew.
The 10 largest categories included in the product OEM segment for 2004 are shown in Figure 6, listed in terms of volume shipped, and Figure 7, listed by value shipped.
Special Purpose Coatings
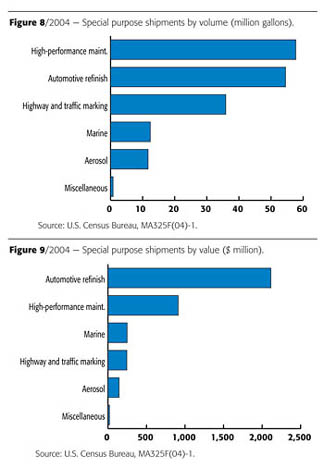
Special purpose coatings continued a seesaw shipment volume with 2004 being up 5.0% from 2003, which in turn had declined a little over 5.0% from 2002. The 2003 data for the segment was also revised upward significantly. The shipment value increased by 9.4% over 2003. The 2004 shipment volume amounted to 173.1 million gallons, and shipment value was $3,685.2 million, with a strong average of $21.29 per gallon price. Every category in the segment showed increases except for high-performance maintenance coatings, which were down 3.1%.The quarterly reports have consistently reported lower shipments, and almost every year the annual report revises the data to higher levels, even for the previous year. It is really hard to analyze this segment meaningfully since the numbers change from report to report. The 173 million gallon level seems to be appropriate for the segment since it appears to be about the average volume shipped over the years (over the past 16 years the average volume shipped for the segment has been 175.5 million gallons).
For 2004, the Special Purpose categories making up the segment can be seen in their relative size in Figures 8 and 9, for volume and value respectively.
Coatings by Related Groups
In order to view the various categories of coatings within the Product OEM and the Special Purpose coatings segments, the categories have been put in groups of similar industry interest. Table 4 shows these five groups together with the 2003 and 2004 shipment volumes and values. This table illustrates the size of the various related industry groups. To view the makeup of the various groups, a separate section follows for each group.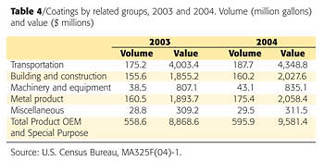
Transportation
The eight-category transportation group is the largest. All the coatings have a direct relationship to the transportation industry. Some of the Special Purpose coating categories are included because of their direct relationship to transportation. Table 5 shows all these categories for 2003 and 2004.What a difference a year makes. In 2003, most of the group's categories were down from the previous year. In 2004, all the categories are higher except for aircraft, railroad and other transportation, and automotive powder, which were down, both of which had shown growth in 2003. Total shipment value for the group was also a bright spot with an increase of 8.6%. The transportation group of coating categories with $4,348.8 million represents 45% of the shipment value of the Product OEM and Special Purpose coatings segments. Transportation-related industries are important end users of coatings. This group had an average $23.17 per gallon value of shipments, which is quite high.
Cars, light trucks, SUVs and automotive parts categories follow closely the trends of the U.S. automotive manufacturers. 2004 was a better year for U.S. automotive manufacturers, with more foreign cars being built in the United States. The average value per gallon for the cars, light trucks and SUV category was $19.83 per gallon. For automotive parts the value was $29.70 per gallon. The latter value is due to the number of very specialized coatings required by the parts manufacturers, such as, scratch-resistant lens coatings, fastener coatings, small plastic part coatings, etc. The relatively small volume of coating used in these applications, together with the need for long-life effectiveness, accounts for the premium paid for the coatings.
The heavy-duty truck and bus category gained almost 30% in volume shipped, with the shipment value increasing the same amount. This category finally forged ahead as the economy grew in 2004. The volume, 15.7 million gallons, was the highest since 1994 when the current categories were delineated. 2004 was a super year for this category.
The "other" transportation category, including aircraft, railroad and other types of coatings decreased 5.3% in 2004. It is still much below the boom years of 1998 - 2001, when over 12 million gallons were shipped. It is unfortunate that the census cannot break down the numbers further. It is likely that during the boom years, the railroad manufacturers were the very active part. Currently, the aircraft industry is becoming more active. The category should resume growth during the next year as more railroad and aircraft are needed to support the expanding economy.
Automotive powder coatings had a bad year in 2004 according to the report for the year. The volume shipped declined by over 30%. There were major acquisitions that took place in the powder coating industry that may have adversely affected the reporting to Census. The potential of automotive powder is still large, but alternate technologies keep improving and holding powder to small niche markets. If and when powder breaks out of its niche markets, the shipments could expand.
Marine coatings improved in 2004 to almost the normal level of production. The U.S. producers do not supply the manufacturers of new large ships that are produced in other countries. The larger coating manufacturers have foreign operations that supply the offshore marine industry. Offshore oil facilities in U.S. territories should require a considerable amount of repair and maintenance coatings, (part of this category) after the hurricane season just past.
Automotive refinishing had another good year, with an increase of 7.3% in 2004. This is the best result since 2000, and almost up to record levels achieved in the late 1990s. With the expanding number of automobiles owned in the United States the need for repair and refinishing continues to grow.
Highway and traffic marking paints increased 11.5% in 2004. The increase reflects the greater availability of Federal, State and local funds for highway maintenance. The category still has room for future growth, although alternate stripping technologies may reduce the growth.

Building and Construction
The Building and Construction group, shown in Table 6, includes five coating categories that relate directly to this group. Overall this group grew 3.0% in 2004. The group represents 26.9% of the combined Product OEM and Special Purpose segments. All categories in the group improved except the High Performance Maintenance coating category, which declined slightly, and Architectural powder, which remained even.The non-wood furniture, fixtures and business equipment category increased 5.7%. It remains in the normal level for the category. It was only exceeded by a few years in the 1990s. Wood furniture and fixtures increased 4.9% in volume shipped in 2004, while wood and composition flat stock gained 19.2%. With the continuing boom in the housing market, and growth in construction in general, the three categories all showed good growth during the past year.
The high-performance coating category, which had a decline of 3.0%, is still operating near normal levels. The decline held down the group since it is the largest category in the group. High-performance coatings are benefiting from the improved economy and should also be helped with repair and maintenance after the destruction caused by the 2005 hurricane season.
Architectural powder remained level from last year. This category has not grown over the past 10 years as far as the reporting indicates. There is a chance that some powder coating manufacturers do not report to the Census, or report in the wrong categories or as General Metal powder.
Machinery and Equipment
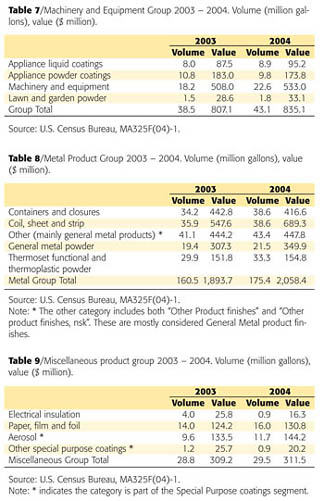
The machinery and equipment group consists of four coating categories. Table 7 shows the comparison of the various categories.Appliance industry coatings remained almost the same in 2004, with the coatings supplied down about 0.5% in volume, counting both liquid and powder coatings. Individually, liquid coatings increased, but were offset by the decrease in powder coatings. These two categories compete with each other for the finished appliance product. The total shipment value to the appliance industry also decreased 0.5% in 2004, all due to decreased powder coatings shipments.
The machinery and equipment category increased 24.2% in volume shipped in 2004. The quantity shipped in 2004 was the highest in over two decades. The shipment value also set a new record at $533.0 million. The average price per gallon in 2004 declined to $23.58. 2004 continued to be a good year for machinery and equipment coating sales. Obviously a large amount of equipment coated by the products in this category remain manufactured in the United States.
Lawn and garden powder volume shipments in 2004 increased by 20% over 2003, about the same as was shipped in 2002. Shipment value increased by 15.7%, and the average price per pound was $3.68 in 2004, compared to the $2.44 per pound two years earlier.
Metal Products Coating
The metal products coating group represents coatings for five categories that are used on metal, although they may be used by a variety of industries. The group is the second largest of the groups, with a 29.4% share of the volume shipped of the total Product OEM and Special Purpose Coatings segments. The shipment value is also the second largest with $2,058 million. The makeup of this group is shown in Table 8.Containers and closures coatings increased by 12.9% in volume shipped but the value declined 5.9% in 2004. The decrease in value shows the tight competitive nature of the market. The number of containers coated continues to increase, but fewer coatings are used per container, and new technologies have permitted lower costs.
Coil, sheet and strip coatings grew in 2004, with an increase in volume shipped of 7.5% and more significantly, an increase in value of 25.9%. It is good to see the coil coating industry grow together with the growing economy. New markets for coil-coated product continue to be developed as older ones decline.
The general metal category, including both liquid and powder coatings, increased about 7.3% in volume shipped in 2004. The value of shipments of these two categories increased 6.1% in 2004. The liquid general metal coatings represent about two thirds of the volume and 56% of the value of the two categories. Again the growth in the economy helped the growth of these general metal coatings categories. The peak years for the categories were 1996 - 2000, years of a booming economy.
The thermoset functional and thermoplastic powder coatings category grew by 11.4% in 2004. As with most of the coatings for metal, the value of these powder coatings did not keep pace with the volume growth, and increased only 2.0%. Data for the category is not reported separately and is derived by difference from the total powder coatings shipped and the powder shipments reported in the other powder categories. Due to the few reporting companies for the two parts of this category, thermoset functional and thermoplastic powder, are not reported individually by Census.
Miscellaneous
The miscellaneous group consists of four categories that do not fit in with the above groupings. Table 9 includes the remaining categories of both the Product OEM and the Special Purpose coatings segments.Electrical insulation coatings declined more than is realistic, and is likely the result of mergers or acquisitions that have taken place in the industry. The consolidation of the industry manufacturers of electrical insulation coatings and the spin off of some businesses may be adversely affecting the reporting of data to the Census department.
Paper, film and foil coatings increased in volume shipped by 14% and increased in value shipped by 5.3% during 2004. The category supplies much of its products to the transportation industry, thus the growth paralleled the growth of transportation coatings during the year.
Aerosol coatings are again being reported separately. The category increased by 21.9% from the restated 2003 data. The shipment value grew by 8.0% in 2004. The average price per gallon shipped was $12.32. This price is at the point of manufacture of the coating shipments and is not the retail price, which would be significantly higher.
The other special purpose coatings are those that could not be classified into the various categories of the segment. The small amount reported, only 0.9 million gallons in 2004, is 25% less than reported in 2003. The other special purpose products, although quite small in volume, did have a $22.44 price per gallon, which is quite high.
Powder Coatings
Powder coatings have been mentioned in the various groups above. Powder coatings are reported in pounds to Census and converted to gallons using a 5-pound-per-gallon conversion factor. For 2004, 369.7 million pounds were reported, and in 2003, a restated 362.0 million pounds. Powder coatings are no longer growing as fast as they once did. Markets that can use powder coating efficiently and economically have switched over from liquid coatings. However, liquid coatings have made technological advances in the past few years and are preventing further penetration of the market for metal products. The volumes of powder coatings sold are significant, but not growing as they did during the 1980s and 1990s. An increase in the average price per pound of powder coating did occur in 2004 to $2.24 per pound. Consolidations continue to occur in the industry. The future could be quite attractive, but depends on large customers investing in new coating facilities. This is slowing down the growth of powder coating usage.Caveats
Each year the U.S. Census Bureau collects data from establishments in the paint and coatings industry with 20 or more employees. These establishments represent approximately 95% of the total value of industry shipments. Inaccurate or lack of reporting affects the results of the survey. However, the data collected is still regarded as the best estimate of the coatings industry's performance. The report is published as part of the Census Bureau's Current Industrial Reports, as MA325F(04)-1, issued September, 2005. This article contains an analysis of the current data compared to data from the 25 previous years, together with knowledge of the makeup of the coatings industry.Looking for a reprint of this article?
From high-res PDFs to custom plaques, order your copy today!


